InetSoft's Health Informatics Software
In healthcare there is an immense amount of data to manage and keep track of. Not only do you need to monitor patients medical histories but there is a large and ever increasing demand for appointments which leads to scheduling and employee data metrics. Healthcare IT also encompasses many other critical facets including security measures in electronic health records. This is why the health informatics profession is vital for maintaining a viable healthcare system.
Healthcare informatics is a multidisciplinary field that uses information technology to manage patient healthcare information for effective clinical use. Having the ability to visually analyze all of these various data sets requires more than what can simply be done with excel, and top security measures are a key component in ensuring patient safety and satisfaction.
Security has developed into a major topic of concern in the health industry due to the use of electronic health records (EHR), particularly with specialized systems like psychiatry EHR that handle sensitive patient data. EHRs are used because of their ability to maximize patient efficiency. Since security is critical for protecting sensitive data, InetSoft offers a wide array of security features with their business intelligence software that is known for its ease-of-use and robust performance.


Fully Customizable Security Settings
There are significant advantages for BI software that can be utilized by all levels of employees within an organization. However, with most companies this causes a security breach as not all data is created equal. Security is especially important in healthcare due to the profound impact security leaks can have on patients lives. If patients fear that their information is not able to be properly protected they will forego seeking treatment when symptoms begin to occur. This fear-induced avoidance could cause illnesses that are easily treatable in the early stages to turn into a chronic or life threatening situation.
With InetSoft, maintaining top levels of security is a non-issue thanks to fully customizable security settings. Virtual Private Models (VPMs) can be used to access data remotely and different user roles are assigned to hide data sets, graphs, tables and more while restricting data returned by user query.
Companies can also utilize existing security measures for single-sign-on functionality, restricting editing access, creating alerts, and much more. Thanks to the wide array of security measures offered by InetSoft, various levels of employees can take advantage of BI technology to gain valuable insights.
Electronic Health Records Key Metrics
Electronic Health Records key metrics need to be monitored in order to be successful in maximizing clinical productivity and doing this requires more robust tools. InetSoft is known for its robust business intelligence and analytics software that will help organizations gain important insights from the following KPIs:
- System Uptime %
- System Downtime %
- Downtime Causes
- Reliability
- Latency
- Network Performance
- Server Performance
- End User Device
- Appointments
Low Footprint Means Maximum Efficiency
InetSoft's open source web based architecture means that companies who choose to embed this technology into their website will have the capability of running vital applications efficiently without impediment. InetSoft has many years of experience in making OEM-friendly BI technology that makes it easy for health informatics specialists to integrate this software into their website and meet their clients business intelligence needs.
Healthcare facilities can gain valuable insights into typical physician and nursing practices, patient care and satisfaction, distribution of labor, administration, management, and latest medical studies from the sophisticated and highly visual analysis tools offered through InetSoft. This is all easy-to-use and easy-to-implement thanks to advanced data mashup technology that integrates data from a large variety of sources supplementing or eliminating the need for IT-intensive ETL and data warehouses.
The Pioneer of Data Mashup Technology
Since 1996 InetSoft has been delivering easy, agile, and robust business intelligence software that makes it possible for organizations and solution providers of all sizes to deploy or embed full-featured business intelligence solutions. As the pioneer of data mashup technology, InetSoft offers a unique cabilibility of allowing end-users freedom and flexibility because of its ability to synthesize data from a wide range of disparate sources. This mashup feature means that companies can bypass intense ETL data warehouses if they choose to in order to save time and money. With the integration of advanced business intelligence software and machine learning capabilities end users can extract more information from their data in a manner proven to be highly accurate and effective.
More Articles About Informatics
- Fully Customizable Security Settings — Explains how granular role-based controls, Virtual Private Models, and single sign-on protect sensitive EHR data while enabling broad self-service. Highlights a focused set of EHR KPIs—from uptime and latency to device and network performance—that informatics teams can monitor in one place. Emphasizes a low-footprint, OEM-friendly architecture that fits clinical workflows without heavyweight infrastructure.
- Most Common Causes Of Death — Showcases live, click-through dashboards including a healthcare informatics mortality analysis that surfaces leading causes of death across demographics. Demonstrates drill, filter, and brushing interactions that help analysts move from population trends to granular cohorts. Positions interactive dashboards as a faster way to test hypotheses than static reporting.
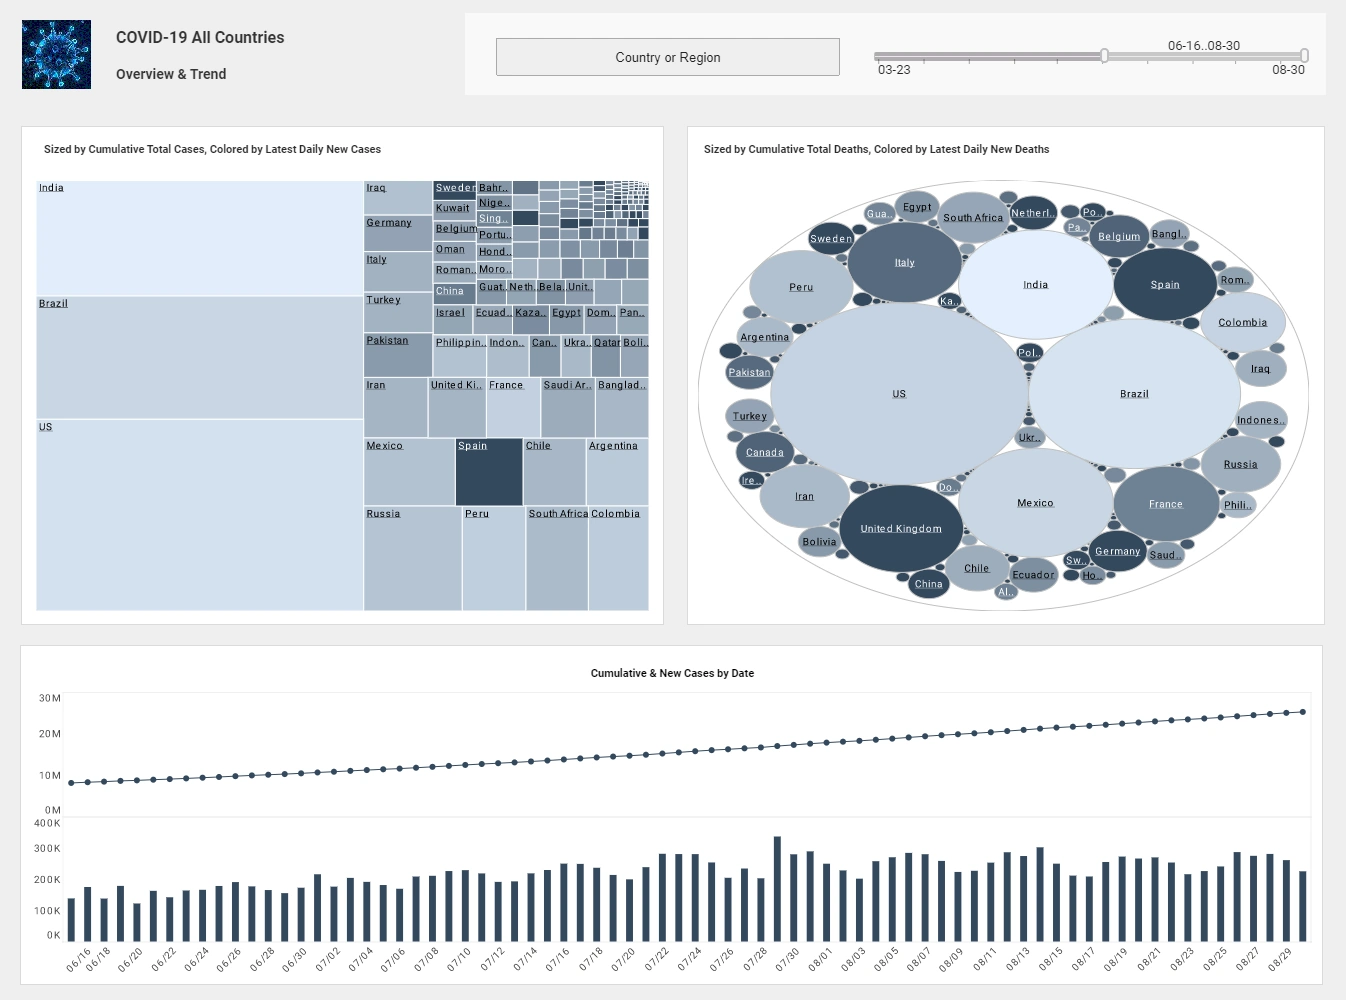
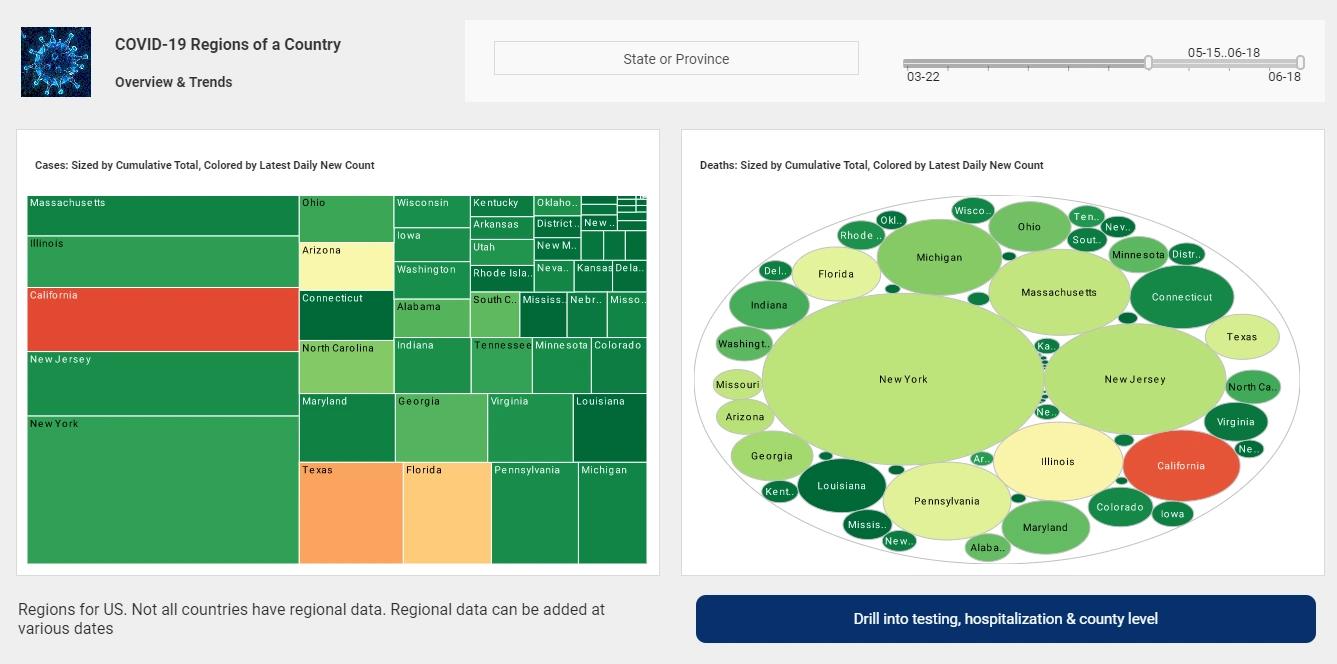
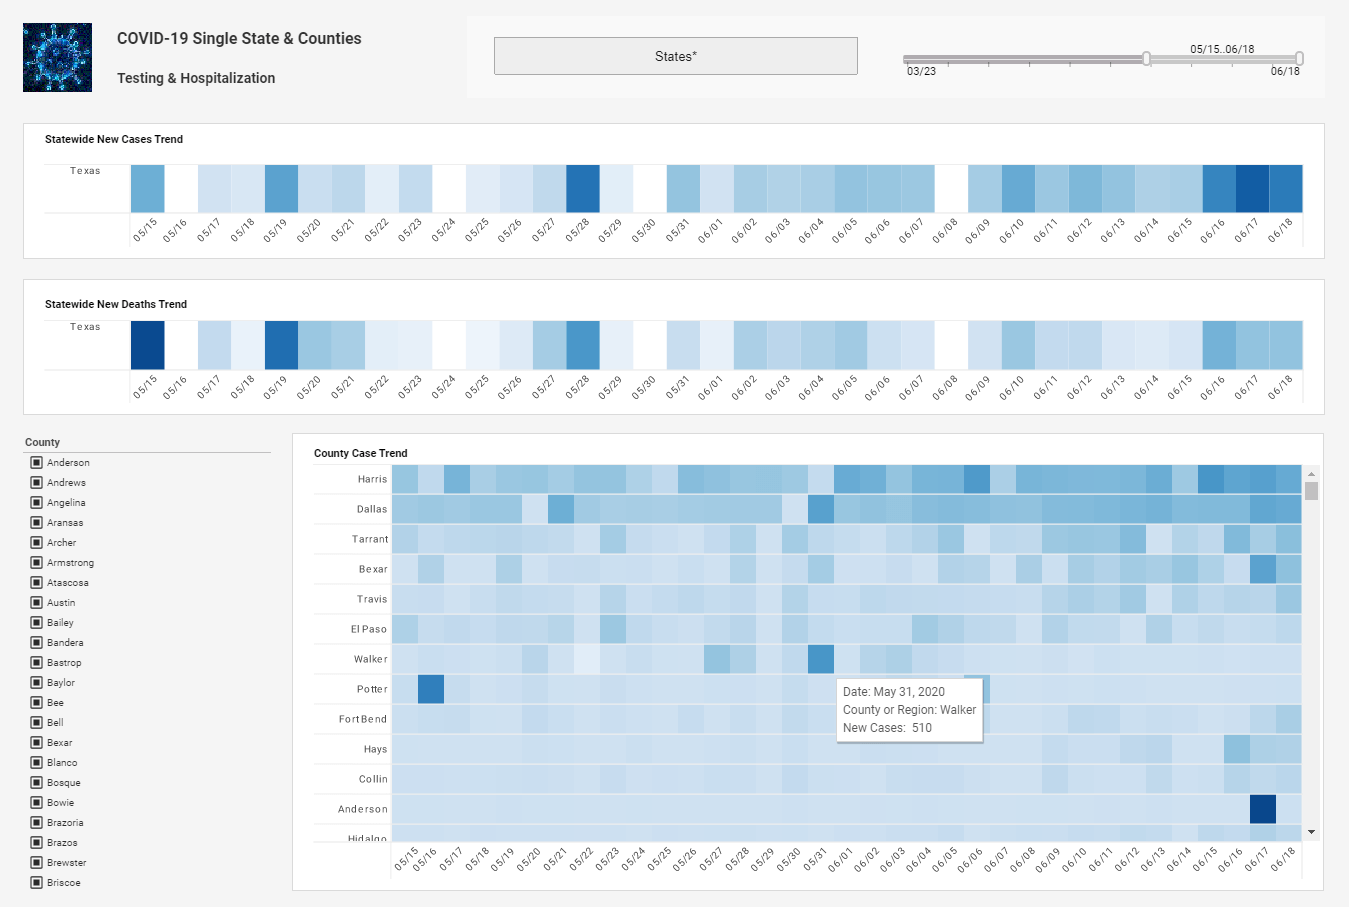
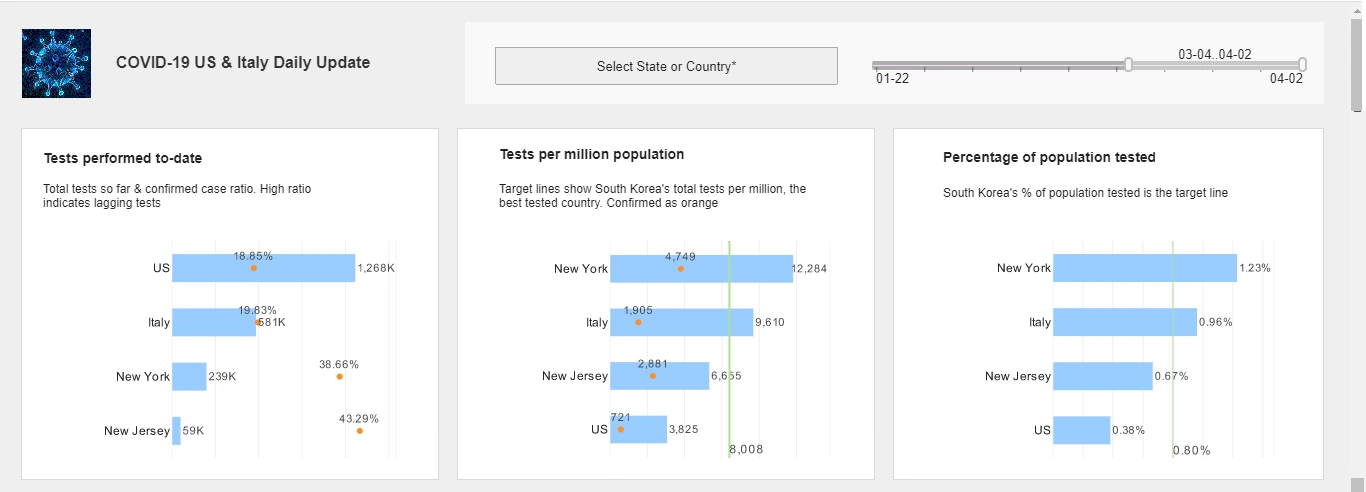
- COVID-19 Informatics Dashboard Example — Walks through a pandemic dashboard that uses monochromatic scaling to distinguish measures from categorical dimensions. The example illustrates day-by-day case trends and how color intensity encodes magnitude without clutter. It’s a compact lesson in visual encoding choices that informatics teams can adopt for epidemiological monitoring.
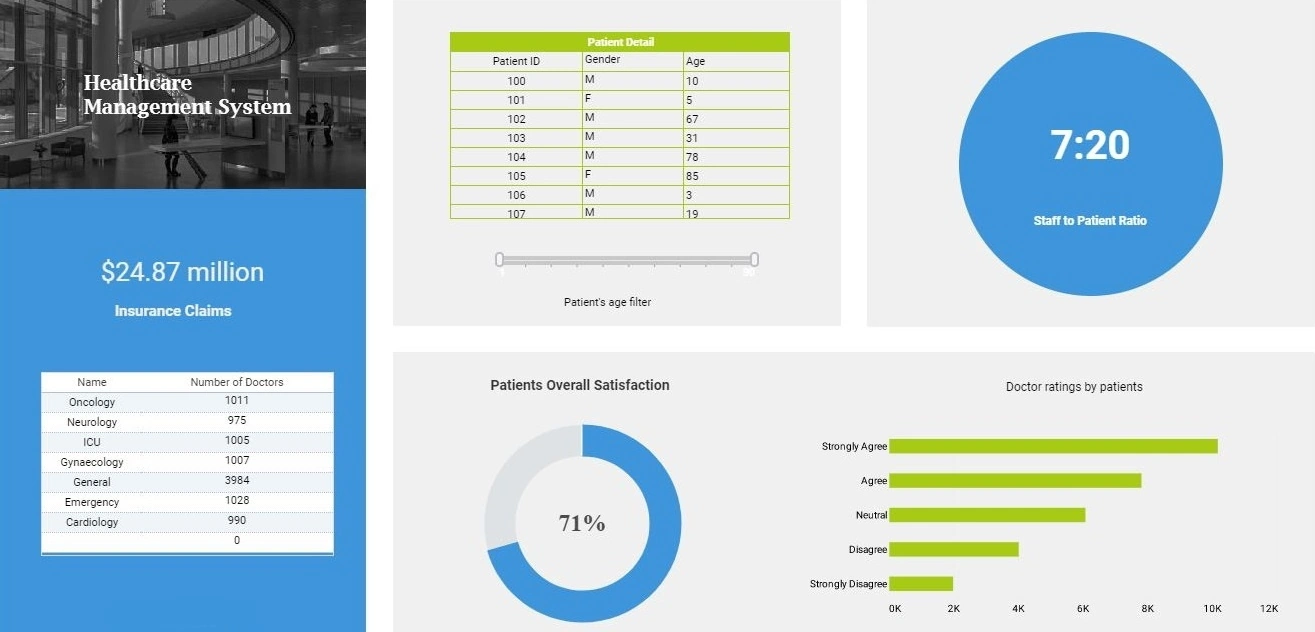
- Staff To Patient Ratios — Presents a health information dashboard that tracks staffing levels, department names, and physician counts alongside outcomes. The narrative explains how geographic and population filters let providers compare facilities fairly. It underscores why cross-cutting operational and clinical indicators belong in one informatics view.
- Critical Need For Dashboards — Outlines the core scenarios where dashboards improve clinical, operational, and financial decision-making. Describes four types of healthcare dashboards and when to use each for situational awareness. Argues that timely, visual telemetry reduces delays between detection and intervention.
- Informatics Analytics Dashboard — Surveys department-oriented dashboards and includes an informatics example focused on health information exploration. Explains how point-and-click designers and a wide chart library (maps, heatmaps, scatter) support ad-hoc questions without SQL. Notes mobile access so clinicians and analysts can review insights at the point of care.
- Informatics Software Examples — Positions web-based KPI dashboards as a flexible delivery method for clinical and operational metrics. Points to informatics examples and broader resources that show composition of multi-source KPIs in a browser. Emphasizes self-service interactions and real-time updates that keep measures clinically relevant.
- Visual Report Example For Informatics — Explains MIS reporting concepts and ties them to healthcare use cases like electronic medical records. Breaks down system types (TPS, DSS, executive support) and how they feed analytic reporting. Uses an informatics visual report example to illustrate how narrative and metrics come together for decision support.
- Interactive Mortality Analysis Dashboard — Demonstrates a medical dashboard that analyzes mortality by age, race, gender, and cause using drilldowns and filters. Shows how clinicians can pivot from high-level patterns to specific community insights. Reinforces that interactivity accelerates discovery compared to static chart packs.
- Health Informatics Profession — Discusses why informatics roles are essential to manage EHR security, scheduling, and patient data at scale. Provides practical tips and techniques that improve department dashboards’ usability and trust. Connects design choices to measurable gains in safety, satisfaction, and throughput.