User-Friendly Interactive Reporting Tools
It's not uncommon for organizations to require several different BI tools: a tool for creating proper formatted paginated reports, a visual analysis tool, and tools for reformatting and massaging data to prepare the data for reports and dashboards.
But what if there were a single platform, available either for embedding or for use as a standalone solution, which provided interactive online reporting, paginated reporting for printing, and unlimited data mashup and reformatting?
InetSoft's StyleBI is that solution; an intuitive and robust business intelligence software that provides users a means to access to all their data in the form of high-quality and effective interactive reports, for any organizational needs.
StyleBI is guaranteed to be the only BI platform needed, as its embedded business intelligence functionality gives users a wide-range of interactive tools for building any reports and dashboards desired.


StyleBI’s Interactive Features
In StyleBI, interactive reports are created with a drag and drop function that lets users pull out various chart and graph options and data fields, placing them on a spreadsheet-like interface. This drag and drop interface is optimal for the fast and seamless development of any reports or visual analytics; no coding is necessary on the end-user's part.
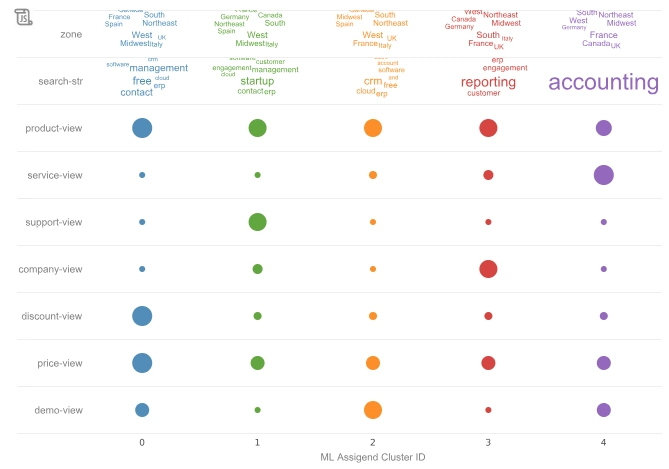
StyleBI contains a multitude of interactive options for exploring data in reports. Since dashboards and reports can contain a multitude of data or charts, InetSoft has created a brushing function in which users highlight specific portions of data from one chart and see that portion of data highlighted on all other charts, allowing them to better explore data relationships. Interactive features like this give businesses the opportunity for faster and more efficient observations in their analytics, for better decision-making.
InetSoft's solution also offers various tools for drilldown, such as range sliders, calendar displays, and selection lists allow viewers to control the range and category of information that is being displayed visually. The range slider and calendar options help users to specifically explore the data which falls within a given range, date, or quantity. All of these interactive functions are added quickly with InetSoft's drag and drop viewsheet technology. With InetSoft's StyleBI, businesses will be able to deploy professional, high-quality dashboards or reports within one single platform, for both optimal and efficient data analysis.

How Does a Transport Supervisor at a Beverage Manufacturing Company Use Interactive Reporting Tools?
A Transport Supervisor at a beverage manufacturing company plays a crucial role in ensuring the efficient movement of raw materials and finished products to and from the production facility. Interactive reporting tools can significantly enhance their ability to manage and optimize transportation operations. Here's how a Transport Supervisor can use these tools effectively:
-
Real-time Visibility: Interactive reporting tools provide real-time visibility into transportation activities. The supervisor can monitor the status of shipments, vehicles, and drivers, allowing them to make informed decisions on the fly. This enables them to respond quickly to unexpected delays or issues, minimizing disruptions in the supply chain.
-
Route Optimization: These tools can analyze historical data and current traffic conditions to recommend the most efficient routes for deliveries. This not only saves time but also reduces fuel consumption and transportation costs. The supervisor can adjust routes as needed based on the information provided by the tool.
-
Performance Tracking: Interactive reporting tools allow the supervisor to track the performance of the transportation team and individual drivers. Key performance indicators (KPIs) such as on-time deliveries, fuel efficiency, and maintenance records can be monitored. This data helps in identifying areas for improvement and recognizing top-performing team members.
-
Inventory Management: By integrating with inventory management systems, reporting tools can provide real-time updates on stock levels. This ensures that the right amount of raw materials is available for production and that finished products are delivered to customers on time. Any discrepancies or shortages can be quickly identified and addressed.
-
Cost Analysis: Transport supervisors can use these tools to analyze transportation costs comprehensively. They can track expenses related to fuel, maintenance, labor, and vehicle utilization. With this data, they can identify cost-saving opportunities, negotiate better contracts with carriers, and make informed decisions regarding fleet expansion or downsizing.
-
Customer Service: Interactive reporting tools can help transport supervisors provide better customer service. They can inform customers about estimated delivery times and proactively address any delays. This level of transparency enhances customer satisfaction and builds trust with clients.
-
Compliance and Safety: Ensuring that transportation operations comply with regulations and safety standards is paramount. Interactive reporting tools can provide insights into driver behavior, vehicle maintenance, and compliance with regulations such as hours of service (HOS). This information helps the supervisor take corrective actions when necessary to maintain safety and compliance.
-
Data-driven Decision Making: Transport supervisors can use historical data and trends to make strategic decisions. For example, they can analyze data to determine if additional delivery vehicles are needed during peak seasons or if certain routes consistently experience delays. These insights can inform long-term planning and resource allocation.

How Does a Quality Assurance Engineer at a Textile Mill Use Interactive Reporting Tools?
A Quality Assurance Engineer at a textile mill plays a critical role in ensuring the production of high-quality textile products. Interactive reporting tools can significantly enhance their ability to monitor, manage, and improve quality control processes. Here's how a Quality Assurance Engineer can effectively use these tools:
-
Real-time Monitoring: Interactive reporting tools provide real-time data on various quality metrics during the manufacturing process. Engineers can monitor parameters such as thread tension, fabric thickness, color consistency, and defect rates as they change in real-time. This allows for immediate intervention if deviations or defects are detected, minimizing waste and ensuring product quality.
-
Defect Tracking: These tools enable engineers to log and track defects systematically. They can categorize defects by type, severity, and location on the textile product. Over time, this data helps identify recurring issues and their root causes, leading to targeted process improvements.
-
Process Optimization: Quality Assurance Engineers can use interactive reports to analyze historical data and identify trends or patterns in quality issues. For example, if certain defects are consistently associated with a specific machine or operator, the engineer can take corrective actions such as retraining operators or conducting maintenance on the machine.
-
Supplier Evaluation: Textile mills often source raw materials from various suppliers. Interactive reporting tools can be used to assess and compare the quality of materials from different suppliers. Engineers can track the performance of suppliers by analyzing data on material defects, delivery times, and adherence to quality standards.
-
Quality Audits: Conducting regular quality audits is crucial for maintaining product consistency. Reporting tools can help plan and document audit results efficiently. Engineers can generate audit checklists, record findings, and track compliance with quality standards over time.
-
Cost Analysis: Quality issues can lead to increased production costs due to rework, scrap, and customer returns. Reporting tools can help engineers calculate the cost of poor quality and evaluate the ROI of quality improvement initiatives. This data can be used to justify investments in process enhancements or training programs.
-
Customer Feedback Analysis: Customer feedback is a valuable source of information for quality improvement. Engineers can use reporting tools to analyze customer complaints and returns, identifying recurring issues and their impact on customer satisfaction. This data can guide efforts to address specific customer concerns.
-
Regulatory Compliance: Textile mills must adhere to various quality and safety regulations. Reporting tools can assist engineers in tracking compliance with regulatory requirements and generating compliance reports for audits and inspections.
-
Continuous Improvement: Interactive reporting tools facilitate a culture of continuous improvement. Engineers can use the data generated to propose and prioritize quality improvement projects. These projects can range from process modifications to employee training initiatives aimed at enhancing overall product quality.
-
Communication: Reporting tools allow Quality Assurance Engineers to share quality data and reports with other departments, including production, maintenance, and management. Effective communication of quality issues and trends helps in collaborative problem-solving and decision-making.

More Resources for Learning About Interactive Reporting
Accessible Weekly Dashboards - Our solution is easy to learn; only basic Excel skills are needed. Companies who use our software see the value of this when managers start creating their own ad hoc reports, without support from IT. And with our mobile capabilities, report access is no longer an issue. StyleBI is a web-based solution, which can be accessed on Ipads, Iphones, laptops, and other mobile devices...
Better Than Insight Reporting Software - Looking for insight reporting software? InetSoft, a pioneer in self-service oriented reporting software, can manage your reports. Highly rated customer service holds your hand during the entire process. View a demo and try interactive examples. By observing and analyzing these processes, companies can gain significant insight on different shifts and trends which progress and hinder their business...
Consider InetSoft's ITSM Dashboard Application - Are you looking for a good ITSM dashboard application? InetSoft's pioneering dashboard reporting application produces great-looking web-based dashboards with an easy-to-use drag-and-drop designer. Get cloud-flexibility for your deployment. Minimize costs with a small-footprint solution. Maximize self-service for all types of users. No dedicated BI developer required. View a demo and try interactive examples...

Dashboarding Platform Connects to REST API - Looking for a dashboarding platform that connects to a REST API? InetSoft's pioneering dashboard reporting application does and enables secure interactive dashboards and analytics. View a demo and try interactive examples. If you also want interactive dashboarding and data mashup then look at InetSoft's flagship business intelligence software - StyleBI...
Evaluate InetSoft's Solution for Creating Online Visual Reports - Looking for software to create nice online visual reports? InetSoft's pioneering dashboard reporting application produces great-looking web-based dashboards with an easy-to-use drag-and-drop designer. View a demo and try interactive examples. The 'Annotation' toolbar button allows a user to control whether annotations are displayed on the dashboard or hidden...
Good DevOps Dashboard Tool - Are you looking for a good DevOps dashboard tool? InetSoft's pioneering dashboard reporting application produces great-looking web-based dashboards with an easy-to-use drag-and-drop designer. Get cloud-flexibility for your deployment. Minimize costs with a small-footprint solution. Maximize self-service for all types of users. No dedicated BI developer required. View a demo and try interactive examples. StyleBI is a zero-client, Web-based BI tool that offers greater flexibility than that of its desktop-bound competition...
Interested in Weekly Reporting Tools - Weekly reports are vital for the regular monitoring and control of business conditions. But in many cases, the production of weekly reports puts additional demands on administrators and employees. And with so much business travel and work done out in the field, report accessibly and deliverability can also be an issue. Our solution, StyleBI, makes the setting up and delivery of weekly reports easy and efficient...

Key Benefits for Report Developers - Deliver professional, high fidelity presentation Transform and manipulate raw data Embed business logic with scripting Gather up-to-the-minute information Reshape reports in real time Minimize performance bottlenecks Enhance manageability and agility Extend professionally designed reports Gather information by self service queries Produce presentation quality reports on the web...
Many Different Types of Reporting Software - Interested in finding different types of reporting software? Since 1996, InetSoft has been an innovator in offering easy to use, but powerful interactive, Web-based reporting software. Articles below provide more related information to help you. Also, look at the nav menu above to see examples and read reviews. A free evaluation is available...
On-Demand Interactive Reporting - Your organization needs its data to be presented in a format that not only communicates clearly, but updates as changes happen. With on-demand interactive reporting, you can reshape reports in real time, and share via web-based platform. Proprietary viewsheet technology allows you to create and modify dashboards and reports whether you're in the office or not...
Pioneering REST API Reporting - Looking for a reporting platform that connects to a REST API? InetSoft's pioneering dashboard reporting application does and enables secure interactive reports and analytics. View a demo and try interactive examples. InetSoft makes a Java reporting application for creating ad hoc and production reports to be printed, distributed by email, or posted to a Web portal for interactive viewing...

Platform for IoT Dashboards - Are you looking for a good IoT dashboard platform? InetSoft's pioneering dashboard reporting application produces great-looking web-based dashboards with an easy-to-use drag-and-drop designer. Analyze sensor data, run ML models, and visualize results. This also decreases the burden on report developers - even less work is required to present users with a 100% interactive reporting solution...
Prometheus EAM Reporting App - Looking for a good solution for Prometheus dashboard reporting? Mashup your EAM and operations data with other enterprise data for a wider view of company performance. InetSoft's pioneering BI application produces great-looking cloud-based dashboards with an easy-to-use drag-and-drop designer. View a demo and try interactive examples...
Replace Interactive SharePoint Dashboards - Are you looking for a good solution for interactive SharePoint dashboards? InetSoft's pioneering dashboard reporting application produces great-looking web-based dashboards with an easy-to-use drag-and-drop designer. This Java reporting application integrates seamlessly with other business applications to create a powerful reporting solution...
Report Delivery Options Using InetSoft - The last, and arguably most important, step in the report process is the delivery. If a user does not receive the report when they need it, in a viewable format, the entire development process was for nothing. InetSoft's StyleBI provides integrated archive, time-based scheduling, data-based alert notification, dashboards, various export formats, and report bursting. Each of these features increases efficiency by taking the burden off the administrative staff...

Researching Reporting Software Vendors - Researching reporting software vendors? Since 1996, InetSoft has been offering flexible, powerful and easy to use reporting software for enterprises and OEMs. Now its award winning reporting tools include pricing options comparable to open source vendors. InetSoft's reporting-only product is Style Report Enterprise. If you also want interactive dashboarding and data mashup then look at InetSoft's flagship business intelligence software - StyleBI...
Scheduling, Bursting, and Archiving - InetSoft's report scheduling, bursting, and archiving capabilities allow for flexible batch report generation. Report bursting separates report pages into security controlled sections. Business users' viewing is limited to permission granted sections...