Evaluate InetSoft's Prometheus Reporting Tool
Are you ooking for a good solution for Prometheus dashboard reporting? Mashup your EAM and operations data with other enterprise data for a wider view of company performance. InetSoft's pioneering BI application produces great-looking cloud-based dashboards with an easy-to-use drag-and-drop designer. View a demo and try interactive examples.
Prometheus Dashboard Example
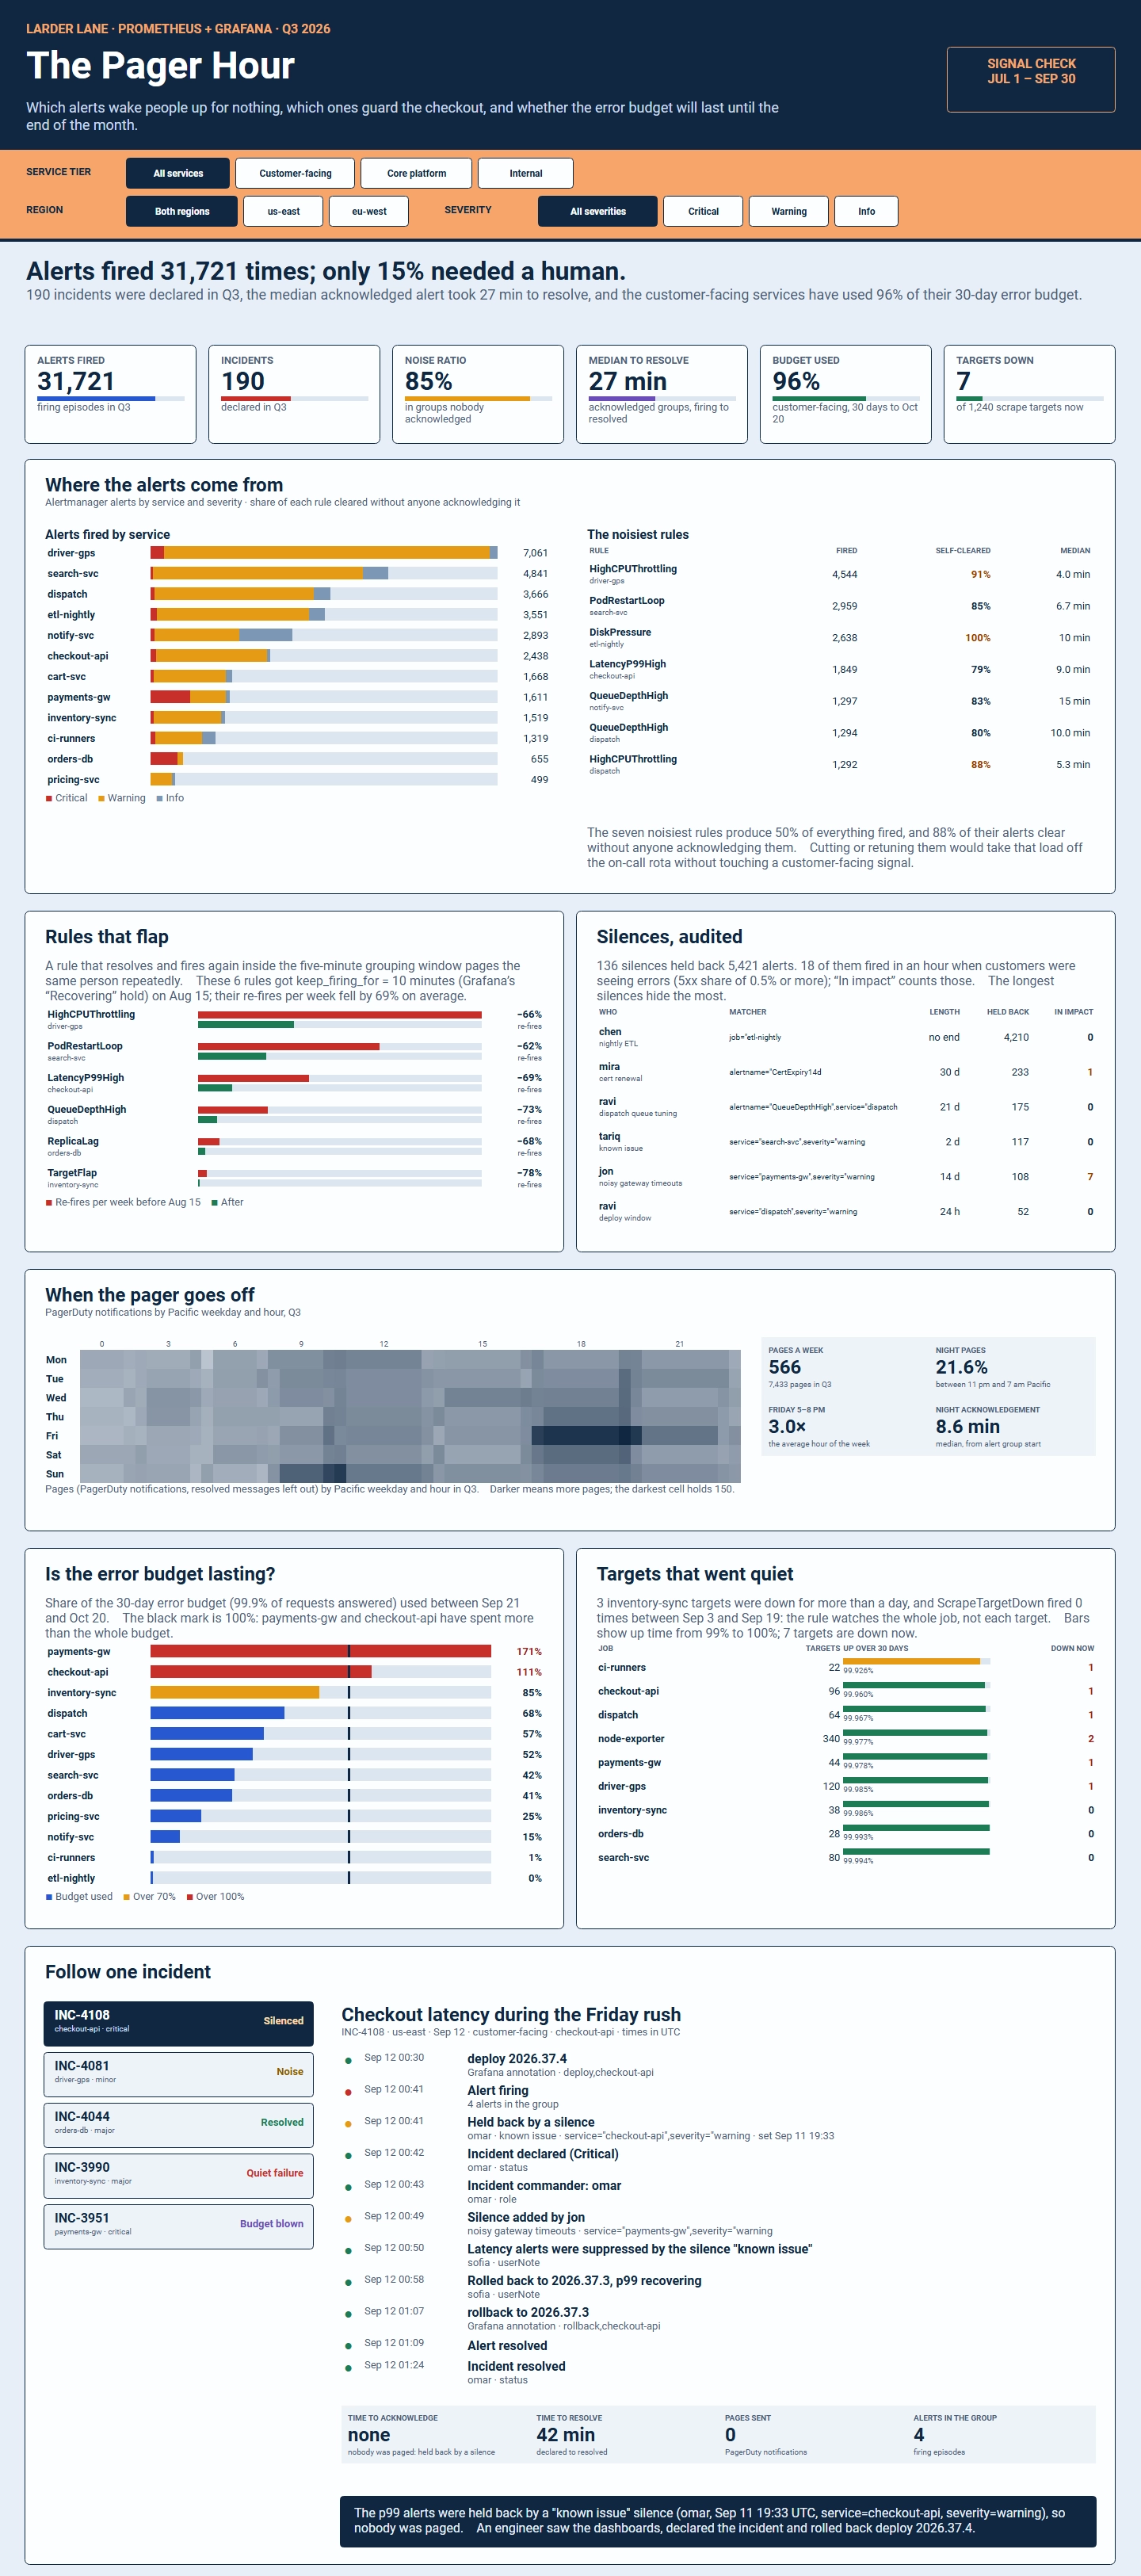
This dashboard is an example of how organizations use Prometheus to monitor application health, infrastructure reliability, service-level objectives (SLOs), and incident response performance. Combined with Grafana and Alertmanager, Prometheus metrics provide real-time operational visibility across distributed systems and cloud-native environments.
The dashboard shown above focuses on alert effectiveness, incident management, error budget consumption, and service reliability. Rather than measuring only technical metrics, it helps engineering teams understand which alerts create meaningful action and which alerts generate unnecessary operational noise.
What Is a Prometheus Dashboard?
A Prometheus dashboard visualizes metrics collected from applications, containers, servers, microservices, databases, and cloud infrastructure. Teams use these dashboards to monitor system health, identify anomalies, investigate incidents, and measure service performance against reliability objectives.
Prometheus dashboards are commonly displayed in Grafana, where data can be organized into executive KPIs, operational views, troubleshooting panels, and service-level reporting.
Executive Reliability KPIs
The top section of this Prometheus dashboard summarizes overall operational reliability for the reporting period. These high-level metrics allow engineering leaders to quickly understand system stability and incident response effectiveness.
- Total alerts fired
- Number of incidents declared
- Alert noise ratio
- Median time to resolve incidents
- Error budget consumption
- Number of unavailable targets
Together, these metrics help identify whether monitoring systems are producing actionable information or overwhelming responders with excessive notifications.
Alert Management Analytics
One of Prometheus's greatest strengths is its ability to generate alerts when predefined conditions are met. This dashboard analyzes alert volumes across services and severity levels, helping organizations understand where operational attention is being consumed.
Engineering teams can identify:
- Services generating the most alerts
- Alert severity distribution
- Noisy alert rules
- Self-resolving alerts
- Alert acknowledgement rates
- Monitoring gaps and blind spots
Reducing Alert Fatigue
Excessive alerting can reduce team effectiveness and contribute to on-call burnout. The dashboard highlights noisy rules, frequently repeated alerts, and alerts that resolve without manual intervention.
These insights help monitoring teams tune alert thresholds, consolidate duplicative notifications, and eliminate low-value alerts that do not require human action.
Incident Response Monitoring
Incident response metrics measure how quickly teams identify, acknowledge, investigate, and resolve production issues.
- Time to acknowledge alerts
- Time to resolve incidents
- Incident volume trends
- Escalation effectiveness
- Service impact frequency
- On-call response performance
By tracking these operational metrics, organizations can improve their incident management processes and reduce service disruptions.
Alertmanager Silence Auditing
Alertmanager allows engineers to silence specific alerts during maintenance windows, deployments, or known issues. This dashboard tracks active silences to ensure important alerts are not accidentally suppressed.
Auditing silences provides accountability and helps teams understand whether muted alerts are reducing noise or hiding legitimate problems.
On-Call and Pager Analytics
The dashboard includes an analysis of pages generated throughout the week and across different times of day. Heatmaps reveal patterns in operational load and identify periods when services are most likely to generate incidents.
Common metrics include:
- Pages by hour
- Pages by weekday
- After-hours pages
- Weekend alert volume
- Incident frequency trends
- Engineer notification volume

Error Budget Monitoring
Reliability-focused organizations often track service-level objectives using error budgets. An error budget represents the acceptable level of failure a service may experience within a defined period.
This dashboard shows how much of the available error budget has been consumed by each service, helping engineering teams balance innovation, deployments, and operational stability.
- Error budget remaining
- Error budget burn rate
- SLO compliance
- Service reliability rankings
- Risk indicators
Prometheus Target Monitoring
Prometheus continuously scrapes metrics from monitored endpoints known as targets. This dashboard tracks target availability to verify monitoring coverage remains active.
Administrators can quickly identify systems that have stopped exporting metrics, allowing corrective action before observability gaps impact troubleshooting efforts.
Incident Investigation and Root Cause Analysis
Detailed incident timelines provide visibility into how production events unfold. Teams can review deployments, alert activity, acknowledgements, escalations, mitigation efforts, and resolutions from a single screen.
This historical context speeds root cause analysis and supports continuous improvement initiatives following major incidents.

Common Data Sources for Prometheus Dashboards
- Kubernetes clusters
- Docker containers
- Linux and Windows servers
- Cloud infrastructure platforms
- Application performance metrics
- Databases and message queues
- Network devices
- Custom business services
Benefits of a Prometheus Dashboard
- Improve observability across systems and applications.
- Reduce incident response times.
- Identify noisy alerts and alert fatigue.
- Monitor service-level objectives.
- Track error budget consumption.
- Increase operational reliability.
- Strengthen on-call effectiveness.
- Support proactive performance monitoring.
- Improve root cause investigation.
Who Uses Prometheus Dashboards?
- Site Reliability Engineers (SREs)
- DevOps Teams
- Platform Engineers
- Cloud Operations Teams
- Application Support Teams
- Infrastructure Administrators
- Engineering Managers
- Technology Executives
Actionable Operational Intelligence
This Prometheus dashboard example demonstrates how organizations can transform monitoring data into actionable operational intelligence. By combining alert analytics, incident management metrics, error budget reporting, service availability monitoring, and on-call performance tracking, teams gain the visibility needed to improve reliability and maintain high-performing systems. Prometheus dashboards serve as a critical component of modern observability and reliability engineering programs.

More Resources and Articles about InetSoft's Prometheus Reporting Tool
Ad Hoc Query Tool - Looking for an ad hoc query tool? InetSoft offers ad hoc query and reporting software to build ad hoc queries with a drag and drop designer. The query application includes powerful database access capabilities connecting to disparate data sources and permitting ad hoc query analysis for business users and database analysts alike. Based on a product that has won 8 JDJ Readers Choice Awards in a row, you have a great option to evaluate...
Benefits of Visual Analysis Software for Business - Traditional information access methods are frustratingly human resource intensive. A business person might have a question in mind, but previously he or she needed to make a data or report request to a database analyst to get an answer. If the request was misunderstood or, after seeing the result, the asker realized a mistake in the question, the process had to be repeated.This cycle is costly in time and human resources. In contrast, visual data analysis puts tools in the hands of the non-technical business user to explore large amounts of data with no other assistance...
BI Reporting Application Trial - Looking for a BI reporting application? Since 1996 InetSoft has been making BI software that is easy to deploy and easy to use. Build self-service oriented interactive visual reports quickly . View a demo and read customer reviews...
Change the Report Web Properties - InetSoft's reporting software allows users to change the report web properties allowing for a high level of user interaction between static and web sources. View the information below to learn more about the StyleBI solution...
Company Report Writing Software - Reporting has always been tightly coupled to everyday business activities. As a result, reporting requirements tend to change very often. Traditionally, when such changes occurred, you were forced to rely on developers or IT staff to revise your reports to meet the new requirements...

Evaluate InetSoft's Business Analyst Reporting Software - Looking for good business analyst reporting software? InetSoft is a pioneer in self-service reporting and makes it easy to create analytical dashboards with a drag and drop designer. View a demo and try interactive examples...
Good Dashboard Company to Evaluate - Today, data is overflowing and simple reporting structures can't keep up with demands. A dynamic dashboard from the top dashboard software company can push you ahead of the curve. InetSoft's Style Intelligence™ integrates sophisticated data analysis to reveal real time trends...
Implanting Business Logic into Reports - JavaScript is used for report, page, and element level scripting. There's limited control over element visibility and page break. Exceptions or business-rule triggers are handled timely with warnings. Details in the background and foreground are aptly highlighted...
Easy to Deploy KPI Dashboard Software - Are you looking for KPI reporting software that is robust enough to grab the attention of executives...

How Easy is InetSoft's Reporting Software? InetSoft offers easy reporting software without sacrificing functionality. With InetSoft's Style Report, reports can be created easily using a simple drag and drop interface. Users with excel-level skills can build and customize their own reports, without help from IT...
InetSoft's Business Reporting Software - InetSoft's reporting software offers rapid drag and drop development of sophisticated production reports and web-based interactive ad hoc reporting. InetSoft is top-rated by users on G2 Crowd. Interact with examples and register for a personalized demo...
InetSoft's Reporting and Inquiry Tools - Looking for good reporting and inquiry tools? InetSoft's pioneering dashboard reporting application enables self-service for data exploration. Users need not rely on database experts to create new reports for them. View a demo and try interactive examples...
Portal Dashboard Resources - These pages are useful resources about InetSoft's dashboard software, which has been optimized for embedding into enterprise portals or any ISV's Web-based application...
Powerful Tools for BI Reporting - Searching for better tools for reporting? Do you want to move past static paginated reports...
Product with Reporting Interactivity - This is a table of contents of useful product information about InetSoft's reporting interactivity features within Style Report Enterprise and Style Report Professional. Features from both are included in InetSoft's flagship business intelligence software for dashboards, reporting, and analytics - StyleBI...
Report Table Transformer Feature - Table transformer classes are table lens classes that project a different view into other table lenses. StyleBI provides two built-in table transformers, RotatedTableLens and SubTableLens...
Reporting Software Permits ANT Tasks - InetSoft's reporting software permits users to run ANT task parameters that facilitate the completion of predefined tasks. View the information below to learn more about the Style Intelligence solution...

Risk Free Dashboard Offer - Built-in, in-depth interactivity and customization allows business users to dynamically reshape pre-designed dashboards for changing business needs with zero training. Self-service dashboarding further empowers business users with direct access to underlying data assets in a governed and secure environment...
Try InetSoft's Business Dashboard Reporting Software - Are you looking to download dashboard reporting software? Since 1996 InetSoft has been making dashboard software that is easy to deploy and easy to use. Build self-service oriented dashboards quickly. View a demo, try it online for free, and request a free download...
User-Friendly Interactive Reporting Tools - InetSoft's StyleBI is that solution; an intuitive and robust business intelligence software that provides users a means to access to all their data in the form of high-quality and effective interactive reports, for any organizational needs. StyleBI is guaranteed to be the only BI platform needed, as its embedded business intelligence functionality gives users a wide-range of interactive tools for building any reports and dashboards desired...
Using a Virtual Data Warehouse - Let's talk about data virtualization. That's certainly a way to avoid some bottlenecks is to identify certain data sets or data feeds where either they are not that critical or they don't have to go through the traditional process, the batch ETL process, in order to get where they need to go...

Very Customizable Reporting Software - Are you looking for customizable reporting software? Since 1996 InetSoft has been making reporting software that is easy to deploy and easy to use. Build self-service oriented interactive dashboards quickly. View a demo and read reviews...
Weekly Status Reports Need To Be Saved - Weekly status reports need to be saved for future access. Furthermore, both live reports, and saved reports need to be readily accessible to users...
Which is the Best Cloud Reporting Tool? - Looking for the best cloud reporting tool? InetSoft's pioneering dashboard reporting application produces great-looking web-based reports with an easy-to-use drag-and-drop designer. View a demo and try interactive examples...
Winning Information Reporting System - Searching for an information reporting system? Do you want to move past static paginated reports? Deliver highly graphical, visually appealing, and interactive views into your data with InetSoft's Web-based visualization-driven reporting software...