Smart Data Analysis
To cut through information overload of running a business, part of your BI strategy must be smart data analysis. Smart data is often described as data with hidden qualities, such as veracity and value. Finding data with these qualities will help a decision maker hone in on and exploit metrics to their fullest potential. The main difference between smart data and normal boring data is that smart data is the best path toward action.
KPI's, scorecards, thresholds can all be considered smart data. But smart data is also cause driven. Smart data often attempts to answer the question "What condition lead to this result?"
With that dimension of value it is easy to see why industries are starting to become smart data obsessed. Smart data is data that has been contextualized, and tells a business something without meandering or time wasted on testing that doesn't yield great new information. Smart data often looks like patterns or it can also manifest as high performance anomalies.
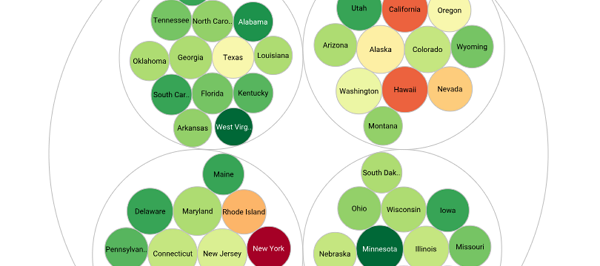
When a business encounters big data, it is dealing with hundreds of thousands of columns, large stores of customer information, disconnected sources, each filled with sales or shipping or product details. Figuring out where smart data is residing in a these giant sets of data requires algorithms, or even better visualization.
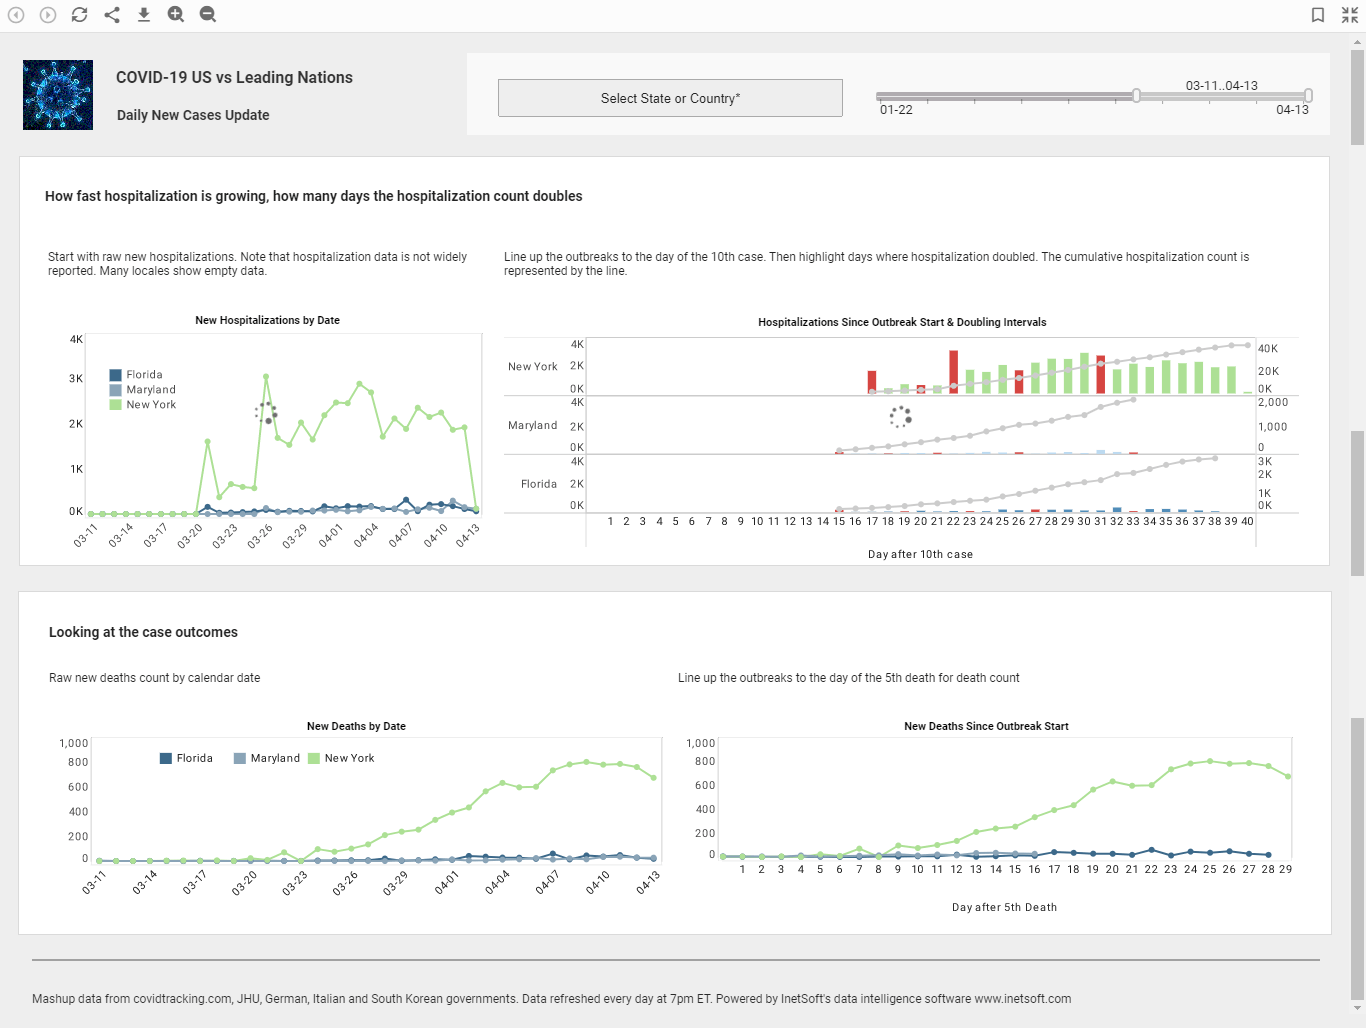
InetSoft is all about siphoning out smart data and gaining access to actionable insights. Any method that shortens the path from raw number to managing decision, streamlining analysis, is a method worth exploring. And since 1996 InetSoft has been honing their ability to find smart data as quickly as possible and create the environment necessary for accurate, reproducible results and resolute decision making.
With a bit of Style and a whole lot of Intelligence InetSoft designed their flagship product Style Intelligence. This software is an extremely easy to use, highly compatible, and visually stunning dashboard engine that allows users to design web hosted beautiful dashboards and professional paginated reports.
StyleBI
Getting Data Right Makes Intelligence Easy
The math and algorithms is programmed once into the interface and it always returns the valuable smart data like KPIs that are hidden within a data set. Once the algorithm or equation has been plugged in, the math is performed in the StyleBI background consistently, and is interactive, responding in kind to the way a user experiments with the interface.
While available for power users, SQL language has been deemphasized, replacing it with simple formulas and the ease of data simply being plugged in and out with drag and drop techniques.
Utilizing a powerful query system that only requires a user drag and drop columns into a dynamic environment, and then interacting with the complex charts that render themselves from the data, the path toward accessing smart data and transforming charts into actions and decisions has been streamlined. When it comes to organizing, processing, modifying and finally visualizing data-- without ever changing data at the source-- StyleBI represents the bleeding edge of data reclamation technology.
Executives Want the Smartest Data
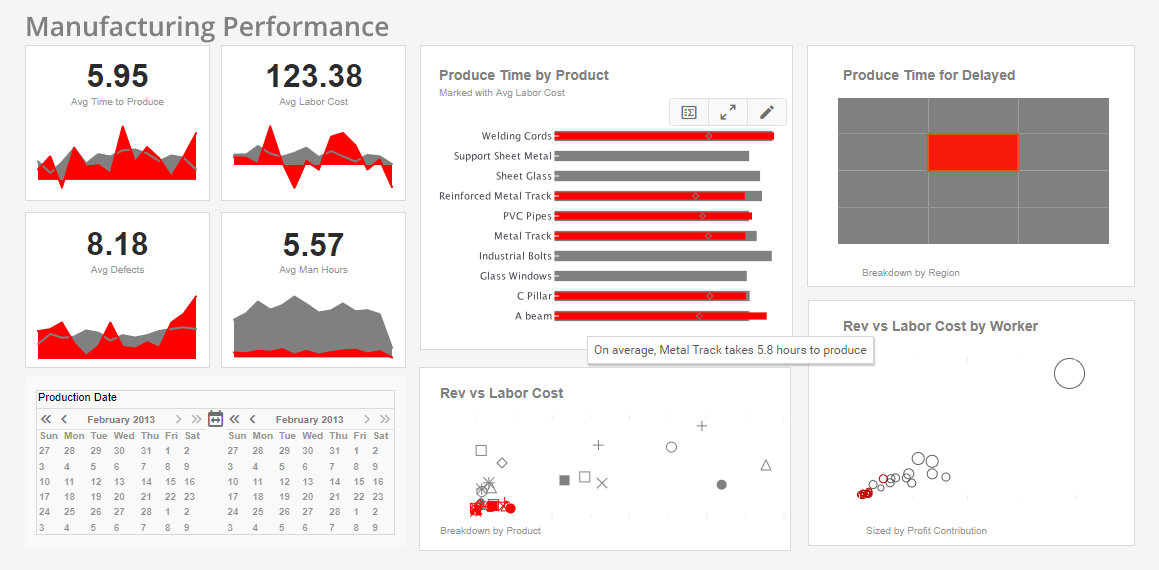
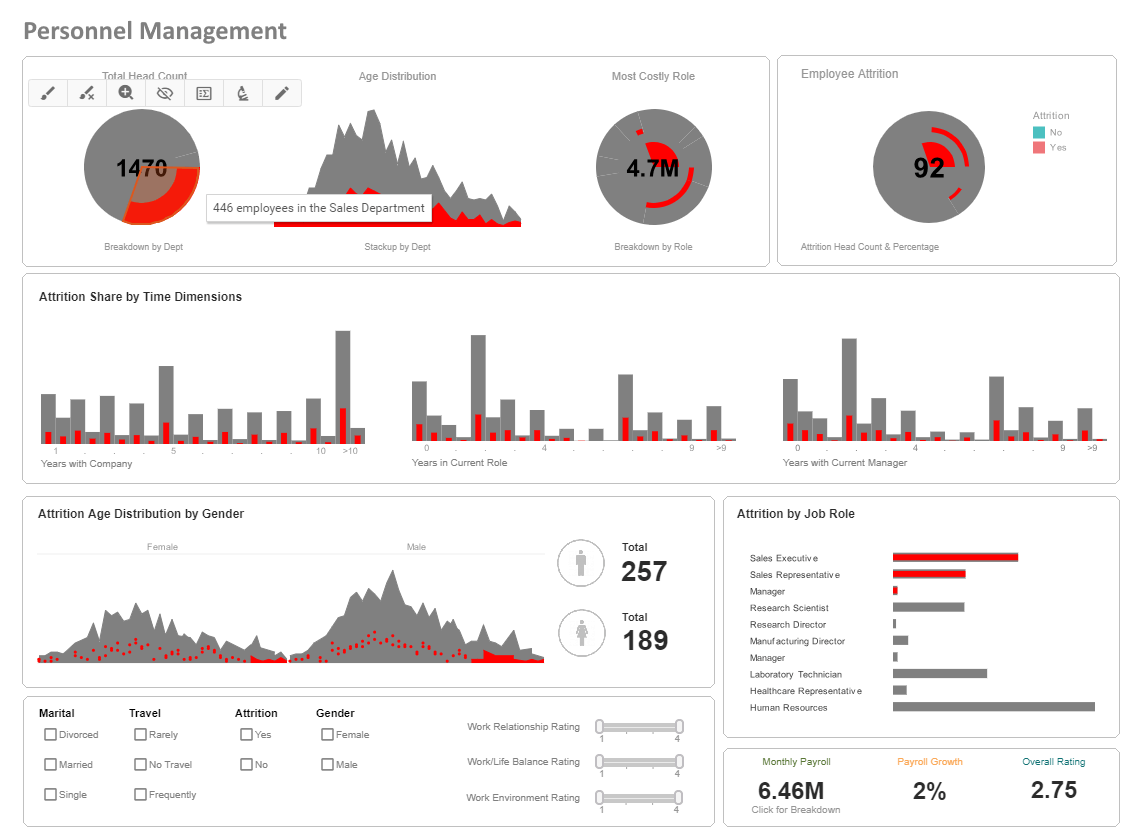
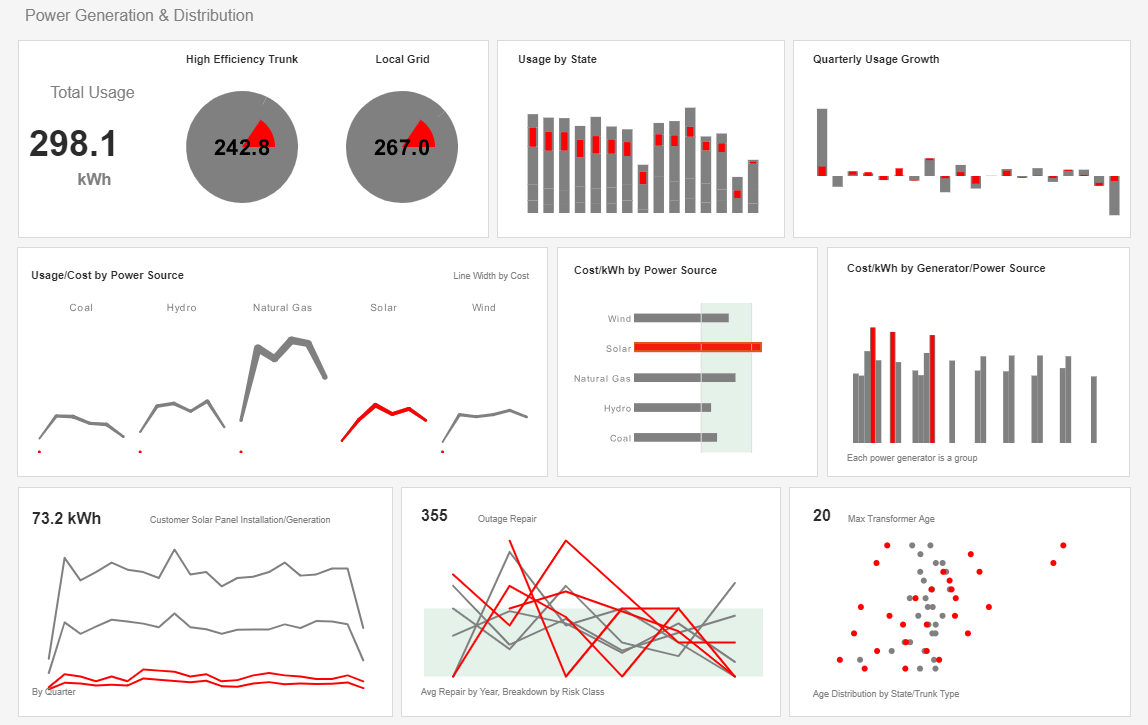
A big part of getting data right and having access to smart data is being able to see performance objectives and thresholds. Usually scorecards and key performance indicators are displayable from a dashboard interface, but they remain static, almost as if they are a simple reporting method that has been tacked on to a report, of built in a post-design phase. This leaves little room for interpretation, experimentation, or granular specificity.
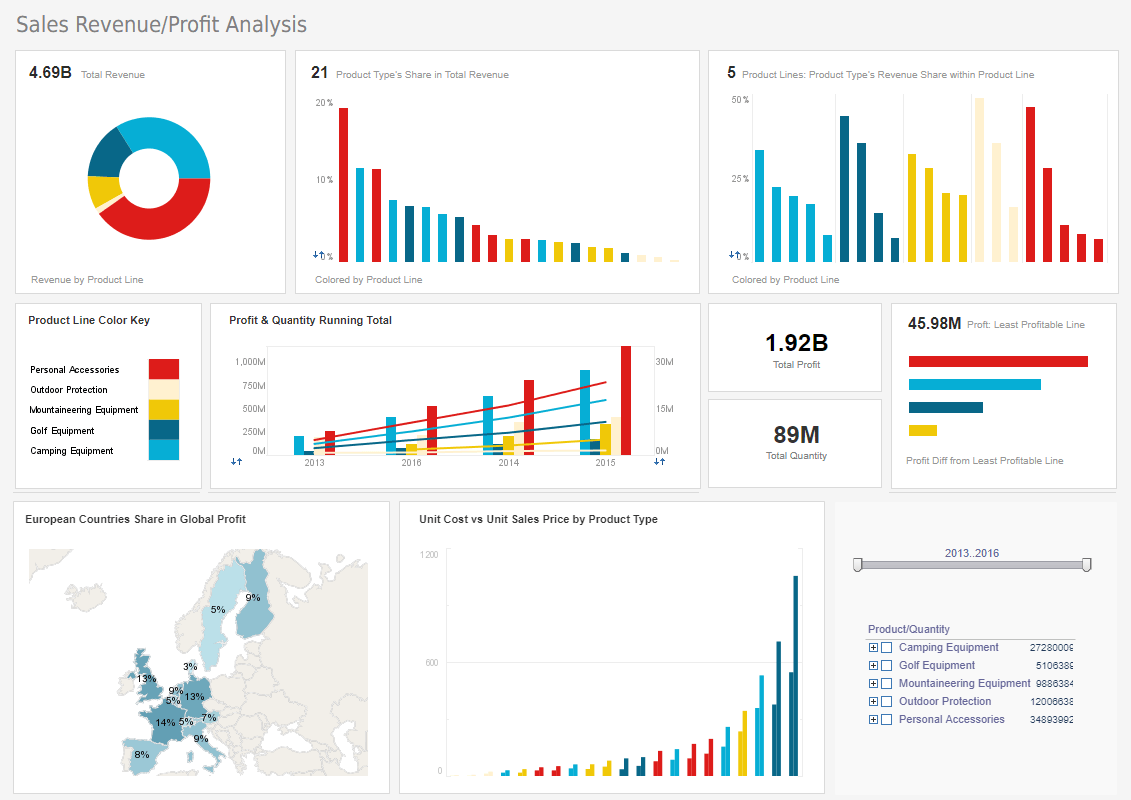
With StyleBI scorecards and KPI's are interactive. Drilling down into data in interactive charts and tables will also necessarily modify the displayed KPIs. In the interactive dashboard at the top of this page you can experiment with brushing and other tools and the KPI's in the display will respond accordingly.
That is because they are attached to the master data set of the dashboard with a simple equation. The Average City, Highway and Combined (or overall) miles per gallon KPIs are the result of data that has been wrung out of the set and quantified. Each vehicle's fuel efficiency is something that is not immediately comparable from looking at raw numbers. But when these totals have been formulated and visualized, the best choice becomes extremely easy to distinguish. The dashboard is automatically doing the math-work for the user, leaving them with only the smartest data to sort through.
Interviews with OEMs CFOs and CEOs suggest that some of the key advantages of investing in the Style Intelligence BI solution are the application's ability to solve data management challenges, as well as its IT-friendliness. To learn more about how to get smart data into your BI strategy, you can register for a live demo with our product representatives this week.

