Why InetSoft is a Good Analytics Solution
InetSoft has established itself as a leading analytics solution provider by combining ease of use with powerful functionality.
The platform's 100% HTML5 interface and homegrown charting engine make it accessible to non-technical users while providing the advanced capabilities that data analysts require.
Organizations benefit from rapid deployment—applications can be up and running in weeks rather than months—allowing businesses to quickly gain insights from their data without lengthy implementation cycles or extensive IT involvement.

A key strength of InetSoft's approach is its drag-and-drop interface and point-and-click controls, which democratize data analysis across organizations. Business users from marketing, operations, and line-of-business departments can build interactive dashboards and reports without requiring support from IT teams. This self-service capability reduces bottlenecks and empowers employees to explore data independently, leading to faster decision-making and improved business agility.
Beyond usability, InetSoft's multidimensional charting and visual analysis capabilities excel at uncovering patterns and identifying outliers in complex datasets. The platform's flexible architecture supports integration across various data sources and cloud platforms, making it suitable for organizations of any size. Combined with strong governance features and responsive support, InetSoft delivers a comprehensive BI solution that balances accessibility with analytical power.
User Comments
Sarah M., Marketing Director: "InetSoft transformed how our team analyzes campaign performance. Within two weeks of deployment, we were creating interactive dashboards without touching a line of code. The drag-and-drop interface is intuitive, and the visual insights have helped us optimize our marketing spend significantly."
James T., Operations Manager: "What impressed us most was the speed of implementation and the minimal training required. Our staff picked up the platform immediately, and we've already identified operational inefficiencies that would have taken months to discover with our previous solution."
Apache Iceberg and Why Is InetSoft's Analytic Application a Good Fit for It? - Businesses in the data management and analytics space are always looking for creative ways to improve efficiency and extract useful information. The integration of Apache Iceberg with InetSoft's Analytic Application is one such combination that has garnered popularity. A sophisticated data intelligence software with a cutting-edge table structure improves corporate intelligence and analytics. We will examine the features and benefits of Apache Iceberg and its ideal fit for InetSoft's Analytic Application in this article. Conventional table formats for structured data management, such Apache Hive and Apache HBase, have shown to be effective. However, these formats are beginning to show their limits as data volume and complexity have increased. The requirement for a new table structure that could solve these issues and provide more flexibility and efficiency gave rise to Apache Iceberg...
Application Usage Funnel Analysis Dashboard - An application usage funnel analysis dashboard is designed to explain how users move through an application, where momentum builds, and where friction causes drop off. Unlike generic usage dashboards that focus on isolated metrics, a funnel dashboard provides a structured narrative of user behavior from entry to meaningful retention. When implemented correctly, it becomes a shared reference point for product, engineering, and operations teams. The primary purpose of this dashboard is to make user progression visible and measurable. It answers questions such as how many users begin using the application, how many complete critical actions, and how many return after initial exposure. The dashboard is not meant to catalog every event but to highlight the stages that matter most to application success...
Applying Predictive Analytics to IT Performance - When we say business drives technology, what do we mean by that, and how do you apply that to your business world? Well, if you look at the advances of technology, over time in the long history of technology advances, sometimes we get a little bit ahead of the business world. Now in the last few years, a big emphasis has been placed on the value that technology can bring to the business. And I really see a maturing in terms of the need for data warehousing. In a long spectrum form, it used to be, at a point in time, a nice to have thing. While we are not at that point now, for the most part, we’re moving towards this kind of business intelligence resource as a have-to-have type of thing. Business intelligence has really moved into a strategic place. Companies use data essentially to help drive their business, to make better decisions. At the same time, the business itself is changing. For any business, if you read the papers, or take a look at what’s going on, there is always change in business, but now, the change is really accelerating in many ways...
Are OLAP Tools Still Used? - Yes, OLAP (Online Analytical Processing) tools are still widely used in the business intelligence and analytics space. OLAP provides a multidimensional view of data, allowing users to interactively analyze and explore complex datasets. OLAP tools are particularly valuable for decision-makers and analysts who need to perform in-depth analysis, trend identification, and "slice and dice" operations on large datasets. OLAP tools support various types, including Multidimensional OLAP (MOLAP), Relational OLAP (ROLAP), and Hybrid OLAP (HOLAP), each with its own strengths and use cases. While newer technologies like in-memory analytics and cloud-based solutions have gained popularity, OLAP tools continue to be relevant, especially in scenarios where the ability to analyze data from multiple dimensions is crucial for business insights...
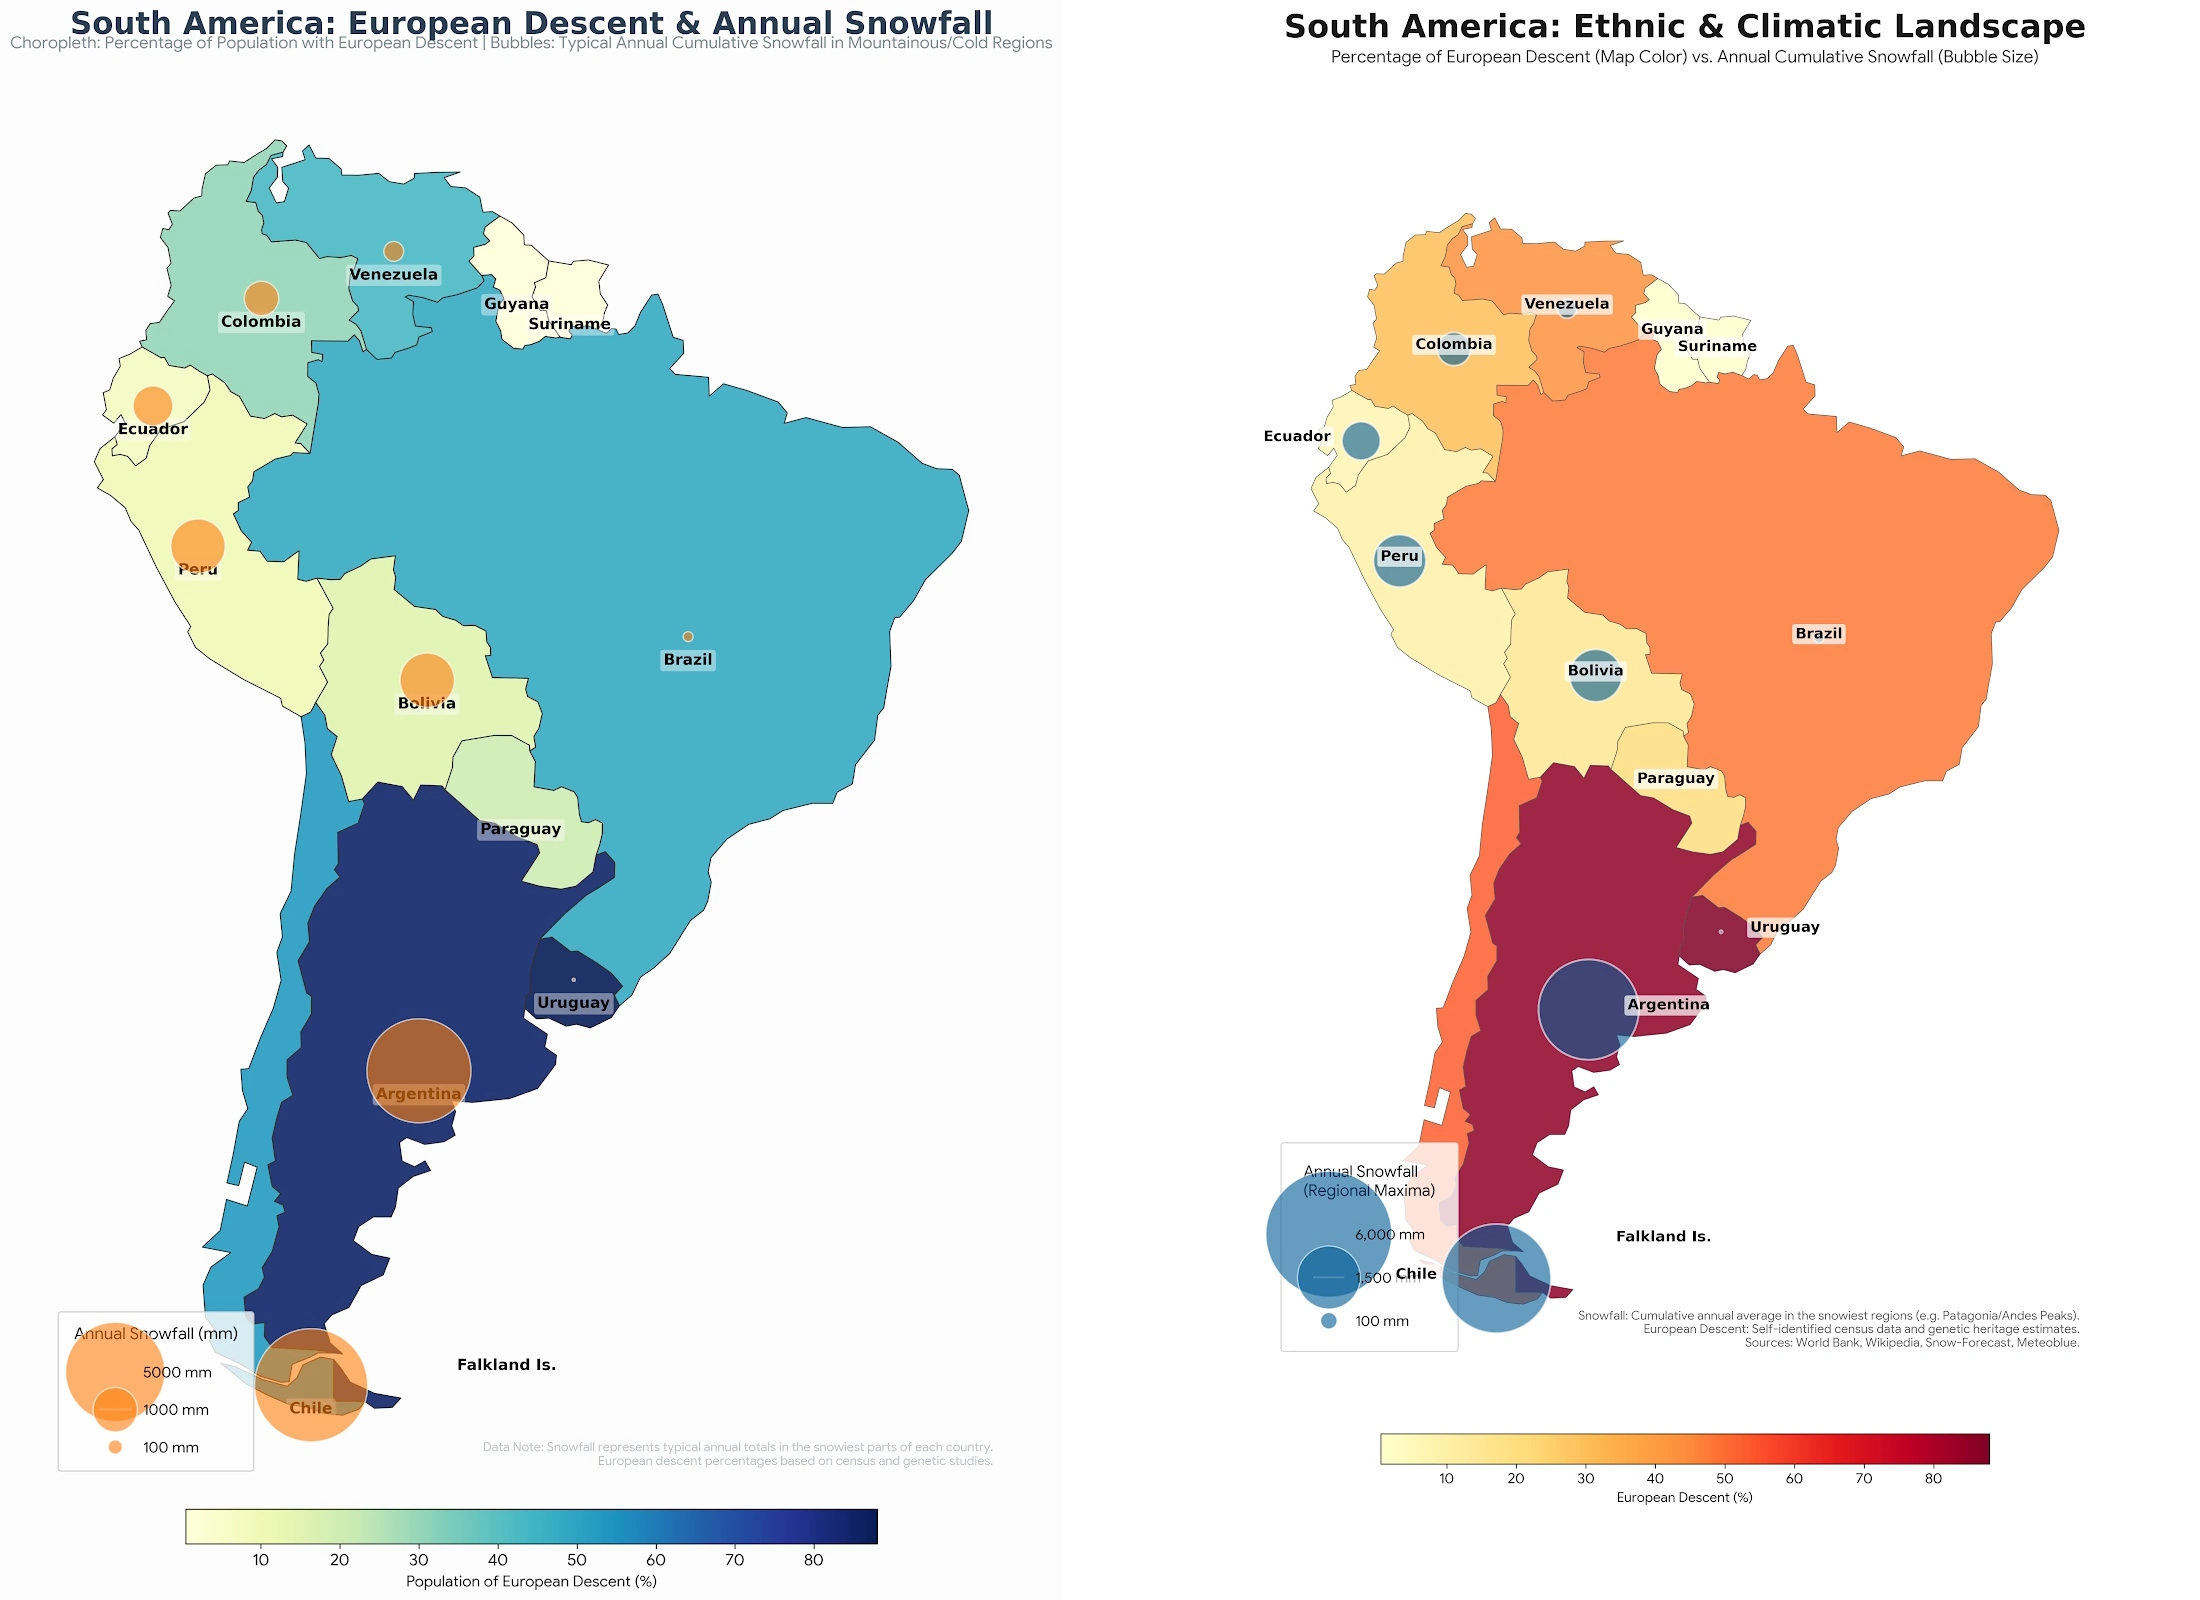
Climate Demographic Visualization - Climate demographic visualization combines environmental and population data to reveal patterns in how communities are affected by climate change. By visualizing metrics such as temperature trends, precipitation changes, and population density alongside demographic factors, organizations can identify vulnerable populations and plan targeted interventions. InetSoft's visual analytics capabilities enable stakeholders to explore these complex datasets interactively, uncovering correlations between climate patterns and demographic characteristics that inform policy decisions and resource allocation.
Assets Under Management Dashboards - For asset managers, wealth platforms, and multi-line financial institutions, Assets Under Management (AUM) is more than a vanity metric. It is a central indicator of scale, market relevance, and long-term revenue potential. Modern growth dashboards built around AUM give leaders a unified view of how assets are evolving across products, clients, and geographies, and how those trends translate into sustainable growth. A well-designed AUM and growth dashboard does not just show a single total. It breaks AUM down by business unit, investment type, and region, and overlays key growth metrics such as compound annual growth rate (CAGR) and performance over time. This combination of structural breakdown and temporal analysis helps executives understand where growth is coming from, where it is stalling, and which levers they can pull to improve outcomes. At the highest level, the dashboard should present a clear, reconciled AUM total, with the ability to drill down into more granular views. The most common dimensions are: Business unit: retail, institutional, private wealth, retirement, alternatives, or any internal segmentation that reflects how the firm is organized...
Audio Analytics Dashboard - For prominent audio streaming media platforms, song recommendation is a priority in refined operation. A real-time dashboard provides a vantage point to dig user preference on multiple features and identify the fusion of music elements among different genres. Targeted marketing strategies can be performed based on related insights. In a UGC(User generated content) product, whether platform can provide useful creator tools is closely associated with creator performance and churn rate. A flexible dashboard by InetSoft can be easily embedded into applications to help creators find the next hot music genre in certain area such as short-video. InetSoft's data intelligence web app is compatible with advanced machine learning model to mine hidden insights. It allows end users to have predicted information for reference to make data-driven decision...
Augmented Analytics Definition - Augmented analytics is a kind of data analytics that automates and improves the analytical process by using machine learning and artificial intelligence (AI) technologies. Data scientists must manually compile, analyze, and interpret data in conventional analytics, which may be a laborious and difficult procedure. But firms may automate data preparation and analysis using augmented analytics, giving business users access to insights and the ability to make wise choices in real-time. In this post, we'll examine what augmented analytics are, why they're important, and how they may help businesses in a variety of sectors. Defining Augmented Analytics Augmented analytics is a sophisticated kind of data analytics that automates and improves the analytical process using machine learning and AI techniques...
Balanced Scorecard Design - A balanced scorecard converts an organization's behind the scenes strategic business model into its daily marching orders. This scorecard sets the stage for what needs to be done in the future and lays out a plan of attack to achieve that goal. The business and its employees are "scored" in different categories which allows management to see opportunities for improvement. Balanced scorecards provide a framework for how a business should be run and enable executives to track their progress along the way...

Benefits of an Effective Analytical Environment - So what are the kinds of benefits that companies can expect to see with an effective analytical environment? Well, first as we talked about on the previous few slides, the best companies see an enhanced ability to make quicker decisions. More of these companies saw that accelerated decision speed as we see in the chart on the left. This then leads to an enhanced ability to satisfy increasingly demanding customers. Seventy-seven percent of best performing companies saw an improvement or substantial improvement in customer response time. With faster decisions along with faster customer response time comes increased business opportunities. Opportunities drive growth, and in many cases, as well, opportunities for efficiency gains, operational improvements and ultimately increased profitability. The best companies on average saw a 31% year-over-year increase in operating profit compared to a slight decrease for laggards. So, just to close out here, I want to explain how does a company tailor its approach to analytics and ultimately drive some of the performance improvements we talked about on the last slide. Well the data really here points toward a couple main areas that can help this journey, so to speak. First, it is all about understanding, managing and improving the data environment...
Benefits of InetSoft's Buffer Report Software - InetSoft's social media software is easy to use, customize, and adjust to the end user's personal preferences. The application can be up and running in weeks, not months. The reporting software makes it easy for marketing professionals to analyze various data in dashboards, visualizing metrics such as engagement on social media, and the success or lack thereof of pay-per-click advertisements. With InetSoft's drag-and-drop interface and point-and-click controls, marketing users who lack a technical background can build interactive marketing reports, all without help from IT...

Benefits of working with healthcare KPIs & visualizations - Before we dig deeper into the types of healthcare KPIs and data visualizations that will push your institution forward, let's explore the key benefits of working with dynamic data dashboards and BI tools. One of the most striking elements of working with a data dashboard equipped with visual healthcare KPIs is the innate power to interact with historical and real-time data to uncover potentially catastrophic medical issues in patients before they happen. This vital branch of BI-powered predictive analytics is critical for providing more tailored patient treatment options while significantly driving down mortality rates within healthcare institutions.s...
Best Analytics Tools - In any business, finding and implementing the best analytics tools is one of the most important factors in setting yourself up for success. The steps taken to track statistics and monitor important performance data in order to make good business decisions is often crucial in the success or failure of a business...
Best Embedded Analytics Tools - Our program today is maximizing the power of data with embedded analytics tools. I'll be talking about some trends around that are impacting the direction of embedded analytics. Some of the issues around increasing the potential of the best embedded analytics with Cloud platforms and frameworks, which is really one of the big changes in this world of embedded analytics. Then I will talk about monetization basically the idea of trying to use data and analytics for monetization purposes, and we'll get into that and what can be done with employees and so forth, to turn it around into kind of productizing it. Then I'll conclude with some recommendations. I think that the big picture is digital transformation. That's kind of one of those buzz words out there, but it's no denying the fact that data is being generated everywhere. We have edge devices. We all are carrying around our mobile devices, and they are generating data about all kinds of things, our activities or behavior, and then of course, geo-location and security issues and things like that. Then organizations are increasingly competing with software as a service and also a platform as a service, other Cloud based applications and data platforms and services. There's a lot of data moving to the Cloud being generated in the Cloud. Then there is the whole area of online customer behavior and consumer behavior, which stretches across multiple kinds of systems...
Best Practices for Applying Analytics to Big Data - That is definitely a best practice for applying analytics to big data. Assess your maturity, and start from where you are and build from there. Another best practice is to really look at the signals. Understand not just the structured data that we’ve traditionally looked at with business intelligence, but what are the new signals that are coming from click stream data, RFID tags, asset intelligence like with the windmills. What is social media saying about my products and my reputation? What’s my workforce’s opinion through the wisdom of crowds? So lookat all of the signals when I ask that soft question and make sure that we are taking all of the views into when making decisions. Another interesting thing about it is that it really has a very strong focus on the decision to be made and the decision maker. And that idea of start where you are is very key. I was talking recently to a marketer who asked me about focus groups, does that count as analytics? And I said, well, on the one hand, focus groups have largely been discredited. There’s a well-known tendency for participants to tell you what you want to hear...

Best Practices for Mobile Business Analytics - There is a treasure trove of research on best practices out there, both in analytics of mobile business and analytics of enterprise mobility, social media monitoring, social sharing, and social selling. Many of the aspects we are talking about to you are available at no cost. So please if you like to know more, contact any of us presenting after this presentation and we can help you find them. This research is available free of charge. So we are really hoping that you are walking away from this with some practical knowledge as an inspiration that some of the experience and the enlightenment, if you will, that has been enabled by InetSoft’s approach to technology integration, can apply to you as well. It’s not just a public-cloud infrastructure. All of this capability is also available in what’s often called a private cloud, which is virtualized data center. If you are in industry where security is paramount, you may not want this to use Amazon’s EC3 or Microsoft’s Azure or any of the other public services. You can still benefit in exactly the same ways in a virtualized data center. If you think of it this way, virtualization is on the path to private cloud. The only difference really between virtualization and a private cloud is some of these capabilities to have services on demand and internally build them according to usage or the aspects of private cloud that are not necessarily part of virtualization...

Best Practices for Successful Business Analytics Adoption - Today we are talking about adopting business analytics and what we have found to be best practices for their successful adoption and use inside the enterprise. The first observation is that we noticed that organizations that outsource their IT activity, I can’t remember if it’s IT specifically related to business intelligence products, but organizations that outsource their IT activity, depend on external consultants rather than develop the position internally, they tend to be less mature and get less benefit out of the IT solution. The theory is that those external resources don’t know the business as well as internal resources. The second point to make is that sometimes organizations are not ready to improve business analytics. They realize they have to make improvements but they are not ready. It relates largely to business justification. Often we have seen IT organizations driving the BI project, and they just don’t understand it well...
BI Analysis - information on why to evaluate InetSoft's business intelligence analysis software. The visual analysis capabilities are very intuitive to use, yet powerful in their ability to uncover patterns or identify outliers, thanks especially to a 100% HTML5 user interface and homegrown charting engine refined over a decade...
BI Analysis in Urban Traffic Management Departments - Business Intelligence (BI) analysis in traffic management departments involves leveraging data to gain insights into traffic patterns, optimize operations, and make informed decisions. Here's an overview of how BI analysis is typically done in traffic management: Data Collection and Integration: Traffic Sensors and Cameras: Utilizing sensors, cameras, and other IoT devices to collect real-time data on traffic conditions, including vehicle counts, speed, and congestion. Weather and Environmental Data: Integrating weather and environmental data to understand how external factors impact traffic. Data Warehousing: Centralized Storage: Storing data in a centralized data warehouse that allows for efficient management, analysis, and retrieval of traffic-related information. Data Cleaning and Transformation: Preprocessing: Cleaning and transforming raw data to ensure accuracy and consistency before analysis. This may involve handling missing values, removing outliers, and standardizing data formats...
BI and Analytics - Many business owners and executives have access to large amounts of accumulated business data. But when it comes to actually turning data into insights that help steer organizational direction, many find themselves at a loss for where to begin. Enter Style Intelligence, a complete BI solution for interactive dashboards and reporting, recently rated number one by Butler Analytics among enterprise business platforms. InetSoft offers organizations an easy, hassle-free solution to creating in-depth and concise analytics for all of their accumulated and live data, whatever the data sources may be. InetSoft's StyleBI provides non-technical users access to a robust, yet intuitive interface that allows them to create high-quality and effective visual analytics of business data. Using StyleBI guarantees effective and efficient methods for creating interactive dashboards and reports, featuring graphs, charts...
BI Analytics Trends: Big Data - First, as background, for those of you who aren’t familiar with InetSoft, what we really do is help businesses get access to data so they can make better operational decisions. We are a software maker that’s 100% focused on business intelligence and analytics in a variety of industries. And our number one goal is to help companies do everything from building a strategic roadmap of how they can get access to data and how they can get it into the hands of the people who need it. We do the hardcore reporting development so business users can actually visualize that data. What’s interesting is even with the economic downturn we are seeing a lot more companies really focusing on using data as a corporate asset. We are seeing financial firms, manufacturing and retail being really big drivers of modernizing information management. For the first time they are saying, hey I have all these data silos. How can I get access to all of that siloed data, so I can create a comprehensive view of my business...

Big Data Analytics in the Banking Market - Every day, we produce huge amounts of data. Whether it is a web page we open or a transaction we make, all of these actions sum up into 2.5 quintillion bytes of data daily. Logically, such huge amounts of invaluable information can be analyzed to come to all kinds of conclusions that will be helpful in almost any industry, including the banking market. Importance of Big Data Analytics Big data analytics has numerous benefits specifically for banks. Big data analytics can give insights into many aspects of a person's life including their needs, preferences, and lifestyle. This allows banks to personalize their services to meet the needs of every individual. Moreover, big data analytics can also improve the extrapolative power of risk models that financial institutions and banks use. But this is not all. Some other benefits of big data include: A Full View On Your Business: By getting such crucial information like customer behavior patterns and internal process efficiency, you can get a full picture of what your business is and how and where it can be improved. You can even obtain broader market trends and as a result, make informed, data-driven decisions to ensure the safe and effective functioning of your business...
Big Data Analytics Solution for Cities - More than a buzzword for cities, Big Data is the term that describes the endless amounts of data created every day by a city's citizens, agencies, organizations, businesses, sensors, and machines. Understandably a city can struggle to reap the value of all this data. Without specially-trained staff or the latest analytic tools, it can be hard to easily understand the trends, patterns or relationships inside the data. The value of Big Data is realized when information is extracted from the myriad sources, combined, and interpreted to uncover insights that lead to actions that make a difference in addressing the challenges facing our cities. Cities are complex, dynamic structures. With so many moving parts, they are challenging to predict. Yet, administrations are charged with managing the infrastructure and services with a goal of building a prosperous, resilient city. One challenge is coping with contrasting areas of expansion and decline along with a diverse and changing populations. In terms of services affecting their economy, health, transportation and education are the essential services that affect anyone who lives, works, or travels in the city. All of these things are interconnected - which makes the analysis and the choice of actions more complex...
Big Data Analytics - There has been a lot of talk this year about the wonderful world of big data and big data analytics. What is driving big data today? When we talk about big data, we’re often talking about volumes of data, and what is driving that tremendous increase in volume. I’ve heard people call it tsunami of data that is now. Things that are driving that volume are a lot of new channels or new sources of data coming into the enterprise. This includes digital data, data like click stream traffic, things like mobile applications. It also includes a lot of sensor data that is coming off our vehicles or coming off of production lines. All of these news sources of data are generating not only large volumes of data. To be honest database companies have solved the issue of large volumes of data for some time now. What we’re talking about now is how do we solve some of the new challenges around big data analytics. That includes both being able to take in these news sources of data, which are not well structured...
Big Data Analytics In Marketing - Today we are talking how big data analytics is important in marketing. For many years CPG brands have been doing a lot of digital marketing in addition to their traditional display advertising and their brand marketing, and they’ve been conducting these campaigns with their agency partners. But there are a number of factors in the marketplace that have surfaced in recent years that are having a lot of them rethink that approach. This is because it introduces some challenges around using the insight and the data that those activities generate to actually help deepen consumer relationships. And there are a number of reasons why that’s important these days. The first reason is the economy, of course, and consumers are really price sensitive, but it’s also very difficult to differentiate your product among all those on the shelf. Consumers are bombarded with messages from a lot of different marketers. Private label competition makes it very challenging as well. And there’s a lot of evidence also suggesting that consumer behavior isn’t really isolated to an in-store experience in terms of making a product selection...

Boost Your Hospitality Business With Data Analytics - Easier data analytics has tremendous potential in the hospitality industry, but are you taking advantage of it already? If not, you better think about it soon because your competitors are probably using advanced data processing programs to create better offers for their clients. According to the report, the key benefits of implementing new technologies in the hospitality business include an increase in online revenue, reduction in guest complaints, and better customer service ratings. If data analytics can generate such impressive results, the only real question is how to make use of it and help your business flourish in the years to come. In this post, we will explain to you how to boost your hospitality business with data analytics in no time...
Building an OLAP Cube for Analysis Services - Have a look at the simple example of what happens in that kind of interaction as an analyst. You can’t really see what’s not there. So, a report, a query, a dashboard, even a cube, if you’re building an OLAP cube for analysis services, or OLAP, or something like that have strict sets of data. And what happened is you have personally restricted the data that is visible to a person which means you’ve lost some contextual information. Is this 10% of the data or 90% of the data in the database? You wouldn’t know. You wouldn’t be able to look at the distribution of data in that data set and know what’s going on unless you knew the constraints that were applied. Now, imagine the person working in Excel, or Access, or something else. You run six reports, you put them into six tabs in Excel, you have now lost the ability to unhide your initial constraints. The constraints keeps you from doing a full analysis because a lot of times the answer lies not in the ‘x’, the constraint that you’ve applied. The answer lies in the not ‘x’, the part of the data that you did not retrieve. So, you have to write a second report to get that information and compare it to the first one. Or you have to retrieve the whole set and somehow sort those things out. All of these options, if you’ve worked with BI tools before, you understand have problems. So, you have to be able to surface constraints and show them to people. Now, the report shows the data well, but it typically does not show the constraints that we’re applying to retrieve that data. This often leads in the BI world to problem solving for us as the BI professionals supporting others. These aren’t the constraints you’re looking for. You have the report using these constraints, but you left out some data. That’s why your numbers don’t match...
Building Real Estate Analytics - Are you looking to build a scalable and adaptable analytics system for tracking realtor performance across various US markets. The goal is to display aggregated performance metrics, such as sales volume from both listing and buying perspectives, filtered by levels like state, county, zip code, or MLS, with customizable date ranges. These metrics should also roll up to the office level to identify top-performing agents within offices. You need to combine three datasets—listings, tax/assessor records, and office information—into a single large fact table in Snowflake. This table aggregates agent performance by year and month across those geographic areas, enabling queries like comparing agents in a specific zip code, identifying an agent's top sales regions, or calculating average listing prices...
Business Agility and Business Analytics - Now let’s answer some of the questions that have come in. Talking about business agility and business analytics, where does the cloud fit to this type of business problem, or is there one? Well the cloud fits in lots of different areas, one in particular that you know, not every company is going to have these capabilities, and I think you’re going to see the rise of cloud services organizations that provide these capabilities to companies that don’t have the resources to manage them internally. This can alleviate some processes. It can automate some processes. What are some best practices for implementing a business intelligence solution? The BI technology and the BI tools are just as important as the business processes you have got. It seems there is not just a technology fix. There are a lot of best practices and business processes. In fact I think that’s most important. It’s about governance, and it’s about ownership and all these other business practices that you put into place...
Business Analysis Solutions Software- Style Intelligence, InetSoft's flagship BI product, is the perfect business analysis solution with support for multidimensional charting, filtering, and drill down analysis. Multidimensional Charting Using a two-dimensional chart (x and y), you can recognize basic trends in data. With a multi-dimensional chart you can see much more. Multidimensional charts use elements like color, size, and shape to present a more complete picture that explains, visually, why two-dimensional trends exist...
Business Analysis Software - a description of the benefits of InetSoft's business analysis software, how it is robust enough to grab the attention of executives, meet the demands of power users, and scale up for organizations of any size...
Business Analysis Tool - When analyzing a business, management will commonly employ a selection of diverse tacticsincluding SWOT analysis and quantitative analysis. An ERP (enterprise resource planning) system can then be used as one of the many repositories of corporate data that needs to be analyzed. SWOT analysis outlines a business's strengths, weaknesses, opportunities, and threats. It involves specifying the objective of the business venture or project and identifying the internal and external factors that impede or assist in achieving that objective. Quantitative analysis works in financial matters using numerical techniques to plan and execute the next move...
Business Analysts in State and Local Government Agencies - If we look at business analysts in state and local government agencies, it’s a little bit different story there. State and local government agencies are often played with. And gosh I don’t how they do it, but they really are played with a lot. The biggest one of late is because of budget cutbacks at state and local agencies, there is a tremendous push to eliminate waste, waste where projects are concerned. One of the first places that they are looking are at the requirements and practices. It’s interesting to know that as these requirements practices are getting better, there has been increased pressure on some of the outsourced vendors that are working with state and local agencies to also get better. So, you are going to see some of the other trends manifest themselves as a result of this one as well. And this is not an isolated situation. This is not just the U.S. government. It’s the Canadian government. It’s the Singaporean government, the Japanese government, and the Indian government. It has spread all over the world. We are starting to see you a very slow proliferation as the world of business analysis grows...
Business Analysts with Experience in Programming and Development - Nowadays most of the times employers are expecting business analysts to have experience in programming and development. They are expecting them to share the developer’s load if required now. To what extent is that correct? If you asked some North American analyst probably you might find them in violent disagreement that programming may not be a requirement. I say the more knowledge and more experience you have the better to help propel it forward. I would caution, however, business analysts with rich programming backgrounds are likely to not be objective observers. So there are pros and cons. I think if you got it, great, if you don’t, then you would probably be a little bit more objective than somebody with it. The poll came in. We got 41% saying yes, second place is 25% that we are using the hybrid and waterfall initiative. After that we have No, and last we have we’re thinking about it. So, but ‘we’re thinking about it’ is 14%, so it’s a little more negative. Thanks everybody for contributing. I am very pleased to see that with the numbers, so here we go...
Business Analytics - an interview by the BI Network's editor and founder, Ron Powell, of Luke Liang, founder and CEO of InetSoft, about the company's evolution from a reporting tools vendor to a provider of business analytics software and other business intelligence technologies. We actually divide users into three groups. First, we have the front-line users. Those people typically don’t have sophisticated training. They need very simple interfaces, and there should be close to zero training required to get them productive. That’s what is great about interactive dashboards. Simple pointing and clicking allows a great deal of navigation that is very intuitive. The second type of user is the manager. They typically want a little more sophistication. They want to control their database access a little bit more. For example, they want to be able to change their own dashboards. They want to be able to drill down to the details. But they in no way want to become data analysts. That’s the third group of people, the business analysts or the power users. Those are the people who specialize in understanding the database, understanding the data, so they can very dynamically generate new information. And this is really the group that we see analyzing away, and really wanting to get into the powerful features beyond the reporting side. These are the people who are actively seeking this kind of analysis that we have been talking about here...