Referencing Dashboard Component Data by Cell
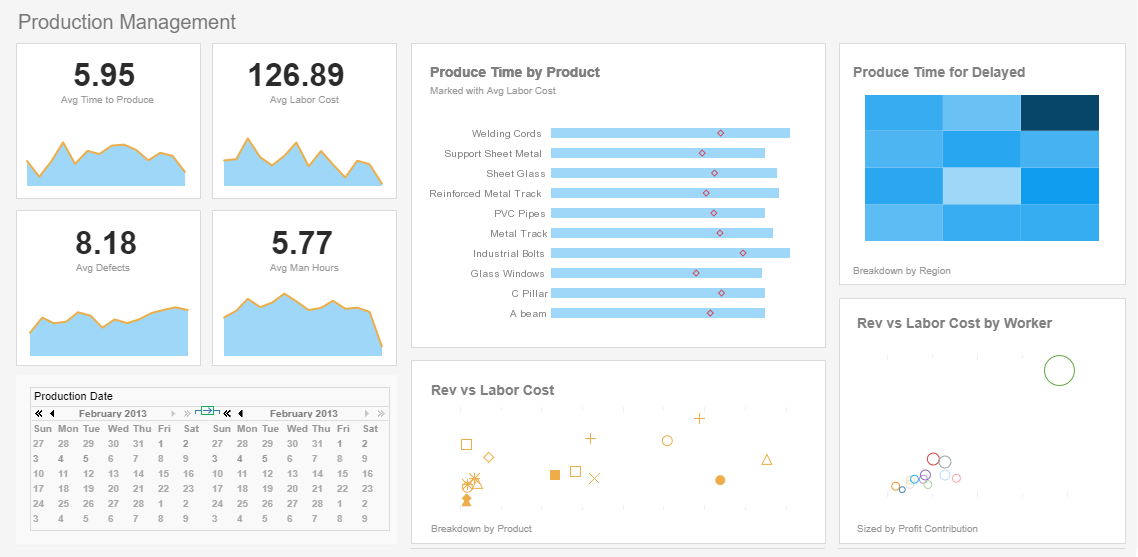
InetSoft's dashboard software allows users to create custom analytics dashboards to ensure that complex info is broken down into easy to recognize pieces. View the example below to learn more about the Style Intelligence solution.
For Table, Crosstab, and Selection List components, expression scripts can acquire actual data values from the component using relative or absolute references.
| #1 Ranking: Read how InetSoft was rated #1 for user adoption in G2's user survey-based index | Read More |
The keywords below allow you to access cells within a table or Selection List by using relative indexing (i.e., reference in relation to current cell).
| Syntax | Description |
|
field['col_name'] |
Value in the current row of column named “col_name.” |
|
row |
Row index of the current cell. |
|
col |
Column index of the current cell. |
|
data[rowIx][colIx] |
Value of the data at index [rowIx,colIx] in the raw data (before grouping or summarization). Indices may use keywords 'row' and 'col' to create relative references. |
|
table[rowIx][colIx] |
Value of the data at [rowIx,colIx] in the table (as displayed). Indices may use keywords 'row' and 'col' to create relative references. |
|
value |
Value of the current cell. |
You can type these keywords manually into your script, or you can click the appropriate node on the 'Component' tree in the Script Editor.
Conditional Text Formatting
This example sets the text colors and fill colors of table cells based on data values within the table. If a price is greater than $1000, the price displays in red text, otherwise, in blue text.
1. Create a Viewsheet based on the 'ProductSales' Data Worksheet.
2. Drag and drop the 'ProductInfo' Data Block from the Component pane into the Viewsheet. Expand the table so that you can see more rows.
3. Select any data cell under the 'Price' column. Right-click and choose the 'Format' option. This opens the 'Format' dialog box.
4. Select the Color tab.
5. From the 'Text Color' menu select the 'Expression' option, and click the 'Edit' button. This opens the Formula Editor.
6. Enter the following script in the Formula Editor:
    if (value > 1000) {
    [255,0,0];        // red
    } else {
    0x0000FF;         // blue
    }
Note: A color can be specified as an ordered triple, or as a hexadecimal number.
7. Click 'OK' to exit the Formula Editor, and then click 'OK' to exit the 'Format' dialog box.
Notice that the cells in the 'Price' column are colored red if the value is greater than 1000 and blue otherwise. The script affects the entire 'Price' column, and can be edited from the 'Format' dialog box of any cell in the column.
 |
View live interactive examples in InetSoft's dashboard and visualization gallery. |
More Articles About Dashboards
Alternative for Box Reporting Software - Box's software is a platform for content management, workflow, and project management. Effective project reporting is essential for an organization's progress and should be implemented at all levels ranging from employees to owners and executives. The right status reporting software will integrate all relevant sources of data, making it easy to keep all of an organization's activities in check. InetSoft's flagship tool, Style Intelligence, includes a custom web connector for Box data, as well as connectors for a host of other data sources, both cloud and on-site...
Dashboard Composer Tool - InetSoft's dashboard composer is a intuitive and innovative approach to business intelligence that allows you to customize the way your data is displayed. View the examples below to understand how the dashboard composer makes your goals attainable. When Visual Composer cannot automatically match your geographical data to the locations in the geographical database, the 'Geographic Feature Names' dialog box will prompt you to manually create the correct mapping. To manually match the geographical data with locations in the database, follow the steps below...
Evaluate InetSoft's Box Reporting Tool - Looking for a good solution for Box reporting? InetSoft's pioneering BI application produces great-looking dashboards that mashup content collaboration data with other enterprise data in your organization. View a demo and try interactive examples...
How to Make a Box and Whiskers Chart in InetSoft - To create a Box Plot in InetSoft, drag a Chart component from the Toolbox panel into a dashboard in Visual Composer, and then press the Edit button to open the Chart Editor. create a box plot Press the Select Chart Style button. Choose the Box Plot style. Press the Apply button. Drag a desired dimension to the 'X' or 'Y' region...
Hyperlinks to Targets in a Report - Every report element can be set to be a target (anchor). You can define a hyperlink from any report element to any target within the same report. The target name can be made dynamic and passed as a parameter from the hyperlinked element. Target hyperlinks are also exported to the PDF format...
Intuitive Dashboard Example - An intuitive dashboard affords end-users with a large learning curve that is non-existent in most brand name business intelligence applications. Users possessing minimal technical abilities will be able to take advantage of in analytic depth features while they are first learning to use the program. View the example here to learn how InetSoft's Style Intelligence can increase your business intelligence knowledge just by using it. A Data Tip displays information about the current region using another Viewsheet component, such as a chart or a gauge. The data tip component displays data only for the particular region over which the user hovers the mouse...
Option for Resource Planning Dashboards - Resource planning is an invaluable task that is a requisite undertaking in all industries. InetSoft's Style Intelligence makes resource planning far easier than in the past with interactive dashboards, embeddable reports, and a small Java footprint. View the example below and take the first step toward smart resource planning...
| Previous: Accessing Dashboard Input |
Next: Disparate Dashboard Data
|
