BI Software Tutorials
These business intelligence tutorials demonstrate real-world use cases such as report and dashboard layout, data binding, data source creation, interactivity, scripting, and design for reusability and maintainability. Whether you're new to InetSoft, or would simply like greater insight into InetSoft's capabilities, there's always something to view.
Dashboard Software Tutorials
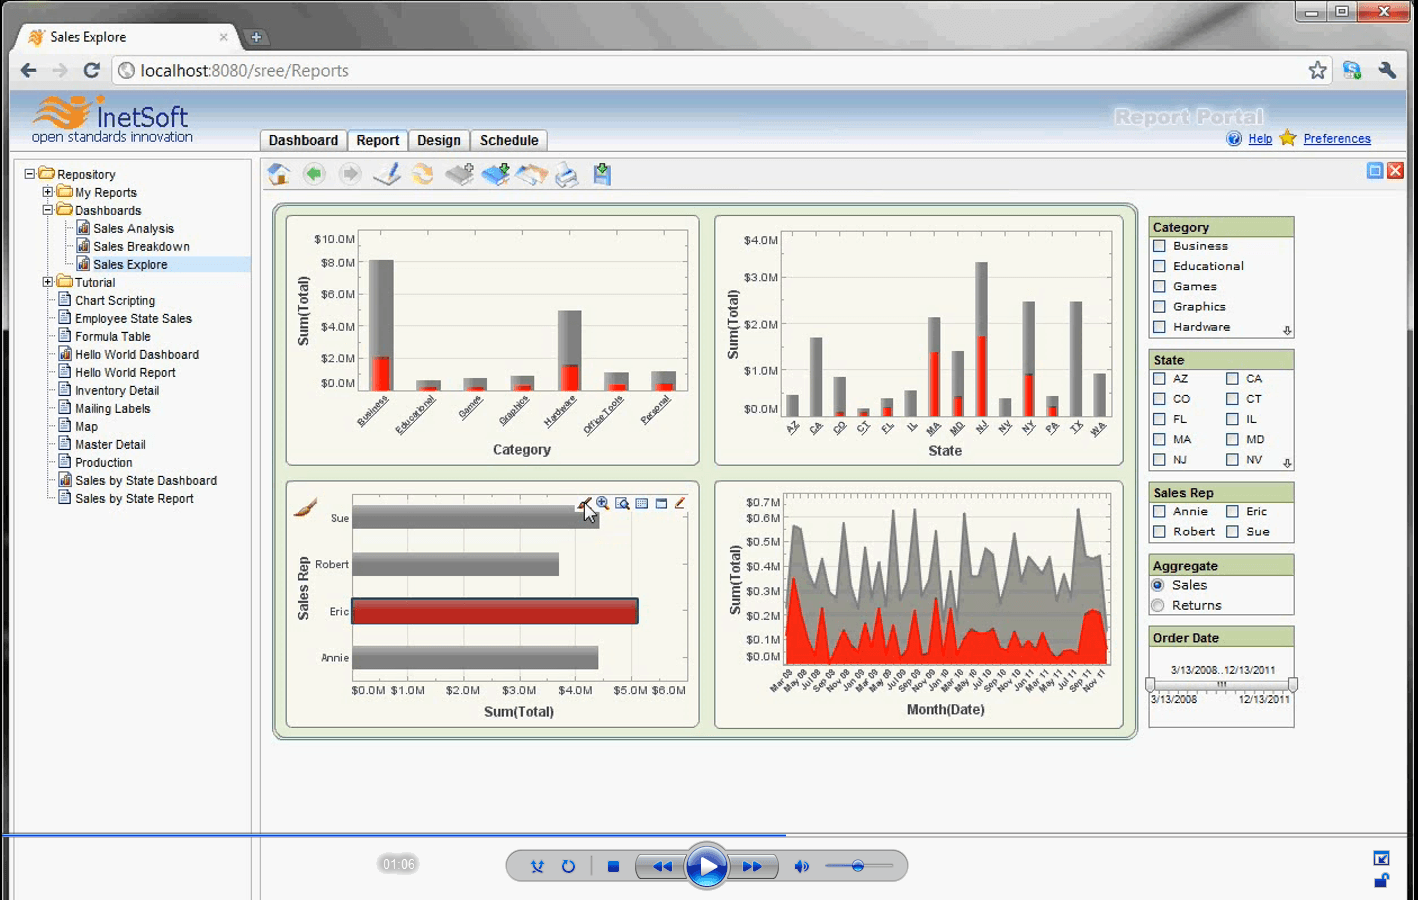
These short videos provide an overview of common dashboard features, adding interactivity, multi-dimensional analysis, binding data to elements, basic scripting, and much more...
Data Modeling Tutorials
Learn about InetSoft's data layer capabilities with these data modeling tutorials to see how easy it is to leverage your data in the form of dashboards and reports...
Reporting Software Tutorials
View these brief videos to learn about report design, simple formatting, layout, element-specific binding, basic scripting, reusable components, formula tables, and much more...
More Resources About InetSoft's App
-
Display A Summarized Value
Explains the set of output widgets available for presenting single-value metrics, such as thermometers, cylinders, scales, and gauges, and how they differ mostly by appearance rather than binding behavior. Describes the simple drag-and-drop binding workflow that connects a Viewsheet output component to a data block column and selects the summarization method. Covers common formatting and property options designers use to control numeric precision, labels, and thresholds. Emphasizes practical use cases where compact single-value displays make KPIs immediately visible on executive and operational panels.
-
Grant End-Users Full Control
Details the component properties interface that lets designers and administrators expose or lock down editable settings for end users. Shows how property dialogs are organized and which common attributes (size, formatting, bindings) can be adjusted at runtime. Explains the tradeoffs between designer control and user self-service to ensure consistency while enabling personalization. Suggests patterns for creating component templates with sensible defaults that still allow safe user adjustments.
-
Acquire Actual Data Values
Describes techniques for programmatically referencing component data values by cell so expressions and scripts can consume live dashboard content. Covers relative and absolute reference styles for Table, Crosstab, and Selection List types, and how to use those values inside calculations or other components. Illustrates how referencing component cells enables cross-component interactions such as drill-throughs and contextual calculations. Advises on validation and error-handling when expected cells are empty or out of range.
-
Generate DHTML Output
Walks through integrating InetSoft report output into external web applications by constructing servlet URLs that return DHTML or other render formats. Explains the key parameters used to control report selection, appearance, and output behavior from client-side code and how those parameters are embedded in generated pages. Describes iframe and servlet approaches for embedding interactive report views while preserving single-sign-on and session semantics. Highlights patterns for passing runtime parameters from the host application into the reporting engine for customized rendering.
-
Set Permissions Via Objects Tab
Outlines the permission model for report objects and explains how administrators assign access rights using the Objects tab in the repository. Lists typical permission categories (read, write, execute) and the object types to which they apply, including data models, worksheets, and visual assets. Discusses recommended practices for grouping users and roles to simplify large installations and ensure least-privilege access. Notes auditability features for tracking changes to permissions and diagnosing access issues.
-
Five Different Types Of Worksheet Assets
Introduces the concept of reusable worksheet assets and catalogs the common asset types that can be saved to the repository for reuse across reports and dashboards. Explains how assets (for example, data tables, calculated fields, and visual fragments) accelerate development by avoiding repetition and preserving business logic centrally. Describes the process for saving, discovering, and reusing assets within Viewsheets and reports. Recommends governance practices for asset naming and lifecycle management to prevent drift in large teams.
-
Select A Single Component
Provides practical how-to guidance for designers building Viewsheets, covering selection, sizing, positioning, and multi-select techniques for components on the grid. Explains the move and resize handles, context menu actions, and keyboard shortcuts that speed layout tasks. Shows patterns for grouping components, aligning elements, and using container objects to maintain consistent layout behavior across breakpoints. Encourages iterative layout adjustments and previewing on different device sizes to ensure responsive dashboards.
-
Container Component Can Hold Only
Explains the container concept used when grouping multiple UI elements and how grouping produces a new container that aggregates its constituents. Describes container-specific properties and the restrictions on nesting (containers cannot hold other containers directly) along with strategies for organizing complex layouts. Covers how containers affect sizing, clipping, and shared formatting for their child components. Suggests layout architectures that use containers to create reusable, modular dashboard sections.
-
Create Stunning Visual Representations
Surveys the basic report elements (text, table, chart, image, etc.) and explains how each contributes to clear, data-driven storytelling within reports. Discusses independent element properties and how designers manipulate them to control alignment, formatting, and inter-element interactions. Highlights examples where combining elements—tables with adjacent charts or embedded KPIs—improves interpretability for different audiences. Recommends template practices that balance aesthetic polish with data density for professional deliverables.
-
View A Two Minute Demonstration
Describes the mechanisms for wiring input controls (filters, selectors, date pickers) to component properties so user interactions modify dashboard behavior. Explains best practices for validating input values before they propagate to avoid runtime errors and unexpected results. Covers use cases for linking inputs to multiple components to create coordinated, cross-filtering experiences. Points readers to short demos and examples that illustrate input wiring patterns in real dashboards.


