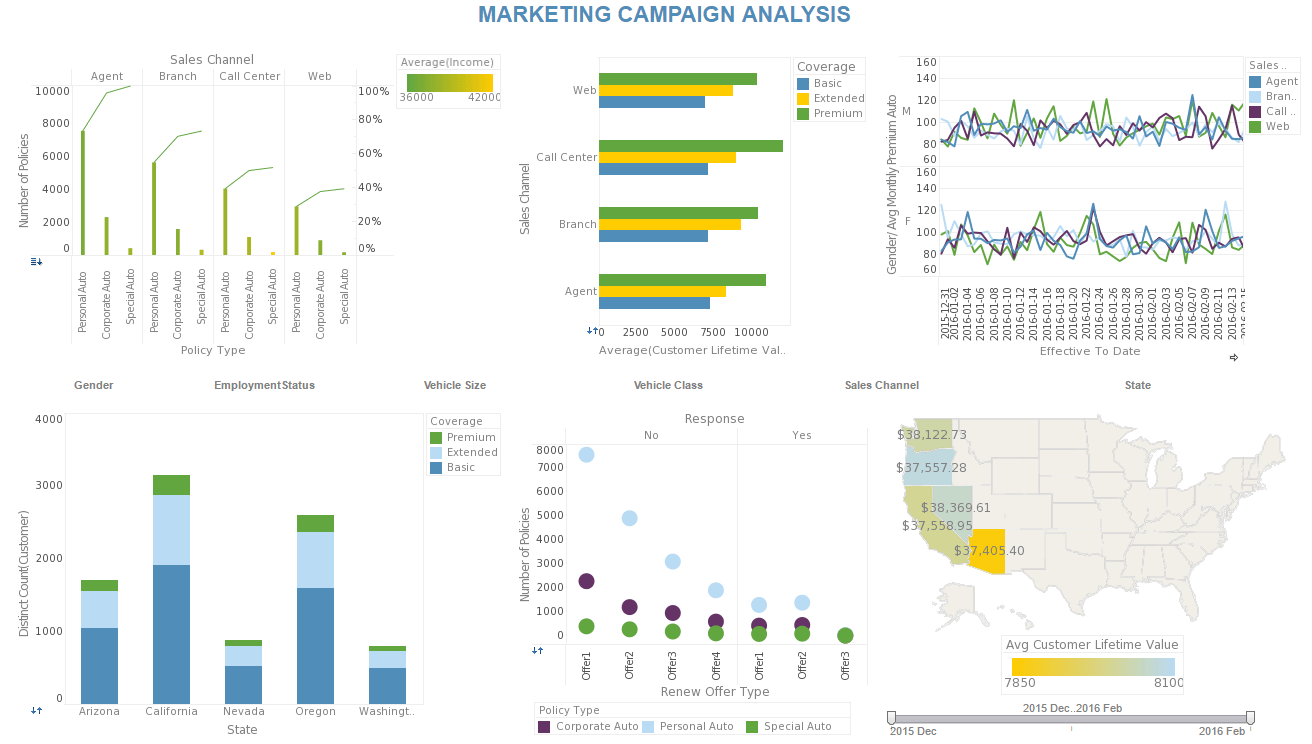
Free Visualization Software for Visual Analysis
If you're looking for free visualization software to perform data mining or explore your data with an easy to use visual analysis tool, try Visualize Free.
Derived from our commercial business intelligence software, this free analytics application is designed to be very intuitive and interactive.
How a Free Visualization Tool Can Help
Visualization is the perfect technique for sifting through multi-dimensional data to spot trends and aberrations or slice and dice data with simple point-and-click methods.
If you are looking for a way to visually explore and present data that standard office charting software cannot handle, and/or you're not able to install a desktop-based analytics application, Visualize Free is your free Web-based on demand analytics solution.
Use Visualize Free to Evaluate InetSoft's Commercial Visual Analysis Software
Visualize Free provides an easy way to evaluate some of the capabilities of InetSoft's commercial visual analysis product, which is available as a standalone visual analysis and interactive dashboard application in Style Scope, and as part of a complete business intelligence software application in Style Intelligence.
Note that as a free visualization service, Visualize Free naturally has limitations. InetSoft's commericial analytics software includes these additional capabilities:
- Live, real-time access to almost any data source
- End-user driven data mashup of disparate data sources
- Fine grained security, permissions, and sharing options
- Interactive dashboards
- Monitoring dashboards
- And much more...
Comparison: Visualize Free vs Tableau Public
Overview of the two tools
Visualize Free
A free, cloud-hosted, browser-based data visualization and dashboard tool from InetSoft. Users upload spreadsheets (Excel/XLS/XLSX) or CSV/TXT files and build dashboards via drag-and-drop. Positioned as an entry-level or evaluation version of a commercial BI platform, Visualize Free focuses on simplicity and quick spreadsheet-to-dashboard workflows. Limitations include a narrow set of data source types (primarily flat files), limited user/privilege controls, and shared in-cloud resources that constrain scale.
Tableau Public
A free version of Tableau intended for creating and sharing data visualizations publicly. It provides desktop and web authoring and requires published workbooks and data to be accessible in the Tableau Public cloud. Tableau Public is designed for journalists, bloggers, students, and anyone building a public portfolio of visual stories. The tool offers a polished visual design experience and a large community; the most important constraint is that published content is public by default, making it unsuitable for confidential data without upgrading to a paid product.
Head-to-head comparison (features, strengths & weaknesses)
| Feature | Visualize Free | Tableau Public |
|---|---|---|
| Ease of use / learning curve | Browser-based drag-and-drop workflow oriented to spreadsheet users; straightforward for basic dashboard creation. | Drag-and-drop with a highly refined UI and abundant learning resources; strong community support for newcomers. |
| Data sources / connectivity | Limited mainly to uploaded Excel/CSV/TXT files; no live database connectors or extensive mashup capabilities in the free tier. | Free tier focuses on static files and some cloud sheet sources; full connector set reserved for paid editions. |
| Sharing / privacy / publishing | Dashboards can be kept private and shared via link, giving control over visibility suitable for internal or restricted use. | All published workbooks are public and discoverable; not suitable for private or confidential data unless using paid Tableau products. |
| Scale / performance / dataset size | Shared free resources mean limited scale and variable performance; not optimized for very large datasets or heavy concurrent use. | Free edition supports substantial datasets but has practical limits; performance and scale improve significantly in paid offerings. |
| Features / visualization power | Provides a useful set of charts, interactive filters, and mapping for many small to medium tasks. | Richer visualization capabilities, advanced analytics and formatting options compared with typical free tools. |
| Ecosystem / community / skills transfer | Smaller ecosystem; skills may not transfer as broadly across enterprise tools. | Large ecosystem and community; skills learned translate well to Tableau’s paid desktop/server products and to job-market opportunities. |
| Use case suitability | Best for personal analytics, small team dashboards from spreadsheets, and internal sharing when privacy is needed. | Best for public storytelling, building a visualization portfolio, learning a widely used BI tool, and publishing to a public audience. |
| Cost / “freeness” | Free to use with stated restrictions and evaluation positioning; suitable for small-scale non-enterprise use. | Free for public publishing; significant constraints on privacy push commercial users toward paid versions. |
| Upgrade path / professional use | Upgrade to InetSoft’s paid products for enterprise-scale connectivity, security, and performance. | Clear upgrade path into Tableau Desktop, Tableau Server, or Tableau Online for enterprise needs; skills transfer is strong. |

Detailed considerations and practical tradeoffs
- Privacy and sharing model: Visualize Free permits private dashboards shared by URL, making it a better choice when data confidentiality matters. Tableau Public requires public publishing, which makes it unsuitable for internal or sensitive data unless upgraded.
- Data connectivity needs: If live database connectors, APIs, or enterprise mashups are required, neither free tier fully satisfies those needs; both products require paid upgrades for robust connections. For simple spreadsheet workflows, either tool will work, though Visualize Free is explicitly optimized for file uploads.
- Skill portability: Learning Tableau Public develops skills that are widely recognized and portable into enterprise environments. Visualize Free teaches vendor-specific workflows that may not carry the same industry recognition.
- Performance expectations: Free, shared services will present limits. Visualize Free is explicitly an evaluation/free tier on shared cloud resources; Tableau Public provides reasonable performance for many projects but scales up better in paid editions.
- Community and learning resources: Tableau Public benefits from a very active community, many tutorials, public dashboards to learn from, and a wealth of third-party resources. Visualize Free has fewer community resources by comparison.
- Intended audience: Tableau Public targets public storytellers, journalists, students and portfolio-builders. Visualize Free targets users needing a simple, private way to visualize spreadsheet data quickly and cheaply.
Use-case recommendations
Choose Visualize Free when:
- Dashboards and data must remain private or be shared with a limited audience.
- The workflow is spreadsheet-first and simplicity is more important than advanced analytics features.
- Small teams require quick internal dashboards without investing in enterprise tools.
Gotchas and warnings
- Public exposure risk with Tableau Public: Publishing confidential or sensitive data to Tableau Public will make that data accessible to anyone. Double-check every workbook and data connection before publishing.
- Unclear free-tier limits: Both free tools sometimes omit clear, precise limits for uploads, rows, or concurrency. Expect to test with real datasets to validate performance and capacity.
- Shared resource variability: Visualize Free runs on shared cloud resources; performance and availability may vary compared to dedicated, paid deployments.
- Licensing and permitted use: Confirm that the chosen free tool’s license aligns with the intended use—commercial usage, academic projects, and public sharing each have different practical and legal implications.
Recommendation
For users needing private, internal dashboards from spreadsheets with a low barrier to entry and the ability to share selectively, Visualize Free is recommended because of its privacy-friendly sharing model and simplicity.
Next steps and practical checklist before choosing
- Identify whether data must remain private or can be published publicly.
- Test each tool with a representative dataset to evaluate performance and usability.
- Confirm legal/licensing constraints for the intended use (commercial vs non-commercial).
- Map out expected growth: number of users, dataset size, need for live connectors—this determines whether an upgrade to a paid edition will be required soon.
- If skill portability and community resources are important, plan for Tableau Public; if privacy and simplicity are critical, plan for Visualize Free.


