Enterprise Resource Planning Dashboards
What Is an ERP Dashboard?
An ERP dashboard is a centralized visual interface that displays real-time and historical data from multiple ERP modules such as finance, inventory, procurement, manufacturing, supply chain, sales, and human resources. It provides a unified view of organizational performance by transforming raw ERP data into charts, KPIs, scorecards, and trend summaries.
The purpose of an ERP dashboard is to help decision-makers monitor operations, identify issues quickly, and understand how different parts of the business are performing. ERP dashboards consolidate information from complex systems into a single, easy-to-read workspace that supports faster and more informed decision-making.

Core Functions
- Visualize key performance indicators across ERP modules
- Monitor real-time operational activity
- Highlight trends, variances, and exceptions
- Provide drill-downs into detailed ERP records
- Support role-based access for executives, managers, and analysts
Why ERP Dashboards Matter
ERP dashboards reduce the time required to interpret complex data, improve cross-department visibility, and help organizations respond quickly to operational changes. They are essential for modern businesses that rely on integrated ERP systems to manage daily operations.
ERP Dashboard Examples
ERP dashboards vary widely depending on the department, industry, and operational needs. Below are examples of common ERP dashboards and the insights they provide.
Finance Dashboard
A finance dashboard summarizes financial performance using metrics such as cash flow, revenue, expenses, accounts receivable aging, accounts payable cycle time, and budget variance. It helps CFOs and finance teams monitor financial health and identify trends in profitability and spending.
Inventory Dashboard
An inventory dashboard tracks stock levels, inventory turnover, stockouts, overstock conditions, carrying costs, and warehouse performance. It helps supply chain and operations teams maintain optimal inventory levels and reduce storage costs.
Procurement Dashboard
A procurement dashboard displays purchase order cycle time, supplier performance, contract compliance, cost savings, and open requisitions. It helps procurement teams evaluate supplier reliability and streamline purchasing processes.
Manufacturing Dashboard
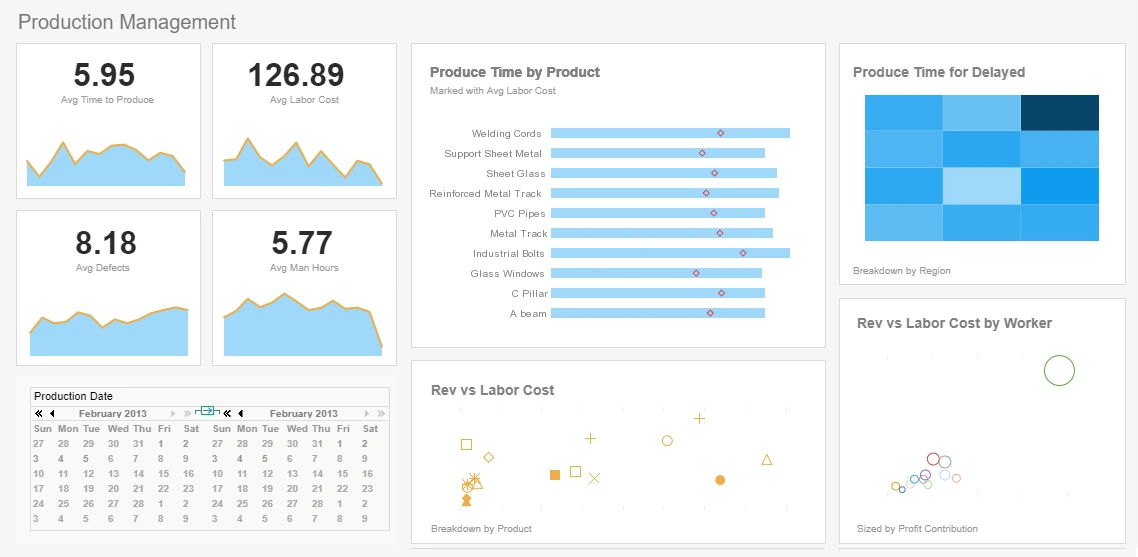
A manufacturing dashboard monitors production volume, machine utilization, downtime, scrap rate, quality defects, and overall equipment effectiveness. It helps plant managers improve efficiency and reduce waste.
Supply Chain Dashboard
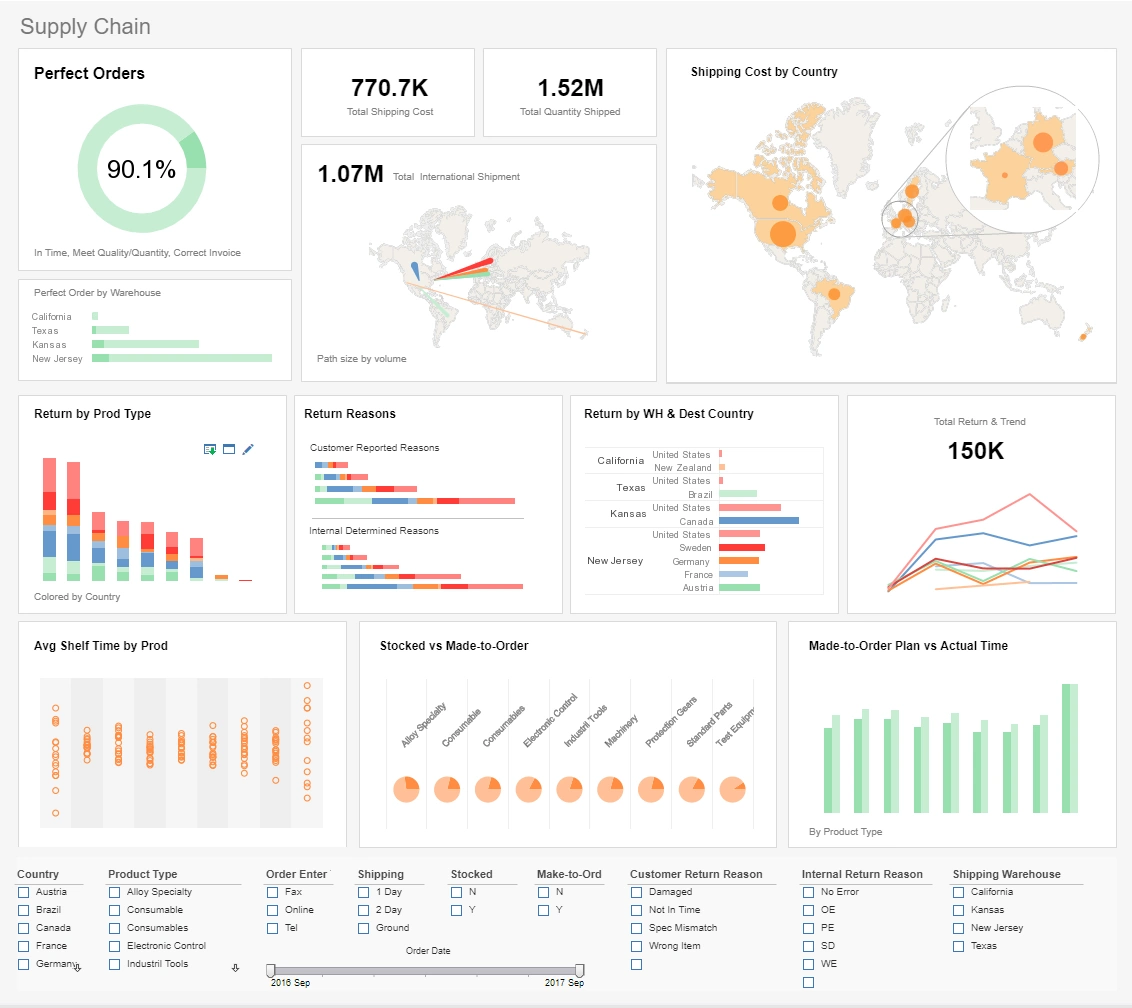
A supply chain dashboard shows on-time delivery rate, lead time, logistics cost, shipment status, and fulfillment accuracy. It helps operations teams identify bottlenecks and improve delivery performance.
Sales and Order Management Dashboard
A sales dashboard tracks order volume, sales pipeline, revenue by product, customer segments, and fulfillment status. It helps sales and operations teams understand demand patterns and improve customer satisfaction.
HR Dashboard
An HR dashboard summarizes headcount, turnover rate, training hours, open positions, and employee performance metrics. It helps HR leaders monitor workforce trends and support talent management.
Executive Dashboard
An executive dashboard provides a high-level view of financial performance, operational efficiency, supply chain stability, sales trends, and workforce metrics. It helps leadership teams make strategic decisions based on consolidated ERP data.

ERP Dashboard Features
An effective ERP dashboard provides a unified, real-time view of business operations by combining data from multiple ERP modules. The features below represent the core capabilities organizations expect from a modern ERP dashboard.
Real-Time Data Monitoring
ERP dashboards display continuously updated information from finance, inventory, manufacturing, procurement, and other modules. Real-time visibility helps teams respond quickly to operational changes and emerging issues.
Customizable Widgets and Layouts
Users can personalize dashboards by selecting KPIs, charts, and metrics relevant to their role. Custom layouts ensure that executives, managers, and analysts see the information most important to their responsibilities.
Drill-Down and Detail Exploration
Dashboards allow users to click into charts or KPIs to view underlying ERP records such as transactions, orders, inventory movements, or production logs. This supports deeper analysis without leaving the dashboard.
Alerts and Threshold Notifications
ERP dashboards can highlight exceptions such as low inventory, overdue invoices, missed delivery dates, or rising production defects. Alerts help teams take corrective action before issues escalate.
Cross-Module Integration
Dashboards combine data from multiple ERP modules to provide a complete operational picture. For example, a supply chain dashboard may include inventory levels, procurement lead times, and delivery performance in one view.
Role-Based Access and Security
ERP dashboards support secure access controls so users only see data relevant to their role. Executives may view organization-wide KPIs, while department managers see module-specific metrics.
Mobile and Remote Access
Modern ERP dashboards are accessible on desktops, tablets, and mobile devices, enabling managers and executives to monitor performance from any location.
Historical Trend Analysis
Dashboards include time-series charts that show how KPIs change over days, weeks, months, or years. Trend analysis helps organizations identify patterns and evaluate long-term performance.
Data Export and Reporting
ERP dashboards support exporting charts, KPIs, and summaries for reporting, presentations, or compliance documentation. This helps teams share insights across departments.
InetSoft's Mashup Spans More Data
ERP system deployments, while not only costly, can also create significant waves during the inception process. Typically this involves extensive business process analysis, creation of new work procedures, and even complete employee retraining. Poor understanding on any of these fronts can lead to a very expensive project failure.
StyleBI by InetSoft is a fully featured BI solution for your business. The dashboards you can create serve as a perfect alternative to traditional ERP systems, monitoring your entire Self-service analytics reduce IT support cost.
These dashboards can be fully customized to mirror the steady look and feel of your business. They are created with full access to as many or as few databases as desired and, as such, update in real time to display the health of your business in the most up-to-date manner possible.
Better Analytics for ERP Systems
StyleBI features a powerful data mashup engine for the creation of dashboards, visual analyses, and reporting. The unified, easy-to-deploy, easy-to-use business intelligence solution maximizes self-service and serves both enterprises and solution providers.
InetSoft's BI software leverages a powerful patent-pending Data Block foundation for real-time data mashup and presents information through interactive dashboards, enterprise reporting, scorecards, and exception alerts.
In contrast to other business intelligence applications that provide only reporting, or only dashboards, or require an intermediate data access layer, InetSoft's business intelligence system is complete. It includes analytics software and sophisticated reporting capabilities plus direct access to almost any data source.
The small footprint, SOA and Java architecture delivers an embedding and integration ready platform that delivers analytic business intelligence within business processes. Scalability for massive concurrency and big data applications is achieved with a unique approach to in-memory database technology that flexibly optimizes the use memory and disk across a server cluster.
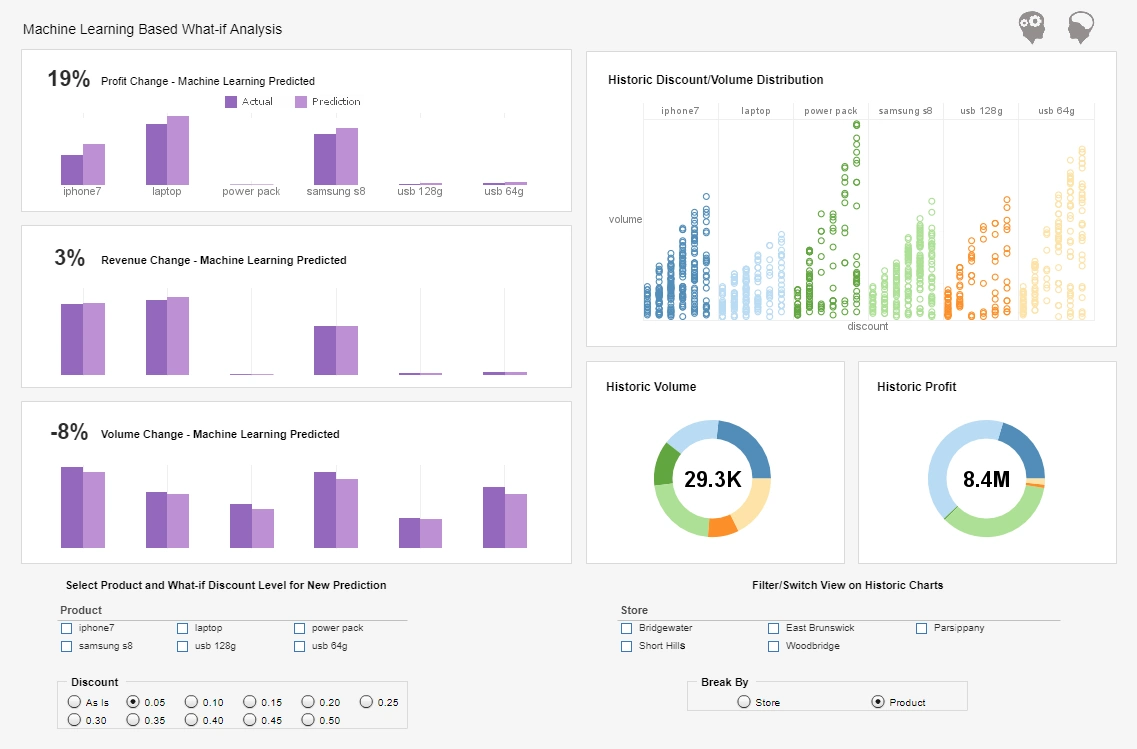
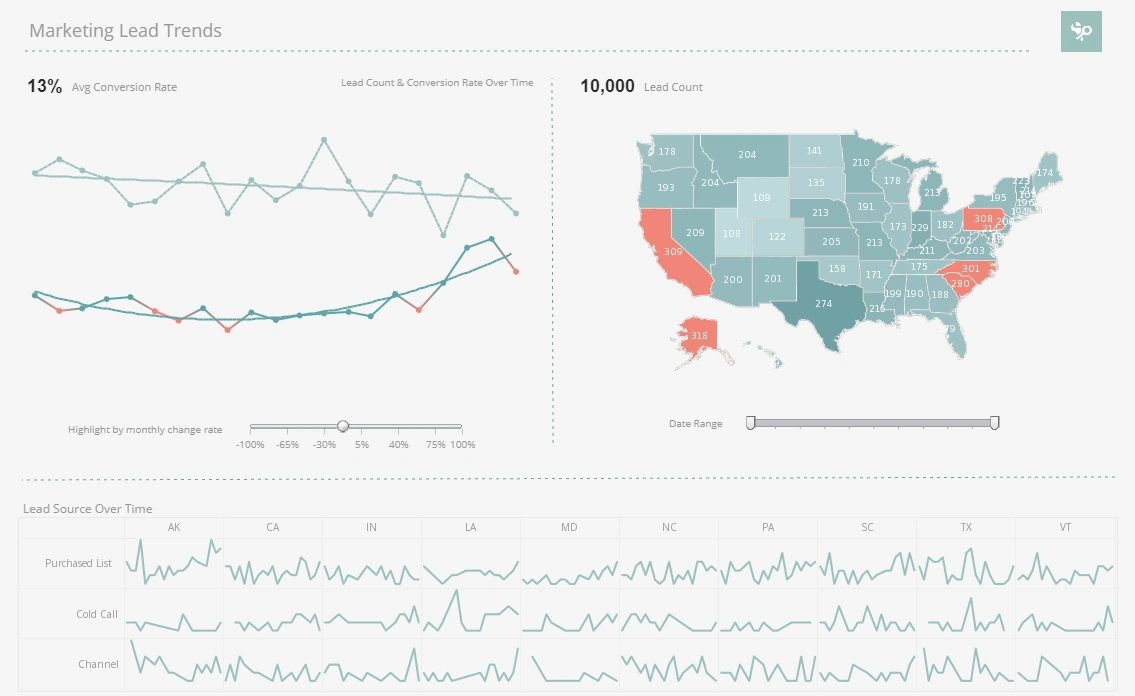
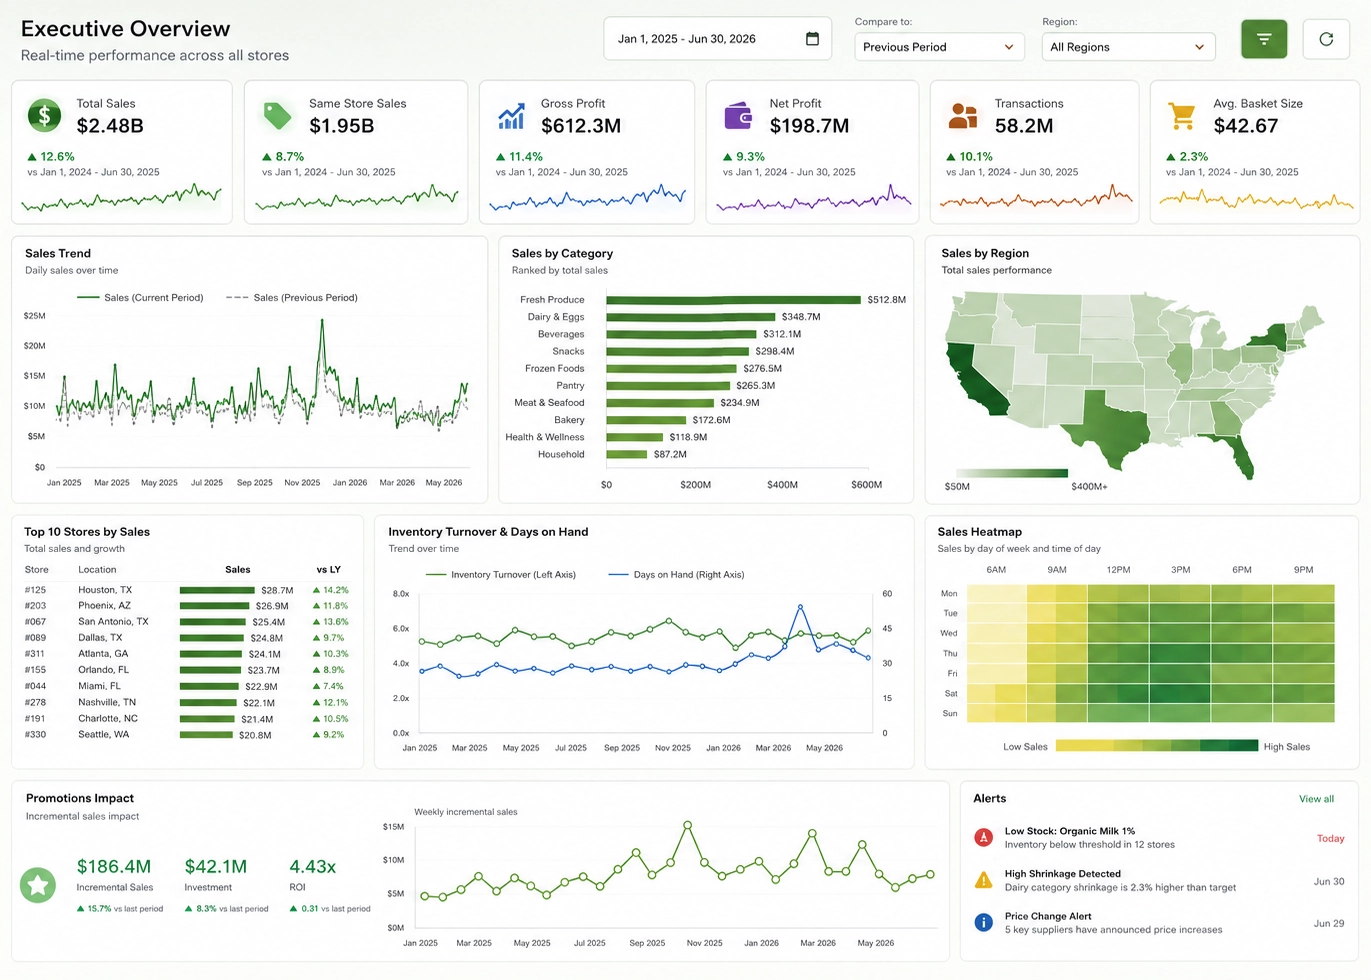
From Aisles to Insights: How MeadowFresh Grocers Built an ERP Dashboard with InetSoft's Open Source Tool
In the heart of the Midwest, MeadowFresh Grocers had long been a staple of small-town life. Known for their locally sourced produce, community-focused service, and modest charm, the chain had grown steadily since its humble beginnings in 1978. By 2022, MeadowFresh boasted 37 locations across five states and had begun to feel the growing pains of success. Inventory inconsistencies, procurement delays, and scattered sales reporting were starting to undercut the efficiencies that had once defined the company.
The problem wasn't with people—it was with the data. MeadowFresh's operations team was buried under siloed spreadsheets, outdated procurement software, and a Frankenstein-like network of legacy tools that barely spoke to each other. The lack of an integrated view of the business was stifling agility and decision-making. That's when Emma Calderon, MeadowFresh's newly hired Director of IT Transformation, proposed a bold but pragmatic initiative: build a centralized ERP dashboard using InetSoft's open source dashboarding tool.

Why InetSoft?
Emma was no stranger to the market. With a decade of experience modernizing supply chain systems, she had evaluated everything from Tableau and Power BI to Looker and Qlik. But InetSoft's open source solution offered something different. It wasn't just a pretty front-end. It was a true data mashup engine with the power to blend disparate data sources—on-prem databases, cloud services, flat files, APIs—into one coherent, real-time view. And it didn't come with the steep licensing fees or proprietary restrictions that often cripple lean IT budgets.
"InetSoft gave us the bones of a highly customizable analytics framework," Emma said. "But more importantly, it gave us the flexibility to build exactly what we needed—an ERP-style control center that didn't cost us a fortune."
Laying the Groundwork
Emma assembled a cross-functional team: a business analyst from procurement, a store manager from the flagship location, two back-end developers, and a data architect familiar with their legacy systems. The first challenge was data integration.
MeadowFresh's core data lived in multiple places:
- Inventory records were in a clunky SQL Server 2008 database.
- Sales data was logged daily via Excel exports from each store's POS system.
- Procurement ran through a 3rd-party vendor platform with limited API access.
- HR data sat in a cloud-based SaaS tool.
- And store feedback, from customer satisfaction to delivery times, came in via online forms.
The team used InetSoft's Data Block technology to create reusable data transformation components. Each data source was connected, cleaned, and standardized within InetSoft's mashup layer. Rather than migrating data into a centralized warehouse—a costly and time-consuming approach—they relied on InetSoft's federated data strategy. This meant real-time access without duplication or heavy ETL workloads.
"It felt like flipping a switch," said Jamal, one of the developers. "We connected our SQL inventory system and saw it light up on the dashboard in minutes. The platform handled complex joins, filters, and transformations better than we expected."
Building the Dashboard: Form Meets Function
With the data flowing, the team turned their attention to the ERP dashboard itself. They envisioned a single control panel that could serve both strategic and operational needs—real-time visibility for execs and drill-down detail for store-level managers.
They divided the dashboard into four primary modules:
- Inventory Control
A live heatmap displayed stock levels across all 37 locations. Color coding highlighted understocked or overstocked items, while line charts tracked restocking cycles. By integrating supplier lead times from the procurement system, they even built a predictive restock alert system. - Sales & Revenue
This module included daily, weekly, and monthly KPIs, breaking down sales by region, category, and even time-of-day. A filterable map showed performance per store, and anomaly detection logic flagged dips in sales that could indicate local issues (weather, staffing, supply disruptions). - Procurement Analytics
By combining procurement costs with inventory turnover, the dashboard calculated real-time gross margin per product category. This allowed the merchandising team to see not just what was selling, but what was profitable. Supplier performance metrics were also built in—on-time deliveries, average costs, and SLA compliance. - Workforce Metrics
Integrated with the cloud-based HR platform, this tab showed staffing levels, turnover rates, and training completion per location. It helped HR managers identify where labor shortages might intersect with operational needs.
Store Managers as Data Citizens
A critical success factor was user adoption. Rather than keeping the dashboard exclusive to HQ, Emma pushed to train store managers on how to use it for their own day-to-day decision-making. Thanks to InetSoft's responsive, web-based UI and customizable access controls, managers could log in and see only the data relevant to their location.
Carol, the store manager in Davenport, became an early advocate. "For the first time, I could see how yesterday's sales compared to the same day last year, track which items were moving, and even anticipate when to reorder—all from one screen. No more juggling three different reports."
Agile Enhancements and Open Source Power
One of the most appealing aspects of using InetSoft's open source version was the freedom to customize. MeadowFresh's developers built custom modules for internal alerts, such as sudden price surges in produce or labor cost overruns. They also leveraged the tool's REST APIs to trigger Slack alerts and automated emails when certain thresholds were hit.
Emma's team committed to bi-weekly sprints, treating the dashboard like a living product. This agile mindset helped them respond quickly to business needs—adding new supplier performance metrics one week, rolling out a seasonal forecasting module the next.
Results That Matter
Within six months, the results were tangible:
- Stockouts dropped by 34%, especially for fast-moving dairy and produce items.
- Inventory carrying costs decreased by 18%, as better forecasting led to leaner ordering.
- Gross margins improved by 6%, driven by smarter procurement and reduced waste.
- Store managers reported a 25% improvement in operational efficiency, based on self-reported time savings and improved decision quality.
But perhaps most importantly, the ERP dashboard became a shared source of truth—a unified lens through which finance, operations, HR, and procurement could collaborate.

The Road Ahead
Emma's team is now exploring how machine learning models could plug into InetSoft's mashup layer for demand forecasting and price elasticity analysis. They're also considering sharing sanitized dashboard views with suppliers to improve transparency and alignment.
For a regional grocery chain like MeadowFresh, the leap to a real-time ERP dashboard wasn't just about tech—it was about empowerment. By using InetSoft's open source tool, they didn't just build a dashboard. They built a culture of data-driven agility, one that might just define the next chapter of their story.
ERP Dashboard FAQs
What is an ERP dashboard?
An ERP dashboard is a visual interface that displays real-time and historical data from multiple ERP modules. It helps organizations monitor performance, identify issues, and make informed decisions based on consolidated information.
What data does an ERP dashboard use?
ERP dashboards use data from finance, inventory, procurement, manufacturing, supply chain, sales, and human resources. This data is pulled directly from the ERP system and updated continuously.
Who uses ERP dashboards?
ERP dashboards are used by executives, department managers, analysts, plant supervisors, supply chain teams, finance teams, and HR leaders. Each role views KPIs relevant to their responsibilities.
What are the benefits of an ERP dashboard?
Benefits include real-time visibility, faster decision-making, improved operational efficiency, reduced manual reporting, better cross-department alignment, and early detection of issues.
Can ERP dashboards show real-time data?
Yes. ERP dashboards can refresh continuously, providing up-to-date information on inventory levels, production output, financial metrics, procurement activity, and more.
What KPIs are commonly shown on ERP dashboards?
Common KPIs include cash flow, inventory turnover, production volume, downtime, supplier performance, on-time delivery rate, sales revenue, order fulfillment accuracy, and workforce metrics.
How do ERP dashboards improve decision-making?
ERP dashboards consolidate complex data into clear visual summaries, making it easier for leaders to identify trends, spot issues, and take action quickly. They reduce reliance on manual reports and provide a single source of truth.
Are ERP dashboards customizable?
Yes. Users can customize dashboards by selecting KPIs, charts, modules, and layouts that match their role and responsibilities. Customization ensures each user sees the most relevant information.
Do ERP dashboards support drill-downs?
Most ERP dashboards allow users to drill down into detailed records such as transactions, orders, inventory movements, or production logs. This helps teams investigate issues without switching systems.
Can ERP dashboards be accessed on mobile devices?
Yes. Modern ERP dashboards are designed for desktop, tablet, and mobile use, enabling managers and executives to monitor operations from anywhere.