Constant Contact Email Engagement Intelligence Dashboard
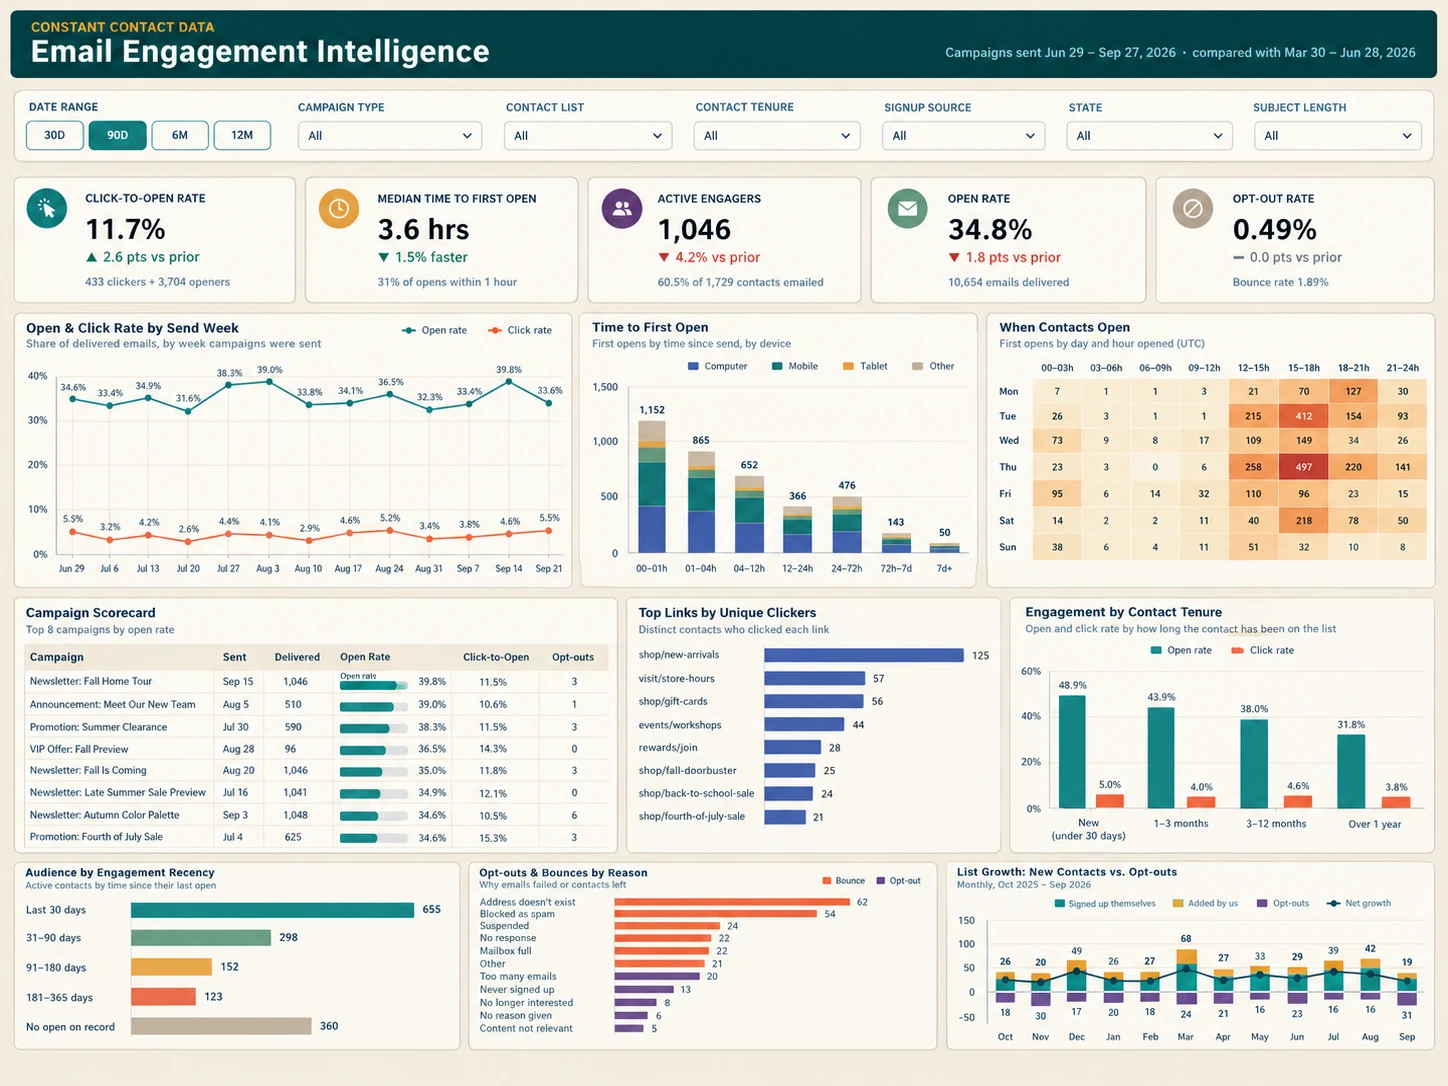
A Constant Contact Email Engagement Intelligence Dashboard provides marketing teams with a comprehensive view of how subscribers interact with email campaigns. While traditional email reports often focus on opens and clicks, this dashboard goes much further by helping marketers understand engagement behavior, audience quality, campaign effectiveness, and list growth trends. By consolidating key metrics into a single interface, organizations can quickly identify opportunities to improve email performance and strengthen customer relationships.
The dashboard is designed for marketing managers, digital marketers, business owners, and analysts who need actionable insights from Constant Contact campaigns. With filters for date range, campaign type, contact list, contact tenure, signup source, geographic location, and subject length, users can explore performance from multiple perspectives and identify patterns that drive engagement.

Email Engagement KPIs
At the top of the dashboard are several key performance indicators that provide a snapshot of email marketing health. Metrics include Click-to-Open Rate, Median Time to First Open, Active Engagers, Open Rate, and Opt-Out Rate. These measurements allow users to evaluate campaign performance immediately without reviewing individual reports.
The Open Rate measures how many recipients opened an email after it was delivered. This metric helps organizations evaluate subject line effectiveness and brand recognition. The Click-to-Open Rate focuses on subscribers who opened an email and then clicked a link, making it a stronger indicator of content quality and message relevance.
The Median Time to First Open reveals how quickly subscribers engage after receiving an email. Faster response times often indicate a highly engaged audience. Active Engagers measures the number of subscribers who consistently interact with campaigns and can serve as a leading indicator of future conversions and customer loyalty.
The Opt-Out Rate helps marketers monitor subscriber retention and audience satisfaction. A rising unsubscribe rate may suggest that email frequency, content quality, or targeting strategies need adjustment.
Open and Click Rate Trends
The Open and Click Rate by Send Week chart tracks engagement performance over time. This visualization allows marketing teams to monitor fluctuations in audience behavior and identify patterns across multiple campaign cycles.
By comparing open rates and click rates across different weeks, marketers can determine which campaigns generated the strongest engagement. Sudden increases may be connected to seasonal promotions, new product launches, or highly relevant content. Declines in engagement may signal subscriber fatigue, less effective messaging, or changes in audience preferences.
Trend analysis transforms raw campaign data into meaningful business intelligence by helping organizations understand not only what happened, but why performance changed over time.

Time to First Open Analysis
One of the unique features of this dashboard is the Time to First Open analysis. This visualization categorizes email opens based on the amount of time that passes between delivery and initial engagement. Results are further segmented by device type, including desktop computers, mobile devices, tablets, and other viewing platforms.
Understanding when subscribers open emails helps marketers optimize delivery schedules and plan future campaigns. If the majority of opens occur within the first few hours, organizations can focus on maximizing visibility during that critical engagement window.
Device-level analysis also reveals how subscribers consume email content. This information can be used to improve responsive design and ensure that campaigns display properly across all screen sizes.
When Contacts Open Emails
The heat map showing when contacts open emails provides deeper insight into engagement timing. The visualization displays open activity by day of week and time of day, making it easy to identify peak engagement periods.
Many organizations discover that open rates vary significantly depending on timing. Certain audiences may engage most heavily during business hours, while others respond better during evenings or weekends. Using this information, marketers can improve campaign scheduling and increase the likelihood of subscriber interaction.
Data-driven scheduling often leads to higher engagement without increasing marketing costs or expanding campaign volume.

Campaign Performance Scorecard
The Campaign Scorecard ranks individual email campaigns based on engagement metrics. Marketing teams can compare delivery volume, open rate, click-to-open rate, and unsubscribe activity across multiple campaigns.
This section helps marketers identify top-performing campaigns and uncover best practices that can be replicated in future initiatives. High-performing subject lines, content formats, and promotional strategies become easier to recognize when campaign data is presented side by side.
The scorecard also highlights underperforming campaigns that may require further analysis. Reviewing both successful and unsuccessful campaigns helps organizations continuously refine their email marketing strategies.
Top Links by Unique Clickers
The Top Links visualization reveals which destinations receive the highest level of engagement. Popular product pages, events, promotional offers, educational resources, and signup forms can all be measured according to unique clicks.
Link performance provides valuable insight into subscriber interests and buying intent. If certain categories consistently receive more engagement, marketers can create additional content around those topics. Product teams can also use this information to identify customer preferences and prioritize offerings.
Understanding what captures audience attention allows organizations to align future campaigns with actual subscriber behavior.

Engagement by Contact Tenure
Not all subscribers engage with emails in the same way. The Engagement by Contact Tenure chart compares open and click performance based on how long a contact has been on the mailing list.
New subscribers frequently demonstrate higher engagement because they recently expressed interest in the organization. Over time, engagement may decline as subscribers become less active. Monitoring contact tenure helps marketers understand the subscriber lifecycle and develop retention strategies.
Organizations can use these insights to create onboarding programs, re-engagement campaigns, and loyalty initiatives that keep subscribers active over longer periods.
Audience Engagement Recency
The Audience by Engagement Recency section categorizes subscribers based on the timing of their most recent interaction. Active subscribers can be compared with contacts who have not opened an email for several months.
This analysis helps marketers identify dormant subscribers before they become completely inactive. Re-engagement campaigns can then be designed specifically for these groups to restore participation and improve overall list quality.
Managing engagement recency is essential for maintaining strong deliverability and ensuring that email lists remain focused on interested recipients.

Opt-Out and Bounce Analysis
The dashboard also tracks the primary reasons emails fail to reach or retain subscribers. Common causes include address errors, blocked messages, mailbox issues, spam complaints, and subscriber opt-outs.
Understanding the reasons behind delivery failures helps marketing teams improve data quality and maintain sender reputation. Regular analysis of bounce and unsubscribe patterns supports healthier email programs and higher long-term deliverability rates.
List Growth Performance
List Growth reporting compares new subscriber acquisition against opt-outs over time. The dashboard tracks contacts who signed up independently, were added through campaigns, or were acquired through various signup sources.
Healthy list growth is one of the strongest indicators of a successful email marketing strategy. Comparing subscriber acquisition with subscriber loss helps organizations determine whether growth initiatives are generating meaningful results.
Monitoring net growth also supports forecasting efforts by providing a clearer understanding of future audience reach and engagement potential.

Business Value of a Constant Contact Engagement Dashboard
A Constant Contact Email Engagement Intelligence Dashboard transforms email activity into actionable business insights. By combining engagement metrics, timing analysis, campaign performance, audience behavior, list growth, and deliverability monitoring in a single reporting environment, organizations gain a complete understanding of subscriber interactions.
Marketing leaders can use these insights to improve campaign targeting, optimize send times, strengthen audience retention, and increase engagement rates. The result is a more effective email marketing strategy that generates stronger customer relationships, higher conversion rates, and greater return on marketing investment.