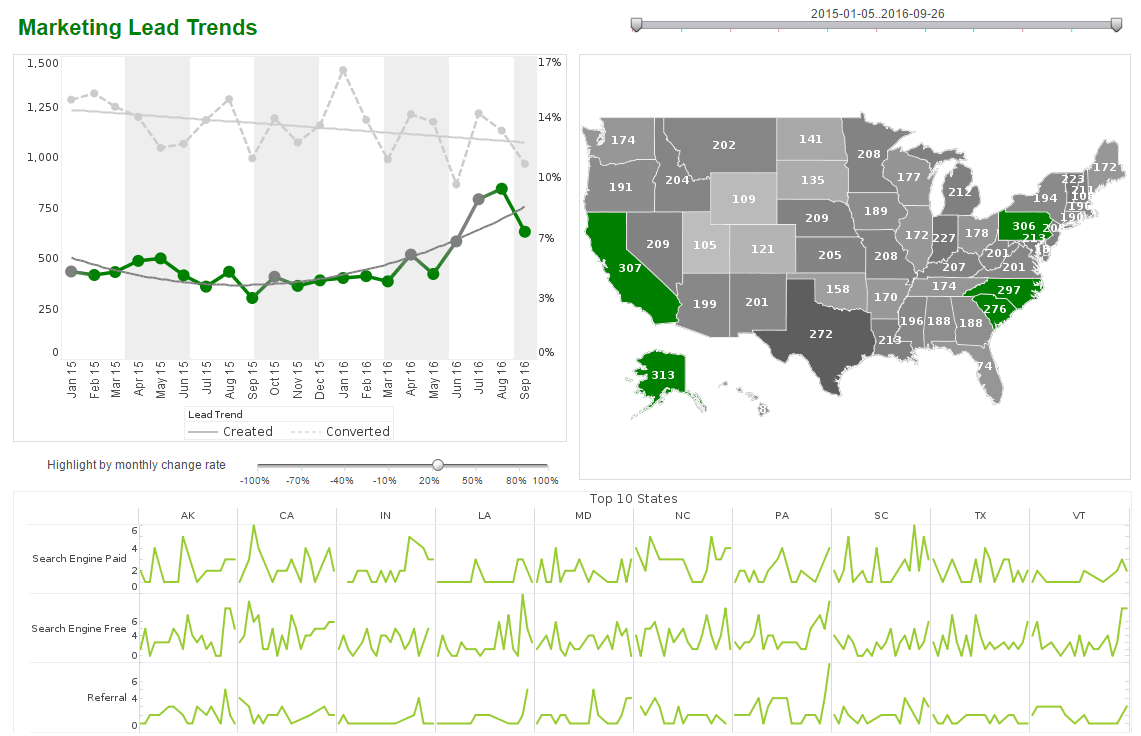
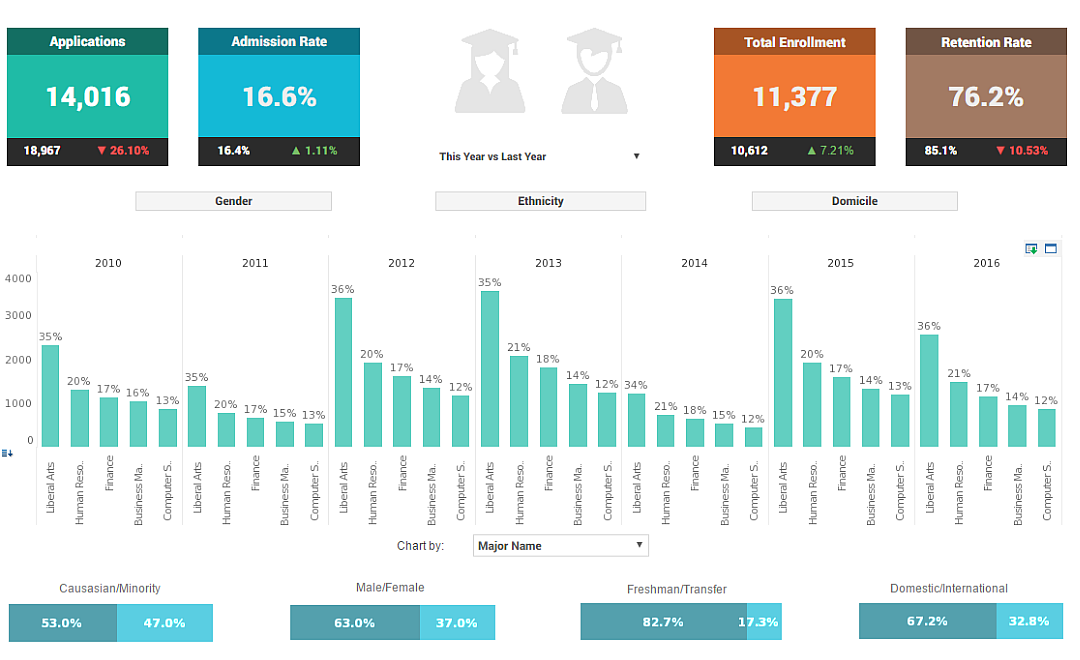
About InetSoft's Dashboard Features
This is a listing of articles about features and benefits of InetSoft's dashboard software that is part of StyleBI, the company's BI platform, or StyleBI, the stand-alone dashboard software product:
Eli Manning Sports Stats Dashboard - Are you someone who likes to explore and/or explain sports stats with graphs or excel docs? What if you could make and share interactive dashboards of sports stats, for free? To the right is a dashboard of Eli Manning's careers stats, built by a dedicated fan using visualizefree.com. Click on the screenshot to open the dashboard in another tab and explore Eli Mannings stats over the past 5 years. All of the charts on this dashboard display individual Giants games, using a dot or triangle to represent each game. The large line graph on the dashboard allows you to see Eli Manning's passing statistics on a game by game basis...
Embeddable Dashboard Solutions - The award-winning InetSoft dashboard software application offers embeddable dashboard solutions that lead to high end user adoption and significant increases in productivity. To convert a regular Data Table to an embedded table, follow these steps: 1. In the table title bar, click the 'Show Live Data' button. This will populate the table with data. 2. Right-click the title bar of the table, and select 'Convert to embedded Table'. This creates a new table with the name of 'Query'. Once the table is converted into an embedded table, it cannot be reverted back to a regular table. In the following example, the 'Sales by Category' query is converted to an editable embedded table. 1. Create a new Worksheet by clicking on the 'New Worksheet' button. 2. Expand the 'Query' node, and then the 'Orders' node. 3. Drag the 'Sales by Category' node from the tree to an empty cell in the Worksheet. A new table named 'Sales by Category1' is created. 4. Expand the table vertically so that it occupies a total of 11 rows in the Worksheet...
 |
Click this screenshot to view a two-minute demo and get an overview of what
InetSoft’s BI dashboard reporting software, StyleBI, can do and how easy it is to
use.
|
Email Dashboard Application for SparkPost - Looking for a good dashboard application for SparkPost? InetSoft's pioneering BI application produces great-looking cloud-based dashboards with an easy-to-use drag-and-drop design tool. Mash up your email and SMS delivery data with other enterprise sources for a comprehensive view of marketing program performance. View a demo and try interactive examples...
Embeddable Dashboarding Software - InetSoft's embeddable dashboarding software tools allow simple views of large and complex data. To pass inputs from a Viewsheet to the underlying Worksheet, the Worksheet must contain an Embedded Table. Follow the steps below to add and configure the Embedded Table in the Worksheet. 1. In the Worksheet, click the ‘New Object’ button in the toolbar, and select the ‘Embedded Table’ option. The pointer changes to a crosshair. 2. Drag the mouse across the Worksheet grid to create the new Embedded Table. Create as many rows and columns as needed for the application. 3. Right-click the Embedded Table, and select ‘Properties’ from the context menu. This opens the ‘Properties’ dialog box. 4. In the ‘Name’ field, enter a name for the Embedded Table. This is the name by which you will identify the table in the Viewsheet...
Embedded Dashboard - A listing of the features and benefits that InetSoft's dashboard application can provide an ISV or SaaS provider looking to embed dashboards in their application, for instance, a high level of interactivity and self-service for new dashboard creation. It offers a solution provider's development team: * A solution than can scale from small to large numbers of users * Flexibility to adapt to changing data structures or information needs * Ability to mash up disparate data sources...
Embedded Dashboard Commands - The embedded dashboard commands available in InetSoft's award-winning dashboard software application allow for the highest level of customization available on the market. To add a new row to an embedded table, follow these steps: 1. Deselect the table. (Click the Viewsheet grid away from the table.) 2. Right-click a table row, and choose 'Insert Row' from the context menu. This inserts a blank row above the row you clicked. To remove an existing row from an embedded table, follow these steps: 1. Deselect the table. (Click the Viewsheet grid away from the table.) 2. Right-click on the table row you want to delete, and choose 'Remove Row' from the context menu. This removes the row you clicked, and shifts subsequent rows upward in the table. An expression column, or formula column, is a column whose data is generated from a script (expression) by processing existing data in the table. The expression can use either SQL or JavaScript syntax, and can reference any other columns within the Data Table. To add an expression column to a table, follow these steps...
| #1 Ranking: Read how InetSoft was rated #1 for user adoption in G2's user survey-based index | Read More |
Embedded Dashboard Options - InetSoft's award-winning dashboard software application offers an expansive list of embeddable dashboard options that provide users with more reporting options than are typically found in most business intelligence solutions. You can expand an existing table in the Data Worksheet by adding additional columns. This allows you to gather data from multiple entities into a single table. You can also create new columns that contain complex calculations. This section discusses various methods for adding table columns. To add a new column to a regular table in the Worksheet (from the same query or data model), follow these steps: 1. In the asset tree, select the query column or a model attribute that you want to add to the existing table. 2. Drag the query column or model attribute over the column header row in the existing table. (A green bar shows the location in the table where the new column will be placed.) 3. Drop the column into the table at the desired location...
| Previous: Articles About a Gauge Chart Generator |


