InetSoft's Data Mashup Platform: Features and Benefits
InetSoft's data mashup platform is built on the principle of agile data integration, enabling organizations to rapidly combine data from diverse sources without extensive ETL or data warehouse redesigns.
The platform supports live connections to multiple data sources, cached data blocks for performance optimization, and interactive blending directly within the business intelligence workflow.
Users can connect effortlessly to structured databases, APIs, cloud services, spreadsheets, and unstructured data sources, allowing business analysts and data professionals to prototype transformations in real time and validate insights quickly without waiting for IT infrastructure changes.
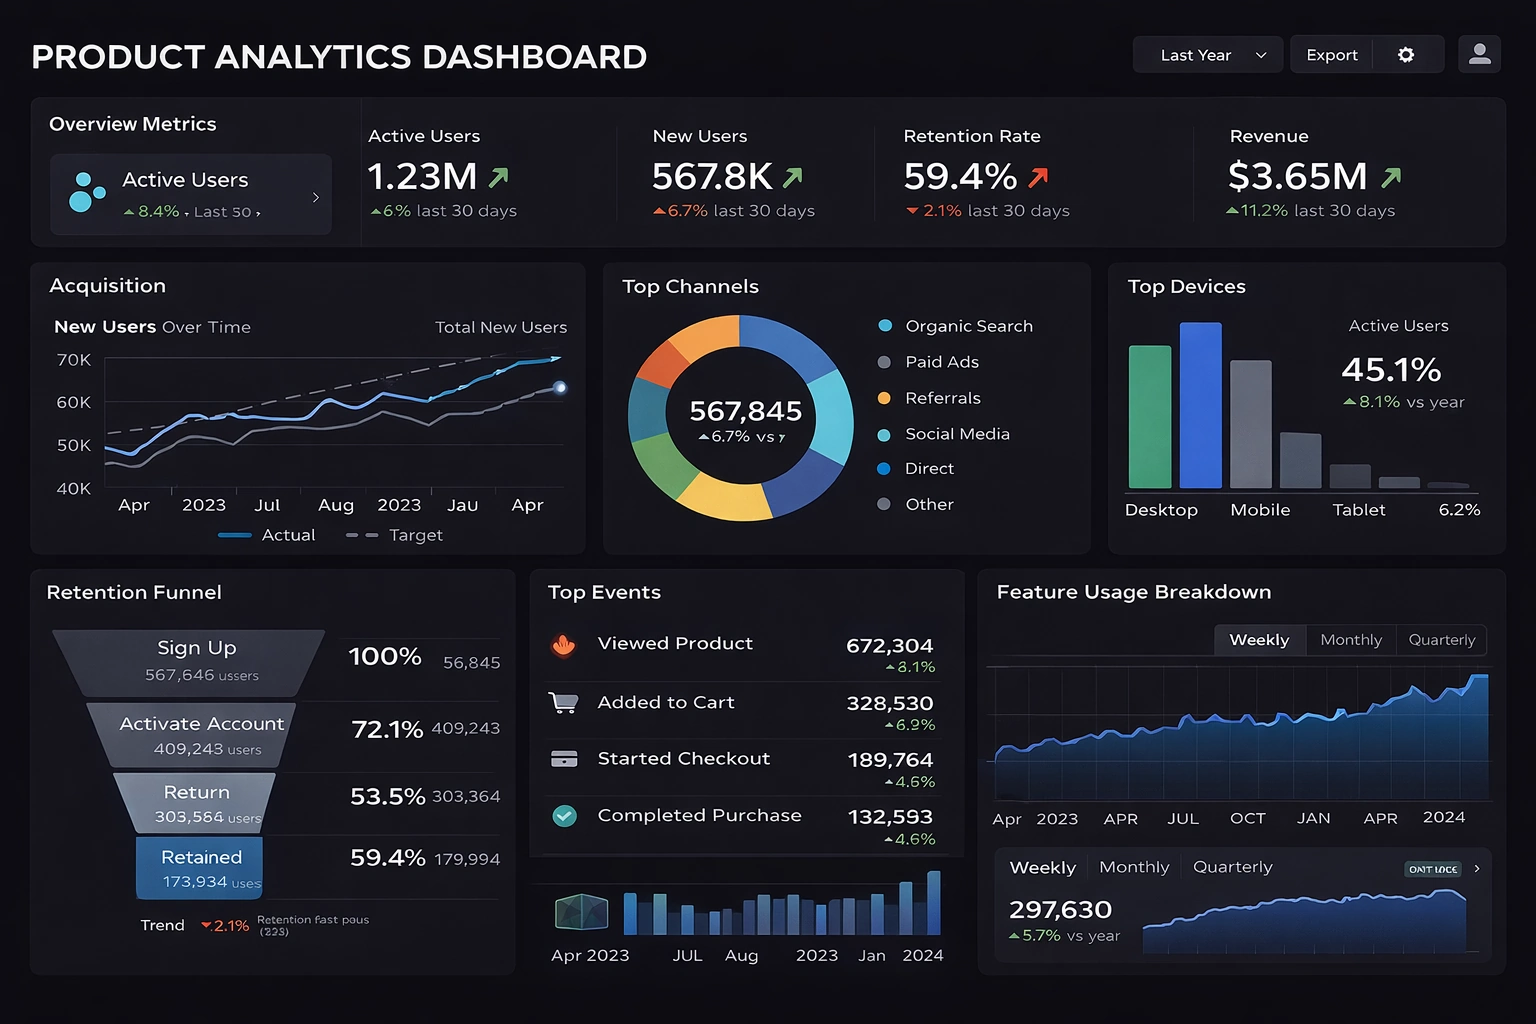
InetSoft's data mashup platform is built on the principle of agile data integration, enabling organizations to rapidly combine data from diverse sources without extensive ETL or data warehouse redesigns. The platform supports live connections to multiple data sources, cached data blocks for performance optimization, and interactive blending directly within the business intelligence workflow. Users can connect effortlessly to structured databases, APIs, cloud services, spreadsheets, and unstructured data sources, allowing business analysts and data professionals to prototype transformations in real time and validate insights quickly without waiting for IT infrastructure changes.
A key strength of InetSoft's approach is its self-service mashup capability combined with IT governance and control. The lightweight designer enables users to join tables, perform data transformations, and choose between live queries or high-speed cached blocks without requiring SQL expertise. The platform includes a powerful data cleansing engine that operates in real time on live data sources, ensuring data quality while maintaining flexibility. Additionally, the Data Grid Cache technology allows users to work with datasets exceeding 67 million rows directly on their laptops or distributed clusters, eliminating traditional constraints of in-memory architecture and RAM limitations.
Organizations benefit from faster time-to-insight, reduced dependency on IT backlogs, and a hybrid model that balances self-service empowerment with centralized governance. By condensing dozens of static reports into single interactive multi-dimensional analytical views, InetSoft accelerates data analysis and enables users to sift through complex datasets that would otherwise require hundreds of clicks. The platform's web-based interface, drag-and-drop designer, and support for 73+ cloud data connectors make it accessible to business users while maintaining performance and security standards that IT departments require.
Data Mashup Feature Comparison: InetSoft vs. Competitors
| Feature | InetSoft | Tableau | Power BI | Domo |
|---|---|---|---|---|
| Live Data Connections | Yes - 73+ cloud sources | Yes - limited sources | Yes - extensive library | Yes - broad connectors |
| Self-Service Data Blending | Yes - interactive drag-drop | Limited - requires prep | Yes - Power Query | Yes - visual interface |
| Data Grid Cache Technology | Yes - distributed clusters | No - in-memory only | No - premium models | No |
| Real-Time Data Cleansing | Yes - integrated engine | Limited - separate tools | Limited - requiring DAX | Limited |
| No-Code Data Transformation | Yes - full capability | Partial - UI limited | Yes - Power Query | Yes - basic |
| Multi-Source Joins | Yes - unrestricted | Limited joins | Yes - with modeling | Yes - restricted |
| IT Governance Controls | Yes - role-based | Yes - enterprise grade | Yes - AAD integration | Yes - admin controls |
| Unstructured Data Support | Yes - native support | Limited | Limited | Limited |
Additional Articles About the Data Mashup Platform
This is a list of additional articeles about the data mashup platform that is included in InetSoft's business intelligence software for dashboards, reporting, and analytics, StyleBI:
Contrast with the Traditional ETL and Data Warehouse Only Model - There is a ton of useful information stored in enterprise databases and employees spreadsheets that's really important. And speed of making that data available is key. I mean in hours, not months. This is key to agile BI. This is in contrast with the traditional ETL and data warehouse only model. We are responding to data requirements. This old model takes months to put in place. This is sort of the technical side. In the next few minutes we will build on this. From the survey results. it looks like the majority of people are not currently implementing an agile BI program in their organizations, and I found that quite interesting. So this webinar should be really helpful to them, and now we are going to move forward and talk about what agile BI means. For a comprehensive definition, I would say agile business intelligence addresses the broad need to enable flexibility by accelerating the time it takes to deliver value. A key theme is, be flexible and fast, and again, using some of these scrum and extreme programming techniques can get you there...
Cultural Nuances in Data Visualization - Wayne Eckerson: Although, you know, visualization is a nuanced, cultural type of thing. For example, Guess an apparel design company that makes jeans and other things like that put out a dashboard that converted some tables to charts and graphics. They thought, Well, this will be good. Users will like this much more than the tables....
Cube of Data in Server Memory - Yeah that’s interesting. Philip, have you come across that terminology, or that kind of thing recently? Philip Russom: Well, as you mentioned materialized views, that technology has been with us for decades, right? It's just that in its early incarnation, say in the mid 90s, it was kind of a limited technology, and especially performance was an issue. Refreshing the view, instantiating data into the view, it was kind of slow. Thank God these kind of speed bottlenecks have been cleared as the database vendors themselves have worked out virtual tables, or you have standalone vendors who are working on this obviously. Denodo and Composite have both made contributions there. So yeah, this new technology is something that a lot of us wanted in the 90’s. It just didn’t work very well, and luckily today it works pretty good. Ian Pestel: Each of user or even extending beyond these individual databases where you could even take a mess up across down resources, pulling feeds, pulling various databases together and then makes that as well so it's okay...
Customer-Facing Device Data Platform Challenge - Organizations increasingly rely on data generated by distributed networks of devices to deliver value to their customers. These devices, often owned and operated by customers themselves, periodically transmit structured records to a central platform. While individual devices may generate only modest volumes of data, the collective system must remain reliable, scalable, and secure as the network grows. In a typical scenario, an organization is tasked with designing a customer-facing data platform that meets core requirements. First, customers must be able to access their own raw device data in a secure and isolated manner. Second, the organization needs an analytics layer that supports validation, transformation, aggregation, and the possibility of more advanced analysis in the future. Third, customers require customer dashboards that present clear and intuitive analytics about their devices without requiring technical expertise. Importantly, this type of system does not always require real-time data processing. In many cases, refreshing data once per day is sufficient, shifting the focus away from low-latency streaming and toward correctness, reliability, and long-term maintainability. The real challenge lies not in handling massive scale, but in making thoughtful architectural decisions that avoid unnecessary complexity while still allowing room for growth...
Data Access Platform - Think of this data access platform as a very rapid platform for developing agile data access. So there are really three steps. We talked about a lot of diverse data, structured, unstructured, internal, and external. The first step is to connect and mash them up into something, a normalized view that we call a base view. The next step is to combine and integrate all of those different base views into derived views and in the process perform data matching, data quality, data transformation as well as data model transformation, and then finally publish those outputs as data services. So the platform corresponds to that idea of having a connect, a combine and a publish layer, a connect engine that has connectors to a wide range of data sources, a Web automation engine, an indexing engine that also converts indexes to inverted indexes, combines and transforms them and publishes them. I am going to touch on each one very briefly. But you will also notice that while that can all be done virtually, you can also cache, and you can schedule preloads of the data, and you can manage them at a all levels of data security...

Data Analysis Software Download - Are you looking download a data analysis application? Since 1996 InetSoft has been making BI software that is easy to set up and easy to use. Build self-service oriented dashboards and visual analyses quickly. View a 3-minute demo and download a free version...
Data Analysis Tools - In the context of business intelligence, data analysis ranges from simple summarizations to drill-into-detail visual data exploration. In some cases you’re answering a question. In other cases you’re projecting into the future. Therefore a good business intelligence solution is one that includes powerful, yet intuitive data analysis tools. InetSoft provides an innovative Web-based software application that produces brilliant visualizations of multidimensional data. Data analysis is sped up by condensing dozens of static reports into a single powerful interactive multi-dimensional analytical view, allowing users to sift through loads of data that otherwise might have taken dozens of clicks through dozens of static reports. InetSoft's Style Intelligence is easy to use, interactive BI software that leverages a powerful patent-pending Data Block that focuses on business data exploration by combining Data Block™ technology with visualization. Visual analyses are constructed in real-time by dropping data items into visual elements such as charts, metrics and selections. The resulting view reveals the intrinsic relationships among the data. InetSoft has been providing business intelligence software since 1996 and includes powerful, yet intuitive data analysis tools in its Web-based BI platform...

Data Analytics in the Insurance Industry - The first question to ask really is what do we mean by an analytical insurer. Personally we know that data and the use of data is not new in the insurance industry. In fact, we were using data in the form of MI 20 years ago, and we were putting in a spreadsheet and performing manual data analytics on it. We were able to actually use pivot tables. Things have moved on of course in those 20 years, and of course, nowadays we view the analytical insurer as an insurance company using analytics throughout the organization to improve business performance, with emphasis on the word throughout. Of course, many departments within the insurance business use some form of tactical analytics tools, such as for bidding claims or marketing or risk. Often those tactical analysis tools operate in silos, and the ability to exchange information between the different departments seems to be missing somehow. Really, the analytical insurer, by definition, has to have an enterprise wide view of the data and information available to them. Of course, never more has it been critical for an insurer to have an enterprise wide view than the current time. The slide in front of you reminds you that the insurance business really is quite an interconnected red fuse, for lack of a better expression. The issues of distribution, consumers both direct distribution and indirect through third parties and the emerging impact of Blockchain are factors. The customer is much more savvy, much more knowledgeable. The digital customer is becoming the norm, and of course, different customers behave in different ways...
Data Analytics Lessons from How Real Estate Agencies Operate - During the past few years, technologies like big data, data analytics, automation, and machine learning have been a hot topic across industries. In the real estate industry, in particular, data analytics has a lot of potential for streamlining processes, reducing costs, and increasing profits. However, the huge volume of data that real estate transactions require and generate daily can pose problems. These include difficulties in determining which data points are actually useful and how these can be utilized effectively. Below, we discuss some of the ways data analytics and data science, in general can be applied in real estate. Recruitment remains to be one of the most important components of growing a real estate agency. It also remains to be one of the most challenging, especially considering the competitiveness of the space and the amount of resources needed to hire a good agent...
Data Analytics in the Travel Industry - In today's world, where data is the most valuable asset, competent data analysis is an integral part of the development of any industry. Tourism is no exception. Analytics in tourism plays a key role in understanding and anticipating trends, ensuring high competitiveness, and effective strategic forecasting. Analytics provides data that impacts all aspects of the tourism business, from marketing and advertising to strategy selection and operational decision-making. With the help of analytical information, it is possible to better understand customer preferences and behavior, use resources efficiently, identify potential markets, and anticipate and prevent possible risks. Making the right strategic decisions and improving the quality of services in tourism is impossible without a quality analytical system with rapid information updates. example of a travel performance dashboard View more examples in the InetSoft gallery Moreover, analytics in tourism is necessary not only for managerial decisions but also for planning marketing campaigns and developing new products. It can be used to determine market share, select target audience, create personalized offers, analyze the effectiveness of advertising, and evaluate the impact of marketing activities. Modern technologies provide the ability to visualize, continuously monitor, and update data, which helps to direct attention to relevant changes and respond to them as effectively as possible...
Data Architecture as a Service? - Data governance might be hard to execute in a decentralized company. During the Enterprise Data World conference, two primary methodologies were presented: top-down and peer-based. Peer-based efforts, on the other hand, were shown to be more successful in decentralized companies, while top-down techniques were mostly beneficial in centralized organizations with a specific emphasis. Data Architecture as a Service (DAaaS) The authors suggest using a technique called Data Architecture as a Service to handle the issue of data governance in a decentralized organization (DAaaS). The hype around Software as a Service (SaaS) and Platform as a Service (PaaS) is combined with peer-based data architecture ideas in DAaaS. (PaaS). The authors aim to make it appear as if they are providing their customers with a valuable service while carrying out data architecture chores that are typically carried out via governance...

Strengths of InetSoft’s Data Blending Capabilities - InetSoft’s approach to data blending centers on a lightweight, flexible “data mashup” philosophy designed to make it easy for users to combine disparate sources without waiting on a full ETL or data-warehouse redesign. The platform allows live connections, cached data blocks, and interactive blending directly within the BI workflow, giving analysts and product teams faster ways to validate ideas while letting IT maintain control over performance and governance. This hybrid model—quick, self-service mashups paired with optimized caching—forms a core advantage when comparing InetSoft with Power BI, Tableau, and Domo. Self-service mashups: InetSoft’s designer enables users to join tables and sources interactively, prototype transformations in real time, and choose between live queries or high-speed cached blocks. This reduces friction for blending data from operational systems, spreadsheets, APIs, and third-party services...
Data Cleansing Engine - Looking a good data cleansing engine that is part of a BI solution? InetSoft's pioneering dashboard reporting application enables real-time data cleansing connected to live data sources to power great-looking web-based dashboards, all with with an easy-to-use drag-and-drop designer and SQL editor. View a demo and try interactive examples...
Data Discovery is Quickly Becoming Mainstream - Data discovery is quickly becoming mainstream, and almost every company is deploying that now. We haven’t seen that yet with search-based business intelligence. We haven’t hit that tipping point, yet. But that’s something I think to watch. And at the lower right of this slide you have the big database, and that’s this notion that okay I am dealing with maybe hundreds of millions of rows, tens of millions, hundreds of millions of rows, maybe in some cases, low billions, but that’s really pushing it. I think I have seen a couple installations that are that big. The original data discovery works, but what if I am talking about billions and billions of rows or petabytes of data here, is in-memory architecture really going to cut it? And at least some folks, vendors like Karmasphere, Datameer, Platfora are promoting the idea of putting lot of the data into Hadoop and using instead of in-memory, using more of a distributed file system, essentially of the open source Hadoop system as a way to store large amounts of detailed data, structured unstructured and analyze that. So that’s sort of another vector that we may see innovation on. There is other innovation happening with data discovery. There is a notion of what has been called smart pattern discovery where it’s actually the software that mashes up the data together and finds the interesting columns or variables, interesting insights in the data and then visualizes it...
Data Discovery Software Uncovers Stories - Welcome to today’s webinar entitled ‘How Data Discovery Software Uncovers Stories in the Data.’ While the webinar content will be 30 minutes, we can run over if there are questions. For today’s agenda, we’re going to discuss the landscape of the business intelligence market with the theme of how data tells stories and how stories help people make decisions and run their business. The end-user often gets stuck though, and they end up in what we call the cycle of pain. The good news is there are new technologies for data visualization and predictive analytics. They have evolved and help reduce the pain and make it easier for end-users to understand their data in order to answer questions. Then we’ll go through several examples, use cases in higher education, financial services, transportation and healthcare. And then at the end we’ll have time for questions and answers. So just to get started, business intelligence is a term that evolved back in the 50s and refers to the technologies, applications, and practices to collect, integrate, analyze, and present data. The purpose, which seems simple, but if often not met, of business intelligence is to support better business decision making...
Data Discovery Tools and End User Mashup - Today we are going to talk about data discovery tools and how people can mash up their own data together and create their own analytical views and then perhaps promote that for wider dissemination. The novel notion here is trying to blend the governed and centralized aspects of information management with user empowerment. That’s really what we are after in this presentation, and I just wanted to set that tone. Well what specifically are we going to cover here? We have got three key issues. First, I just want to talk about business intelligence strategy. Let’s identify that we have a self-service problem, which I think most of us have, and let’s define some linchpin ideas of how we are going to go about crafting a strategy just to solve this problem around self-service. Now second I want to get into the technology of data discovery. That’s clearly a huge trend in business intelligence. A lot of the BI platforms in the marketplace tend to be semantic layer based BI platforms, and I will define exactly what I mean by that later. They are very much being disrupted by what we call data discovery tools...
Data Discovery Tools Need to Be Independent of the Data Sources - I think also the data discovery tools need to be independent of the data sources. There might be third party data sources such as commercial information, demographics, customer behavior. We’re definitely already in an age of data services where organizations would go outside to just find data sources that they you know can draw insights from, and they need the tools that they can do that. Let’s move to the next point, and this one was about expanding spatial data and unstructured content. So again we’re looking at lot of the less traditional sources at least from a relational perspective. Expand the types of data that users can access and analyze. Push up the limits on insights. It changes what kinds of decisions can be made with information. So less decision-making should be done just with gut feel and more based on the data. People managing processes should have more interaction involving many types of information. I think as we look at those kinds of decisions and operations and departmental circumstances, that involves many types of information, not just what tradition BI has provided...
Data From Multiple Source Systems - One of the challenges with integration is when data is pulled from multiple source systems it can often be difficult to produce a clear picture because the source data is inconsistent or dirty. Data cleansing can be a very key part of creating a single version of the truth varies such as customer databases. Securities however we found best-in-class performance as well certainly exceeded other organizations too...
Data Graphing Software - InetSoft technology is proud to introduce you to their best ever data graphing software Style Intelligence™ Since it is Run on the web from any browser, StyleBI is a business intelligence platform. At its foundation is a powerful data mashup engine that enables fast and flexible transformation of data from disparate sources. With the ability to marry any type of data visually, StyleBI was designed to provide more information per pixel than your average data graphing software....
Data Grid Cache Technology - InetSoft's software has s a drag-and-drop interface. We very much believe that business users should be able to explore the data on their own and I will talk a little bit about what I am doing here, what I am doing is I am taking some of the data from the data window here and I am moving it simply over to our workspace. And so what I have done is I have actually looked at how many flights each airline has flown over the last 10 years, the number of record, and the number of flights. And I would like to point out I am working with 67 million rows on my laptop right now via our Data Grid Cache technology. This is the kind of the thing that you can do with data grid caches. You can actually take data, pull it down straight to your laptop and work with vast amounts of data. And you can work with many more than 66 million rows in a data grid cache using InetSoft. Our data grid cache works across your hard drives, across cache, across RAM on distributed servers in a cluster, so you are not actually limited by how much you have in RAM...

Data Intelligence Customer Release Demo - Hello and welcome everyone to the InetSoft StyleBI New Release Webinar. We're excited that so many of you were able to make it to the live webinar to tune in. My name is Ben, and I work in marketing here at InetSoft and with me here is Katie Roussey, who is a Systems Engineer here at InetSoft. I'll be briefly going over some of the product updates, and then Katie will be demoing some of those updates in more detail. There will be time at the end for questions. If you have any questions, just enter those into the question section in the Zoom webinar panel. One of the major feature updates in this release is the new data connectors for 73 different Cloud based web sources with catalogues of their API endpoints. You can connect to and update these sources on the web without needing Style Studio, although you can still use Style Studio if you'd like. You can do database queries for these sources through the worksheet. This reduces the need for software installed on your machine and it also makes the process easier. We have a new dashboard wizard with charts and table recommendations...
Data Intelligence Demo - At left, view a short 3-minute presentation to learn how InetSoft's approach to enabling data intelligence via business intelligence dashboards and reports differs from others in the marketplace...
Data Intelligence Platform - So with that in mind let me turn to the product presentation part of this webinar. The three pillars of agile BI really resonates very, very well with the InetSoft data intelligence platform, especially in terms of software development which the first thing that we’re about. We support some of the big things that’s BI is all about, which is really everything that you would see in a complete BI application such as dashboards, scorecards, reports, and analytic applications. The support part really relates well with the whole developmental environment. Getting the business users and business analysts involved in communicating with the IT people so that when the business users are building dashboards and using our web based report studio that if they run into something that might not be available in the data itself, that they can just go to the IT person, they can figure out where to get, make it available and do it right there. Or even if they have some kind of tricky layout or visualization that they are not able to do because it might be a little more complicated then what they can do, they can easily pass that design to the IT person who can use the same development environment, make modifications, and then he can publish it back for use by the business users...
Data Lake as a Necessary But Not Sufficient Foundation - I was just going to say, I think of the data lake as a necessary but not sufficient foundation for analytics and BI, and so it's great that we can get so much data into the lake so quickly. Our next challenge is getting the data out of the lake in an agile fashion to perform the analytics, and that's where the focus is shifting now. A lot of customers have expanded and hydrated the lake. It's already built out. It's there. Now we need to take advantage of that lake and keep it agile. Part of the whole benefit of the Big Data platforms is that they are kind of moving away from less agile solutions like traditional data warehouses which could take a long time to settle. While they're building out the lake we need to keep that agility of what do we do with the data and have it available more on demand, at the time of need, for the analysis, and the data lake is a foundation for that. Abhishek: Great, alright our next trend --- architectures mature to reject one-size-fits-all frameworks. Larry, can you tell us some more what are you thinking with this one...

Data Lakehouse Benefits - The advent of the data lakehouse has revolutionized the way corporations handle their data, allowing for a more efficient and comprehensive approach. This contemporary design combines data lakes with data warehouses to provide a single data repository with unmatched flexibility, cost-efficiency, and sophisticated analytics. We will go into the idea of a data lakehouse and examine its many advantages in this article. The data lakehouse's function as a centralized data store is at its core. A data lakehouse, in contrast to conventional compartmentalized techniques, gathers all of an organization's data, both organized and unstructured, into one readily accessible area. This centralization facilitates a more streamlined and effective data management process by making it easier to obtain and analyze data from many sources. Organizations may have a thorough understanding of their information environment and make better decisions by dismantling data silos. The ability of a data lakehouse to handle both organized and unstructured data is one of its most notable properties. Conventional data warehouses are great at handling structured data, but they often have trouble handling the unstructured data that's prevalent in today's data environment. On the other hand, a data lakehouse carries over the adaptability of data lakes, enabling businesses to easily store and handle unstructured data. Strategic coupling within a wider data storage and management system allows firms to get insights from a variety of data kinds, enabling innovation and adaptation to changing business needs...
Data Management of Multiple Data Sources Has Become Complex - Data management of multiple data sources has become complex. The idea of gathering information, I’m not saying it used to be simple, but it was simpler. You used to be able to deal with the inside data sources. Now you’re looking at a huge range of outside data sources, and I can tell you that data can come in all sorts of forms and formats, structured data, unstructured data, multimedia data, even automated sources, and I think that’s one of the most interesting pieces of the information management puzzle right now. Now, you can analyze how can you do that internally, externally or through automated processes, and again you still want to act in the digital enterprise, and that can include business decisions but also technology decision making, which I think is a really interesting area right now to be looking at. So in terms of gathering the data, as I said, it used to be a fairly simple process happening within the company. You would take all that information, and you would create a series of reports and processes. You wouldn’t have that much automation. But now add to that gathering that data from outside sources. Look at the rise of social networks and what that has meant for companies trying to deal with data. Now, it’s not just numbers. It’s also what’s being said about you. It’s how people feel about you. It’s how your brand is being perceived out there. How do you gather that information...
Data Management Solution Features - What are the key features successful users of BI need in their data management solutions? Companies need to be able to accommodate the perpetual trend of growth of their data sets. The average growth of corporate databases each year has been running around 25% per year. In most cases, they need to have a data transformation and cleansing process in place, and they need to be able to optimize queries that their BI applications are making on these large data stores. The goal is to deploy BI beyond just the BI specialists and database analysts and make it available to any knowledge worker, manager, or executive. Further, you are trying to deliver the information that matters to the key decision makers within the enterprise. Speed of access and timeliness of information are key, as well. Lastly, ease of use has to be a high priority. In terms of features you want to have in the BI solution, automated report generation and delivery is a must. Some kinds of information are best consumed via KPI dashboards, where people will willingly log in and check out each morning. Other types of information need to be pushed out via email. Otherwise people won’t look at it or act on it...
Data Management Tools Versus Data Modeling - So that being said, let's take a little bit of a deeper dive into these data management tools versus data modeling and the data model. It's a mechanism to help you visualize the power in your data. It lets you document the existing data assets and associated models. It lets you brainstorm conceptual models that can be used for consolidation or merging or reduction and complexity. It lets you consider alternatives for entity hierarchies and class inheritance. It lets you look at relationships between different data concepts, and it lets you look at the relationships between data concepts and their use within different business processes. Note that I am not talking about their use within an application, but rather within the business process that the application is actually the manifestation of. It is the method by which you try to automate some of that business process. But in fact, we are less concerned with how the data is being used as part of an application and more about how the information that’s within your data asset is being used to help you run your business or make your business better. So we want to rationalize representations across the different data sources and the applications to simplify the environment...
Data Mesh Architecture? - Big data is expanding at a never-before-seen pace, and with it come the problems of data silos and data governance. A new method of data architecture is required since conventional methods often fail to address these issues. Enter data mesh architecture, a cutting-edge method of data architecture created to deal with the problems of data silos and data governance. The definition, guiding principles, advantages, and implementation of data mesh architecture will all be covered in this article. A new method of data architecture called data mesh architecture places an emphasis on decentralizing data ownership and management. Data ownership and administration are centralized in conventional methods to data architecture, which means that a single team is in charge of gathering, storing, and managing data. This often results in data silos, where several teams or departments within an organization each have their own data, making it difficult to access and utilize the data efficiently. Data mesh design, on the other hand, encourages decentralized data ownership and management by enabling individual teams to oversee their own data domains...