InetSoft Data Modeling Features Compared to Tableau, Power BI, and Metabase
InetSoft provides a data modeling layer that combines enterprise data mashup, reusable semantic objects, and governed self service. This combination supports both agile analysis and centrally managed definitions in a single environment.

Core data modeling concepts in InetSoft
Enterprise data mashup engine
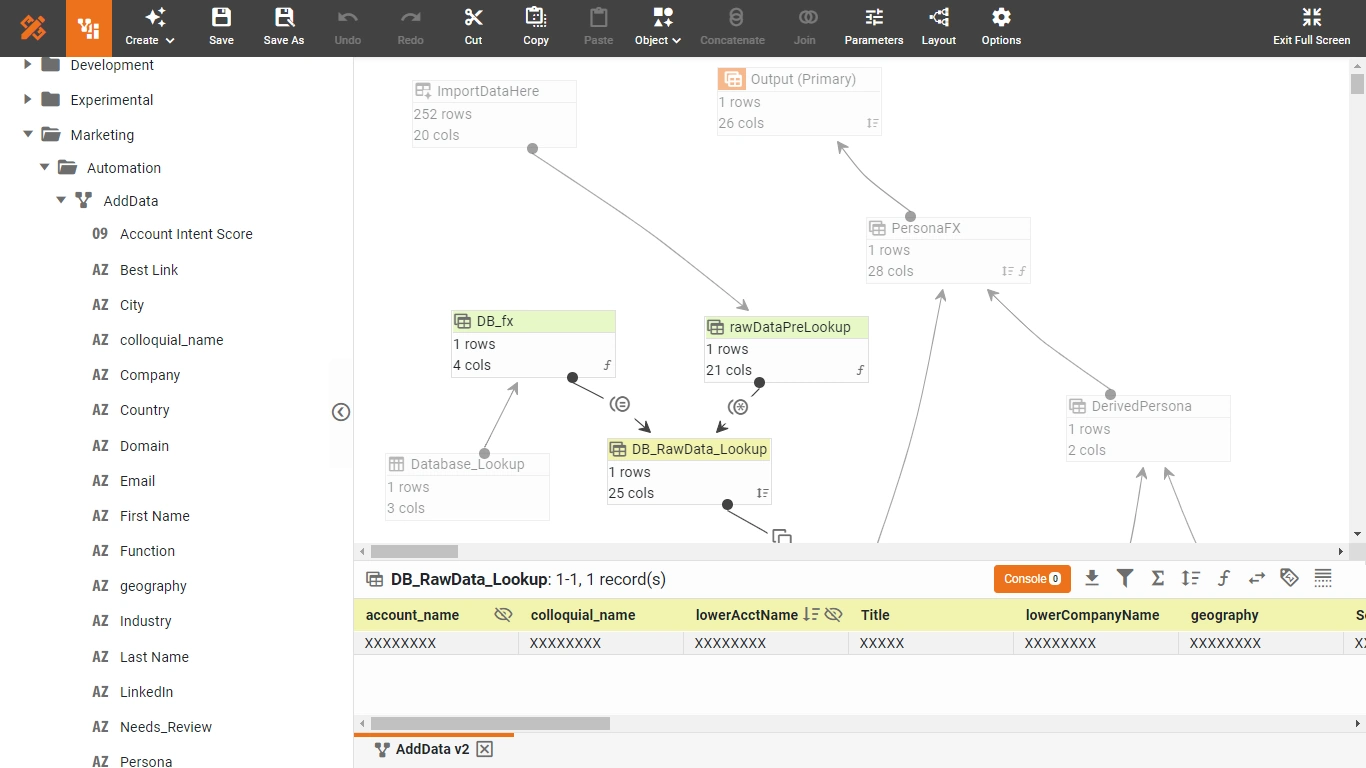
InetSoft is built on an enterprise data mashup platform that can pull data from many different locations and combine them into virtual sources. These mashups can include databases, spreadsheets, and other structured sources that are modeled together without a heavy warehouse project.
The mashup engine lets users define reusable data blocks. Each block can represent a curated join, filter, or aggregation that is shared across reports and dashboards. This behaves like a semantic layer that sits above raw sources and below visual content.
Reusable semantic views and data blocks
InetSoft allows designers to create semantic views that encapsulate joins, business rules, and calculated fields. These views are then exposed as logical tables for report authors and dashboard builders. The same view can support many visualizations which reduces duplication of logic.
Data blocks can be cached or live. Cached blocks support performance and snapshot style analysis. Live blocks support real time or near real time queries. The platform can mix both approaches in a single solution.
InetSoft's embedded analytics and data modeling capabilities enable organizations to deliver self-service insights to end users while maintaining strict governance and security controls. The platform's flexible architecture supports both departmental and enterprise-wide deployments.

Visual modeling with spreadsheet like flexibility
InetSoft offers a visual interface for modeling that feels similar to working in a spreadsheet but with governed metadata. Users can define calculated fields, groupings, and hierarchies directly in the modeling layer. These definitions are then centrally stored and reused.
This approach gives business users more control over data shaping while IT retains control over connections, security, and performance settings.
Hybrid of self service and governed modeling
InetSoft supports self service data mashup where power users can combine sources on their own. At the same time administrators can promote successful mashups into governed semantic objects. This creates a feedback loop between exploration and standardized models.
How InetSoft differs from Tableau, Power BI, and Metabase
Data mashup versus blending and import
- InetSoft: Uses an enterprise data mashup engine that creates virtual sources composed of reusable data blocks. These blocks can be queried in real time from dashboards and external applications.
- Tableau: Relies on data blending and extracts. Blending is typically defined at the worksheet level and is less reusable as a central semantic object. InetSoft
- Power BI: Uses Power Query and the data model to import and transform data. The model is powerful but usually tied to a specific dataset or report file.
- Metabase: Focuses on direct queries against databases with saved questions and models. It offers some modeling but does not provide a full enterprise mashup engine.

Features that are stronger or uncommon in Tableau, Power BI, or Metabase
- Patented enterprise data mashup platform: InetSoft provides a mashup engine designed from the start for combining many heterogeneous sources into virtual datasets. Tableau, Power BI, and Metabase can join data but do not emphasize a dedicated mashup engine with reusable blocks in the same way.
- Reusable data blocks as shared building units: InetSoft lets teams define data blocks that encapsulate joins and transformations which are then reused across dashboards and even third party applications. Tableau and Power BI reuse models at the dataset or workbook level but do not expose mashup blocks as a separate shared layer. Metabase relies more on saved questions and models than on block based mashups.
- Hybrid live and cached mashup strategy: InetSoft supports live connections and cached blocks within the same mashup framework. This hybrid model is part of the core data blending design. Tableau and Power BI support live and extract modes but treat them more as connection level choices than as a unified mashup strategy.
- Zero client web based modeling: InetSoft delivers modeling and mashup features through a web interface with no desktop installation. Tableau still relies heavily on Tableau Desktop for many modeling tasks. Power BI uses Power BI Desktop for most model design. Metabase is web based but offers a lighter modeling layer.
- Business user oriented mashup with enterprise governance: InetSoft positions data mashup as a technique that gives business users spreadsheet like flexibility while preserving enterprise security and repeatability. Tableau, Power BI, and Metabase support self service but their core modeling paradigms are less centered on mashup as a distinct capability.
When InetSoft data modeling is a better fit
InetSoft is particularly attractive when an organization needs to combine many disparate sources quickly without wasting money on a full warehouse and ETL project. The mashup engine and reusable blocks help teams respond to new data requirements in hours instead of months.
Teams that already standardize on Tableau, Power BI, or Metabase may still use those tools for visualization while relying on InetSoft to handle complex modeling and data transformation that the visualization only tools cannot manage.
More Articles About Data Modeling
8 Reasons Why Supply Chain Management Benefits From Big Data - Big data analytics plays a huge role in improving supply chain management, because it helps out various parts of a company, like: Strategy Operations, AND Tactics Big data helps companies focus more on things like: Improving delivery times Reducing the communication gap between manufacturers and suppliers Having decision-makers achieve operational efficiency Having management monitor performance to improve productivity Having management make augment data-driven decisions to reduce costs and improve service levels. In this article, we'll explain the 8 reasons why supply chain management benefits from the analytics generated by big data...
Absolutely a Big Hadoop is typically based on commodity everything. Cheap servers, cheap disks all tied together in a cluster, and PDW is not commodity. It’s high-end storage, high-end networking, high-end CPU and because it’s an appliance, the physical amount of processing you have is, by definition, finite. With Hadoop you can keep adding nodes to the cluster if you want. So they’re not exactly the same, but map produce inside of Hadoop and the MPP inside of SQL parallel data warehouse edition, they’re both distributed processing algorithms for dealing with large amounts of data and PDW is definitely a Big Data tool. What tools do we have? What does Microsoft offer, and what open source tools are there? Big Data is very popular in the open source world also. So what tools do we have at our disposal for both creating the Big Data and also analyzing and getting those results out of Big Data implementations...
Access Multiple Data Sources - InetSoft's BI platform, StyleBI, enables users to seamlessly extract data from multiple sources, and create dashboards and automated reports that reveal advantageous insights. The robust data mashup engine can join many data sources on common dimensions so that an aggregation of sources can be analyzed and manipulated within a single view. Once IT has connected and defined data sources, everyday users can create sophisticated reports and impressive Flash-based dashboards...
Accessing Multidimensional Databases - The multidimensional database is another way to provide data for OLAP operations. Taking the place of tables in relational databases, multidimensional databases organize data into cubes that contain measures and dimensions. This technology is often referred as MOLAP. The primary benefit of using MOLAP is enhanced performance because of pre-aggregation. MOLAP has no industry standard query language, although a few popular mechanisms exist. The Data Modeler uses these technologies to access meta¬data from MOLAP databases and present it uniformly. Because the meta data from a MOLAP database contains all of the information needed for the InetSoft data modeler engine, models for multidimensional databases are automatically created by the Data Modeler. Multidimensional databases are most commonly provided by a part of a relational database. Both the Microsoft SQL Server Analysis Services and Oracle OLAP server are OLAP add-ons. ESSbase is a specialized multidimensional database that is also marketed as an IBM OLAP server as an add-on to the DB2 database server...
Accessing Non-relational Data Sources - In today’s business environment, data is stored in many different formats. Java Objects, CORBA, and EJB are present in legacy systems, Web Services and XML are the new standards for sharing information over the internet, and Excel is a popular data analysis and manipulation tool. With InetSoft products, you can leave this data in its native format and still utilize it for BI purposes. With the explosive growth of the Internet, a number of new data format standards have emerged. A widely accepted format is XML. With its self-descriptive properties, and both human and machine-readable format, XML has transformed the way information is exchanged. The Data Modeler uses ‘XQuery’, (a standard developed by W3C) for querying XML documents and other forms of hierarchical data. It transforms the hierarchy into a flat tabular format to make it more conducive to reporting and analysis. The conditional expression syntax is based on SQL and is very easy to learn. This chapter provides a few examples of creating XML queries...
Accessing Web Service Data Sources - Web Services have proven increasingly efficient in sharing data among distributed applications in a hybrid language environment. The functionalities are made accessible over the web using SOAP (Simple Object Access Protocol). In InetSoft, it is possible to create a data source which retrieves data from a web service. The web service could be any standard SOAP implementation. To connect to the web service from InetSoft make sure you create the client java stub. Apache Axis is a common and widely used SOAP implementation. It provides a utility for creating a java client stub by introspecting a web service. Note: Make sure the {StubHome} folder is added to the classpath (of the Data Modeler or Report Designer) when creating your data source. We will discuss the creation of a (Java) client stub for a web service. The steps involved are as follows: 1. Make sure your web service is deployed and running on the host server. For axis, you could make sure by going to the following URL http://machine:port/webapp/services. e.g http://localhost:8080/sree/ services. 2. Create the client java Stubs. 3. Compile all the client java Stubs using javac...
Accessing CORBA Data Sources - With its multiple language binding, CORBA is a platform for building distributed applications in a hybrid language environment. Combined with the platform independence of Java; CORBA facilitates the development of truly portable applications. A CORBA object is defined using the CORBA IDL language, and is mapped to a language specific API. An implementation of the object can be created using language binding. Programs written in other programming languages can communicate with the object by binding the same IDL definition to that language. The Data Modeler takes CORBA data access to the next step. By taking advantage of the Java Reflection API, the Data Modeler can intelligently bind to a CORBA server. It automatically discovers CORBA objects’ available methods, and the object tree used to communicate with the server. Using this information, the Data Modeler constructs Java objects to pass to the CORBA server as parameters, and maps the CORBA method return values to hierarchical structures, which serve as the query data...

Accessing EJB Data Sources - Enterprise JavaBeans™(EJB) introduced a new way of writing server side Java applications. Using application servers supporting the EJB platform, an application can concentrate on creating business logic, and rely on the application servers’ middle tier services, with little or no additional programming. The EJB data source in the Data Modeler is designed to use the EJB API directly to access the application data model. Because it does not assume any particular implementation of the application server, it is fully portable and conforms fully to the EJB standard. EJB beans are server-side components written in Java. The beans can contain business logic for an application, as well as for the application data model. There are two classes of EJB beans. A session bean corresponds to the client of an EJB server. Each client communicates with the server by invoking session bean methods. The session bean keeps track of the session states. When the client terminates, the session bean is discarded. Therefore, it is a transient component, and does not have persistent states...
Accessing Text Data Sources - Text data sources are used to describe data in delimited text files. The text data is accessed using a URL in the same way as XML files. All delimited files are treated as a table. Each line is converted to a table row, and the delimited fields are used to populate the columns in the rows. A text data source definition contains parameters for accessing text data files. They include the URL of the data source, and a list of requests under the URL. In servlet or CGI based URL, each request corresponds to a parameter set for the HTTP request. If the URL refers to a static data stream, create one default request without any parameters. A text data source does not contain a schema definition of the data file. The data file columns are specified in individual queries. Other than the lack of the DTD import function, the text data source definition screen is exactly the same as the XML data source pane...
Accessing Java Object Data Sources - A Java Object Data Source is useful when your data cannot be accessed via common standards JDBC, SOAP, XML or if you have a pre-existing JAVA API to which you wish to connect. Creating a Java Object data source requires, at minimum, the creation of a Data Loader class. A data loader class can be based on the ‘inetsoft.uql. object.DataLoader’ interface, the ‘inetsoft.uql.object.DataLoader2’ interface or ‘Introspection’ based (by complying to the Java Bean conventions). In some cases an additional ‘Data Helper’ class is also needed to describe the structure of the data being returned. If your data has a ‘flat’ tabular structure, the Data Loader should be based on the ‘DataLoader2’ interface. It is the simplest and most convenient option; only deals with primitive data types and does not need any Data Helper class. For data which has a hierarchy (especially a recursive one) the data loader should be based on the ‘DataLoader’ interface or Introspection. e.g. 1 forest had N Trees; 1 tree has N leaves. OR An ‘Employee’ has a ‘Manager’ who is also an ‘Employee’ etc...

Accessing POJO Data Sources - Data Loader based on DataLoader2 interface The DataLoader2 interface is used to extract data which has a flat tabular structure as opposed to data with an inherent hierarchy. It is the simplest way to extract tabular data, without requiring any Data Helper class as it only deals with primitive data types. The DataLoader2 interface defines the following four methods: public String[] getRequests() This method should return a list of request names. A request is tied to one set of output objects sharing the same class, and to one set of parameters. Requests are presented on the Data Modeler and are selected as part of a query. e.g. public String[] getRequests() {return new String[] {"salesForEmployee", "salesForState"}; } public ObjectMetaData getRequestOutput(String request) This method gets the output object type of a request. This method must support all requests returned from the getRequests() method. e.g. public ObjectMetaData getRequestOutput(String request) {if(request.equals(“salesForEmployee“)) { return new ObjectMetaData(new String[] {"Employee", "Sales", "Year"}, new Class[] { (new String()).getClass(),(new Float(0)).getClass(),(new Integer(0)).getClass() }); }else if(request.equals(“salesForState“)){...
Achieving Analytic Agility with Data Mashups - The need to react quickly to a rapidly changing business climate is forcing organizations to make faster business decisions. But being able to quickly ask questions and get answers is not a simple task. While business intelligence (BI) tools and applications have emerged as viable solutions, traditional approaches to building and deploying these systems are complex, cumbersome, and expensive and often fail to keep pace with BI end-user demands and expectations. More often than not, resource-constrained IT departments are overburdened with BI requests, sometimes taking days, weeks, or months to fulfill them. The challenge is to deliver a BI system that breaks the mold of traditional BI solution deployments by removing this IT bottleneck and shifting the analysis to business users. What's needed is a more agile approach that allows business users to self-service their BI needs. Ovum believes a key enabler for achieving self-service BI agility is data mashup technology...