Java Based Performance Management Software
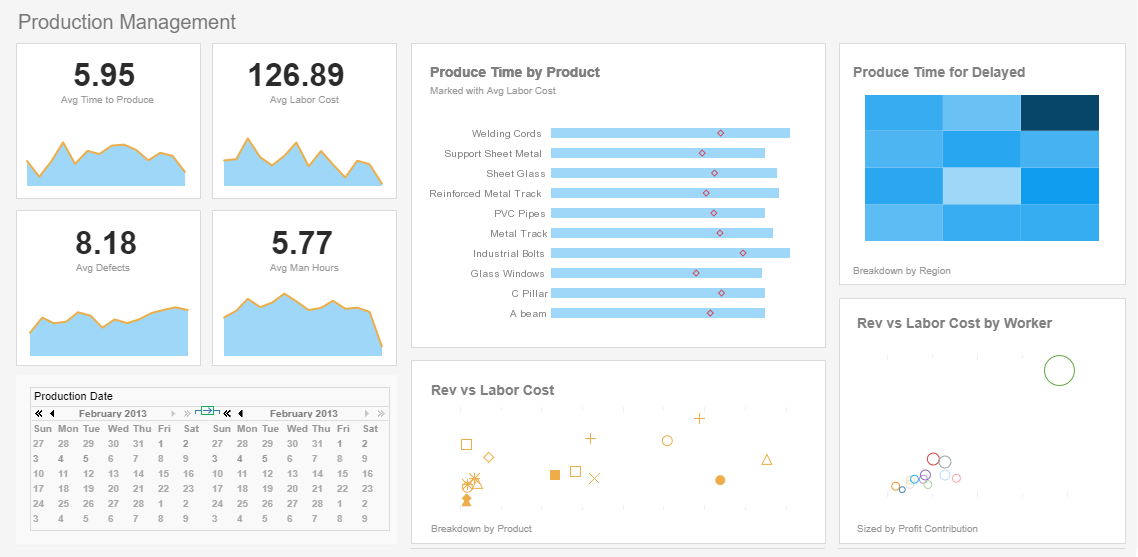
InetSoft's performance management software is a Java-based server application for delivering web-based interactive dashboards and scorecards, in addition to sophisticated and flexible reporting.
A Java BI Platform That Is Easy, Agile, and Robust
From InetSoft's inception the mission has remained the same: deliver BI software products that are easy, agile and robust.
In order to maximize the potential of your BI software project, StyleBI is
- easy to deploy - minimum specialized IT expertise required, and scale up with zero-client deployment and no per-user licensing
- easy to use – enjoy a shallow learning curve for business users; only Excel-level skills needed
- easy to administer – no BI or SQL experience required
Agility is what makes BI software powerful. StyleBI
- provides maximum self-service through ad hoc and visualization analysis
- enables self-service at the data level with InetSoft’s unique end-user defined data mashup
- accommodates quick formal and experimental changes
- addressing advanced and mass needs
- delivering reliability and scalability with a high-performance, secure infrastructure
More Articles About Performance Reporting
ATF Operations Visualization Software - ATF operates in a complex environment where multiple datasets must be analyzed rapidly to identify crime patterns, track illegal firearms, and ensure regulatory compliance. Key challenges included: Data Fragmentation: ATF collects data from multiple sources, including firearms sales records, crime reports, and forensic analysis. However, the lack of an integrated system made it difficult to analyze and cross-reference data efficiently.
BI Challenges of Big Data - The bottom line is we are dealing with large volumes of data, and in addition to that, we have got low latency requirements to get that data in order to make quick decisions or present offers in real-time, etc. Large data volumes tend to present problems for traditional kinds of analysis.
BI for Small Business - Small businesses are increasingly looking to business intelligence (BI) solutions to help them make better decisions, improve efficiency, and gain a competitive edge. However, many small businesses face unique challenges when it comes to implementing BI solutions.
Bottlenecks In Delivering Data - There are always going to be bottlenecks at some point, whether it’s delivering data or accessing data. You try to get it from the consumer sites, and that can be a bit of a challenge, but I have to think that things are getting better and better for the users these days, partly because of software as a service but also probably because you are starting to see more vendors talk about things like self-service BI and that kind of thing, which is a good thing.Bottlenecks In Delivering Data - The bottleneck in delivering data is the ability to get the data in a timely manner. If you have a lot of data, it takes time to process that data and get it into a format that can be used for analysis. This can be a problem if you need to make decisions quickly based on the data.
Enterprise Business Intelligence Challenge - And if we are able to adjust to that place with actual good data, then we can actually start using some of the existing tools or aggregators to better plug into that and actually make that data actionable, because there is a lot of manual collection that goes on or separate dashboards being used today.
Get a Web Based Dashboard Tool Demo - Are you looking for a web based dashboard tool demo. Pioneer InetSoft offers an easy to deploy, easy to use tool that is top rated by G2 Crowd users. View a demo, read reviews, and interact with examples.
How Does The Data Visualization Refresh? - There is a question about how does the data refresh. The mutual funds project, that was an ad hoc analysis. I just loaded some data, built the visualization, and saved it. It’s done much like if I built a spreadsheet. I can save the spreadsheet and it will contain the embedded data like a spreadsheet with the data, or I can save it with no data but it’s going to source link, so when you open and we’ll go get new data from wherever it is and bring in the refreshed data and adjust itself.
Radio Broadcasting Company Data Mashup - This generated a large volume of data across different systems, making it difficult to streamline processes, extract insights efficiently, and manage increasing costs associated with maintaining a fragmented BI environment. To address these challenges, the company implemented a data mashup tool, significantly transforming their approach to data integration, analysis, and decision-making. By consolidating disparate data sources into a unified view, they reduced costs and enhanced operational efficiency.


