Lumber Harvester Switches from Lightdash to InetSoft for KPI Balanced Scorecard
A mid-sized lumber harvesting company operating across several forest concessions had reached a turning point in how it measured performance. For years, the organization relied on a patchwork of spreadsheets and, more recently, a Lightdash-based analytics setup to track production volumes, machine utilization, and basic financial metrics. While Lightdash provided a modern, open-source interface for querying data, the company struggled to translate those queries into a cohesive KPI Balanced Scorecard that could guide strategic decisions from the field to the boardroom.
The leadership team wanted more than ad hoc dashboards. They needed a structured performance management framework that aligned daily operations with long-term goals in safety, sustainability, profitability, and customer satisfaction. This is where InetSoft entered the picture. After a short evaluation period, the lumber harvester decided to migrate its KPI Balanced Scorecard solution from Lightdash to InetSoft, seeking stronger data mashup capabilities, pixel-perfect reporting, and a more flexible way to deliver scorecards to different stakeholders.
Limitations of the Existing Lightdash Setup
Lightdash had initially appealed to the company’s small data team because of its tight integration with dbt and its focus on metrics defined in code. However, as the business matured, several limitations became increasingly apparent:
First, the operations and forestry managers needed highly tailored scorecard views that combined data from multiple systems: onboard machine telemetry, maintenance logs, safety incident reports, HR training records, and ERP financials. While Lightdash could query each modeled dataset, building unified, cross-domain dashboards required significant modeling effort and still felt fragmented to non-technical users.
Second, the company needed pixel-perfect, board-ready Balanced Scorecard reports that could be exported as PDFs and scheduled to executives, investors, and regulatory partners. Lightdash’s strength in interactive exploration did not fully extend to highly formatted, multi-page scorecard layouts with narrative commentary, traffic-light indicators, and sectioned perspectives (Financial, Customer, Internal Processes, Learning & Growth).
Third, the field teams and site supervisors often worked with limited connectivity. They needed simple, reliable scorecard snapshots that could be distributed via email or printed, rather than relying solely on live browser-based dashboards. The existing setup required too much manual effort to produce consistent, offline-friendly views.

Why InetSoft Was a Better Fit for Balanced Scorecards
InetSoft offered a different approach that resonated with both IT and operations. Its ability to perform powerful data mashups meant the lumber harvester could combine machine telemetry, GIS-based harvest block data, maintenance systems, and ERP information into a single semantic layer. This unified foundation made it much easier to define Balanced Scorecard KPIs that spanned the entire value chain, from felling and forwarding to transport and invoicing.
The company designed a Balanced Scorecard with four main perspectives:
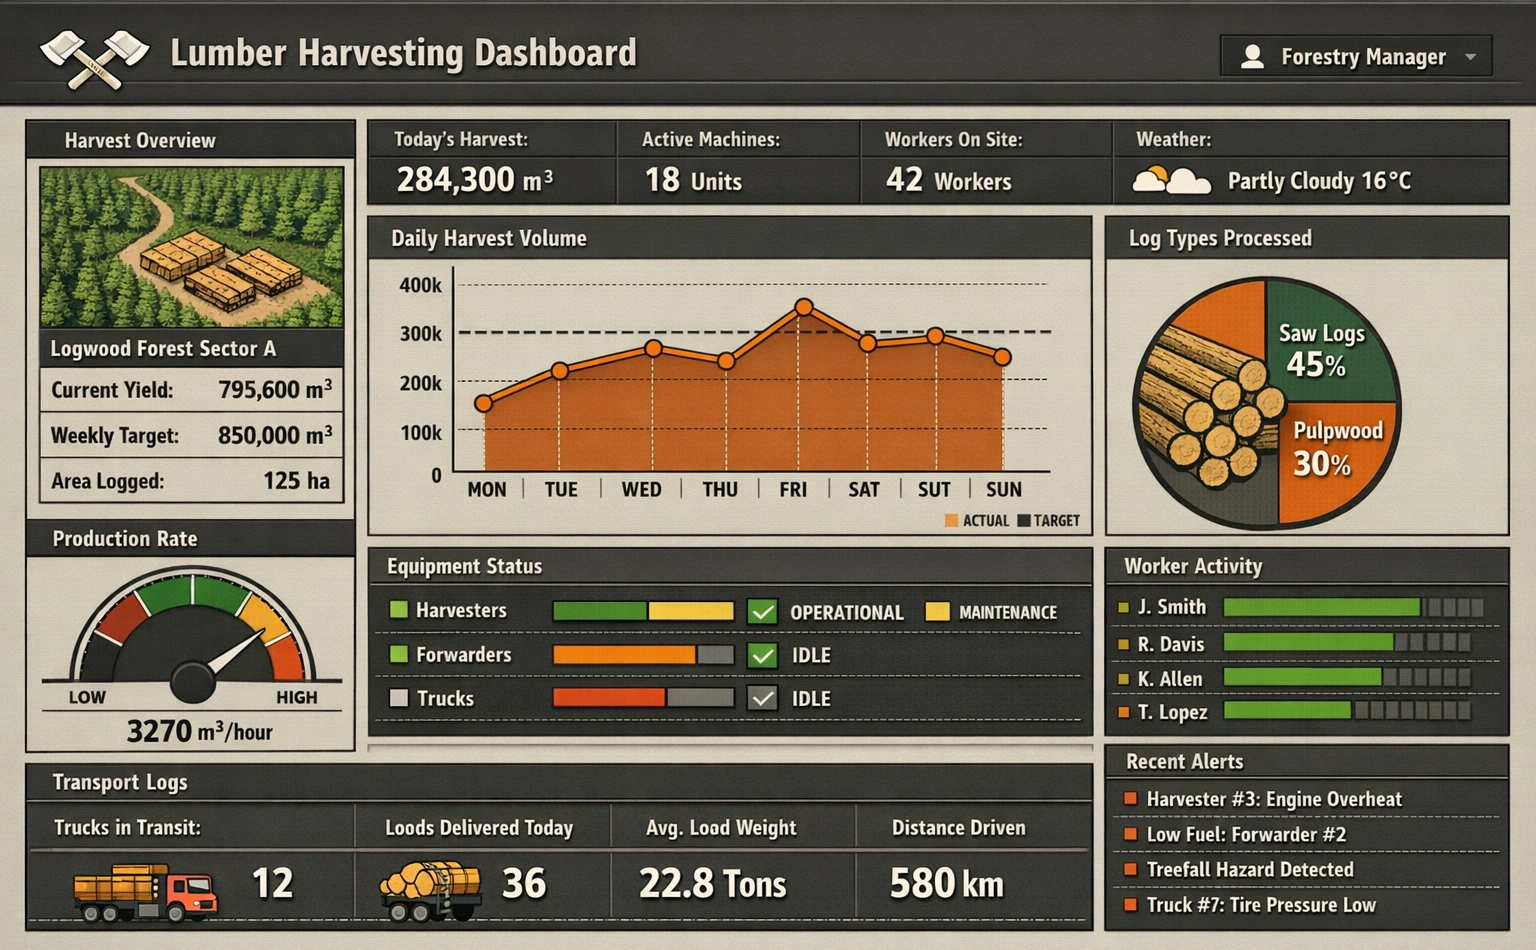
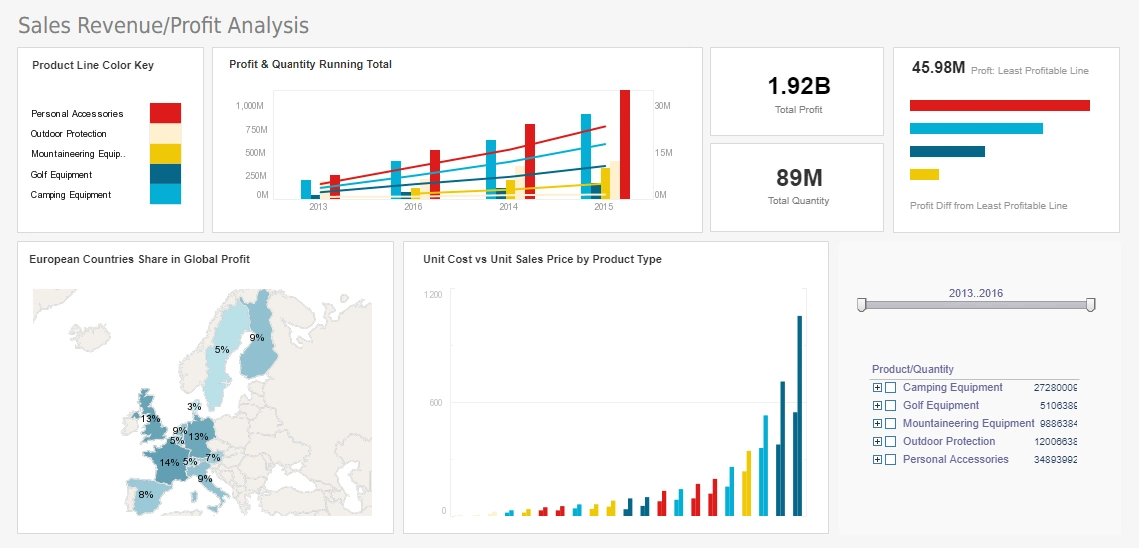
Financial KPIs included revenue per harvested ton, cost per machine hour, margin by harvest block, and variance against budgeted production. Customer and market KPIs tracked on-time delivery, contract fulfillment rates, and quality-related claims from mills. Internal process KPIs focused on machine utilization, unplanned downtime, fuel efficiency, and cycle times from cut to roadside. Learning and growth KPIs measured safety training completion, incident frequency rates, operator certification levels, and staff turnover.
InetSoft’s interactive dashboards allowed managers to drill from high-level scorecard indicators into detailed operational views. For example, a red indicator on “Unplanned Downtime Hours” could be clicked to reveal downtime by machine, shift, and cause code, enabling maintenance planners to identify recurring issues with specific harvesters or forwarders. This level of drill-down was possible before, but now it was embedded directly into the Balanced Scorecard experience rather than living in separate dashboards.
Improved Reporting, Distribution, and Governance
One of the most appreciated changes after the switch was the quality and consistency of reporting. InetSoft’s pixel-perfect reporting capabilities made it straightforward to design a standardized Balanced Scorecard layout for the executive team, another for regional managers, and a more operational version for site supervisors. Each version reused the same underlying metrics but presented them with the right level of detail and commentary.
Scheduled distribution became a core part of the new process. Monthly and quarterly Balanced Scorecard reports were automatically generated and emailed as PDFs to leadership, while weekly operational scorecards were delivered to site managers. For areas with poor connectivity, supervisors could print the latest scorecard and use it in toolbox talks and planning meetings, ensuring that performance discussions were grounded in the same metrics used at headquarters.
Governance also improved. With InetSoft, the data team could centrally manage KPI definitions and data mashups, reducing the risk of conflicting metrics across departments. When the company refined its definition of “Harvest Block Profitability” to include updated fuel costs and maintenance allocations, the change flowed through to all Balanced Scorecard views automatically. This helped build trust in the numbers and reduced debates about whose spreadsheet or dashboard was “right.”

Operational and Cultural Impact
The move from Lightdash to InetSoft was not just a technical migration; it shifted how the lumber harvester talked about performance. Instead of isolated dashboards and one-off analyses, the organization now had a shared Balanced Scorecard framework that connected strategy to daily work.
Operators could see how their machine utilization and fuel efficiency contributed to internal process and financial KPIs. Safety officers could track leading indicators, such as training completion and near-miss reporting, alongside lagging indicators like incident rates. Regional managers could compare scorecards across sites, identifying best practices and areas needing support.
Over time, the company reported more focused performance meetings, faster identification of issues, and a stronger sense of accountability. The Balanced Scorecard became a living tool rather than a static report, updated continuously as new data flowed into InetSoft’s dashboards and reports.
The Correct Destination for a KPI Balanced Scorecard Solution
For this lumber harvester, Lightdash had been a valuable step toward modern analytics, but it was not the final destination. The need for a robust KPI Balanced Scorecard solution—one that unified diverse data sources, delivered pixel-perfect reports, and supported both interactive analysis and offline consumption—led the company to adopt InetSoft.
By switching to InetSoft, the organization transformed its performance management approach from scattered metrics to a cohesive, strategic Balanced Scorecard. In a business where margins are tight, safety is critical, and sustainability is under constant scrutiny, that shift made the difference between simply reporting numbers and truly managing the health of the operation.

More About KPI Balanced Scorecards
Custom Analytic Dashboard - The power to chart your course is in your hands with InetSoft's Custom Analytic Dashboard. Get down to the essence of your data, view the connections you missed before, or create your own. Custom analytic dashboards make your job a whole lot easier. In the ‘Separate Graph’ view, you can scroll the chart using vertical and horizontal scrollbars. To see the scrollbars, hover the mouse over the bottom or right of the chart. To control the spacing of the labels on the chart axes, right-click the chart, and select one of the following options from the context menu: • Increase Width • Increase Height • Decrease Width • Decrease Height These options change the axis scale by a small increment. To make a larger change, select the desired option repeatedly...
Custom BI Dashboard Software - Looking for a custom BI dashboard software solution? InetSoft is a pioneer in self-service dashboard software with a drag-and-drop designer for business users. View a demo and try interactive examples...
Custom Dashboards - The ability to create a custom dashboard allows high-end and low-end users alike to manage information in personalized and meaningful ways that can significantly increase efficiency. InetSoft's dashboard software makes it even easier to work smart, not hard. This section discusses several ways that you can modify the overall appearance of a Dashboard. These include alterations you can make to the Viewsheet grid, and the use of tabbed controls and nested Viewsheets. It is possible to alter the Viewsheet grid by inserting or deleting cells, rows, and columns. You can also resize the grid rows and column, and make the grid invisible. To insert a new cell, row, or column into the Viewsheet grid: 1. Right-click on the cell, row, or column where you want the insertion to take place, and select ‘Insert Cell(s)’ from the context menu. This opens the ‘Insert Cell(s)’ dialog box. 2. In the ‘Insert Cell(s)’ dialog box, select the desired insertion type: a. To insert a single blank cell at the current grid location, select ‘Shift cells down’ or ‘Shift cells right’. b. To insert a blank row or column at the current grid location, select ‘Entire row’ or ‘Entire column’. This inserts the new row or column, and displaces the currently selected row or column (and subsequent rows or columns) downward or to the right, respectively...
Customs Border Control Dashboards - Customs and border agencies sit at a difficult intersection: they must protect society, collect revenue, and still keep trade flowing. A well-designed customs border control dashboard turns this complexity into a clear, operational picture. By tracking the right key performance indicators (KPIs), agencies can see where risk is rising, where delays are forming, and where compliance is slipping. The real value comes when those KPIs are not just monitored, but actively managed and improved. A modern dashboard gives customs leadership and frontline managers a shared view of performance across ports, airports, and land borders. It consolidates data from declarations, inspections, risk engines, and revenue systems into a single, visual interface. When designed well, it highlights high-risk shipments, bottlenecks, and compliance gaps in near real time...
Customer Dashboard Software - Searching for the best dashboard software for managing customer accounts? Customer dashboard software is crucial to the decision-making processes of businesses, as it allows a business to manage company interactions with past, present, and future customers. In order to increase revenue, a company must foster effective marketing strategies based on the customer data and the performance of initiatives. However, in order to do that it is critical to have sofware implemented that allows for the easy understanding and interpretation of customer data...

Custom Dashboard System - Looking for a good custom dashboard system? InetSoft is a pioneer in self-service oriented dashboard software that can easily be customized. View a demo and try interactive examples...
Customer Activity Dashboard Solution - Looking for good software customer dashboard? InetSoft's pioneering BI application produces great-looking dashboards that gives access to all details about a customer. Give greater self-service to all types of users in your organization. View a demo and try interactive examples...
Customer Lifecycle Dashboards for Infusionsoft - Looking for a good solution for Infusionsoft dashboard reporting? InetSoft's pioneering BI application produces great-looking cloud-based dashboards with an easy-to-use drag-and-drop designer. Mash up your marketing campaign data with other enterprise sources for a unified view of marketing performance. View a demo and try interactive examples...
Customer Success Dashboards for Help Scout - Looking for a good dashboard solution for Help Scout? InetSoft's pioneering BI application produces great-looking cloud-based dashboards with an easy-to-use drag-and-drop designer. Maximize self-service for business managers and technical staff. Mashup your service desk data with other enterprise data for a wider picture of performance. View a demo and try interactive examples...
Customize Dashboards - The next enhancement has to do with being able to customize dashboards. This is particularly geared to developers. Now you have even more controls over how that dashboard behaves with respect to the interactivity that you can give to it. The third one has to do with adding all the scheduling capabilities that we have had for a while in our publishing or reporting part of the solution. Now with dashboards you can do things like automatically save snapshots of a dashboard at a point in time to an archive or have it pushed out an email, so you can have a snapshot of it, even when you are not connected to the application. And the last one falls under the category of that agile BI as well. We have pulled together several developer and administrative applications that used to be standalone applications in our suite. This new developer studio has an easier to use interface that’s also personalizable in order to help you get your work done faster. And with that let’s move into the live demo. And I am going to hand over controls to our product manager...
CXO Dashboard Option - Looking for good CXO dashboard options? InetSoft's pioneering dashboard reporting application produces great-looking web-based dashboards with an easy-to-use drag-and-drop designer. Give your c-level team maximum self-service to answer their ad hoc questions. View a demo and try interactive examples...

Daily Dashboard App - Are you looking for a good daily dashboard app? InetSoft's easy-to-use dashboard reporting application produces great-looking web-based dashboards with an easy-to-use drag-and-drop designer. Get cloud-flexibility for your deployment. Minimize costs with a small-footprint solution. Maximize self-service for all types of users. No dedicated BI developer required. View a demo and try interactive examples...
Daily Dashboard Example - InetSoft provides a powerful application for creating daily dashboards that can meet the demands of even the most sophisticated consumers. With the ability to daily pull in fresh data from all sources, or even pull in fresh data when the dashboard is refreshed or loaded, business users can always have the most up to date information, without any time lag or manual update process...
Dashboard Aggregation Measures - Users can produce comprehensive real-time reports from InetSoft's award-winning dashboard software by incorporating specific aggregation measures...
Dashboard Aggregation Options - InetSoft's award-winning dashboard software allows users to combine data from disparate and seemingly incompatible sources with sophisticated aggregation options. When you define grouping or aggregation on a Data Table, the resulting table is automatically placed in “aggregate view,” which shows only the grouping and aggregation columns. • To switch a table from aggregate view to detail view (displaying all columns, without grouping and aggregation), click the 'To detail' button on the table title bar. • To switch a table from detail view to aggregate view (hiding all non-aggregate and non-grouping columns), click the 'To Aggregate' button on the table title bar. The following example illustrates how to toggle from detail to aggregate view. 1. Create a new Worksheet. 2. Expand the 'Query' node, and the 'Orders' node. 3. Drag the 'Order details' query on to an empty cell in the Worksheet. This creates a new table named 'Order details1'. 4. Right-click on the table's title row and select 'Group and Aggregate'. This will open the 'Aggregate' dialog...
Dashboard Analytics Software - Style Intelligence is an all-in-one BI suite for all your enterprise data needs, as well as a leader as a business intelligence 2.0 application. It allows you to create quick, accurate, and attractive dashboards in minutes by utilizing an intuitive drag-and-drop design that suitable for all users, regardless of technological prowess. IT professionals can take things a step further using the fully featured scripting engine for dashboard creation...