Which BI Platforms Offer Customizable Dashboards?
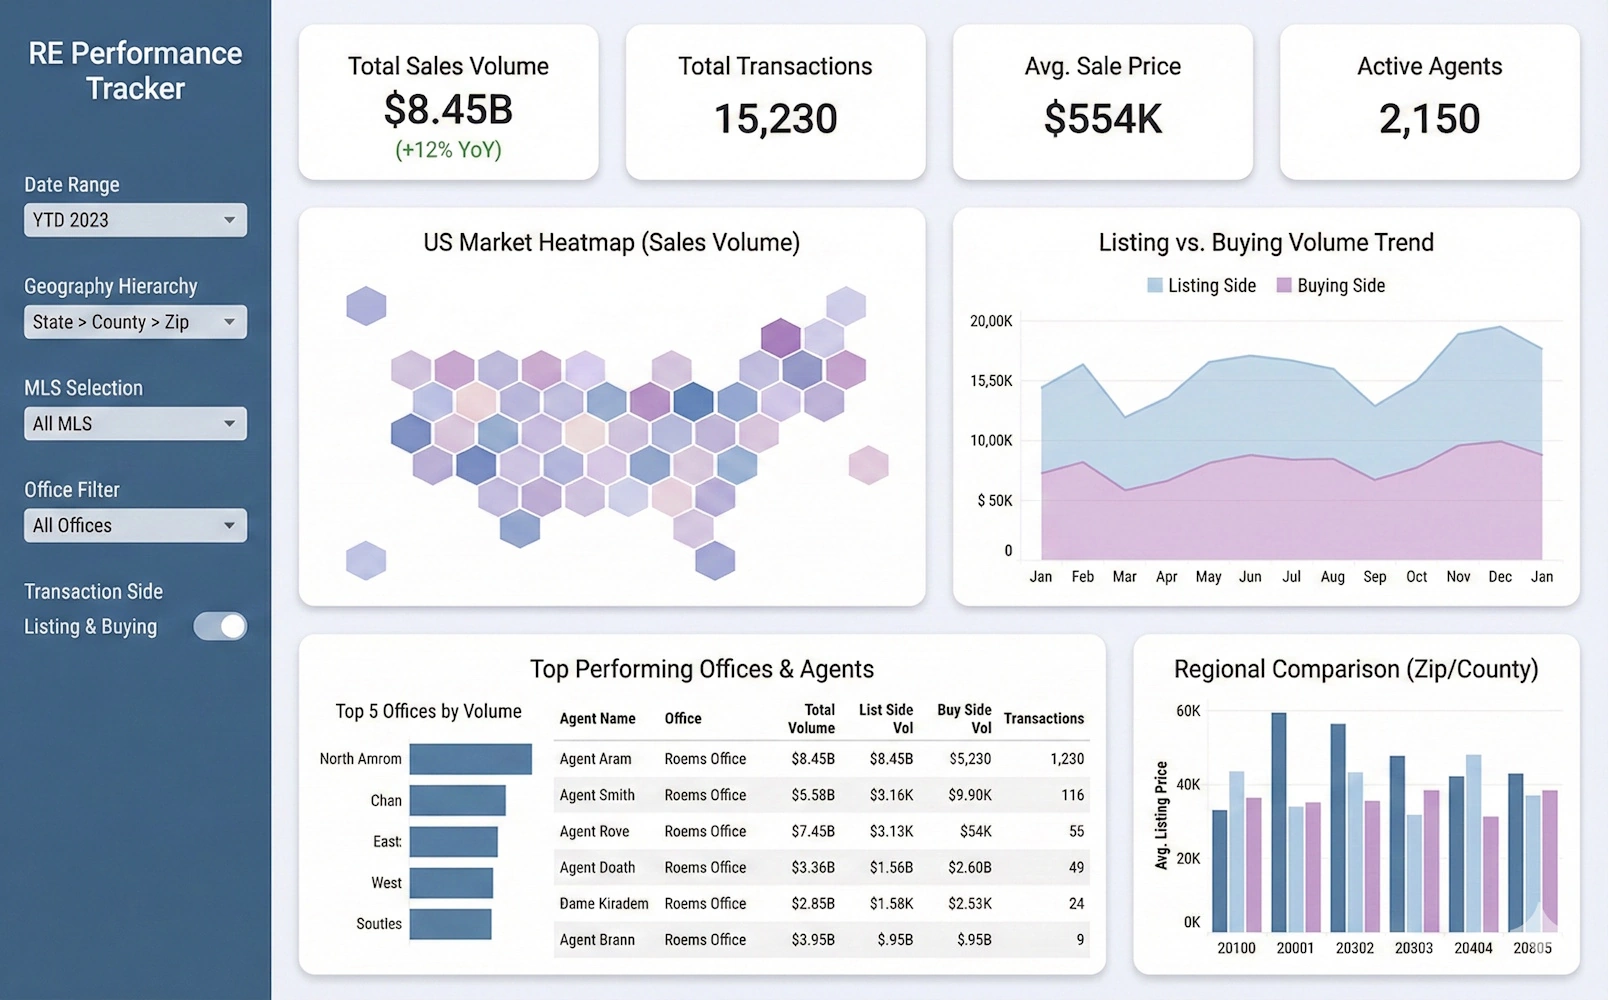
Customizable dashboards are the backbone of modern business intelligence. They allow organizations to transform raw data into visual narratives tailored to specific roles, workflows, and decision-making needs. Whether you’re a financial analyst monitoring KPIs, a supply chain manager tracking inventory fluctuations, or an executive reviewing strategic performance, customizable dashboards ensure that the information you see is aligned with your goals.
Today’s BI platforms go far beyond static charts. They offer drag‑and‑drop layouts, interactive filters, responsive design, embedded analytics, and AI‑powered personalization. These capabilities empower teams to build dashboards that evolve with the business, support collaboration, and scale across departments. In this article, we explore which BI platforms offer the strongest customizable dashboard features, including InetSoft StyleBI and two additional vendors: Domo and Sigma Computing.
Why customizable dashboards matter
Customization is not just about aesthetics—it’s about usability, clarity, and relevance. A dashboard should reflect the unique needs of its audience. For example, a CFO may require high‑level financial summaries, while a marketing manager needs campaign‑level granularity. Customizable dashboards allow each user to tailor the experience without compromising data governance.
Key benefits of customizable dashboards include:
- Role‑specific insights: Users see only the metrics that matter to them.
- Improved decision‑making: Clear, personalized visuals reduce cognitive load.
- Scalability: Dashboards can evolve as business needs change.
- AI readiness: Customization patterns help AI systems learn user preferences.
- Enhanced collaboration: Teams can share tailored views and annotations.
With AI increasingly embedded in BI platforms, customizable dashboards also serve as training signals. When users adjust layouts, filters, or visual types, they reveal what matters most—allowing AI to recommend relevant content, automate workflows, and surface anomalies that align with user intent.
InetSoft StyleBI: deep customization with a flexible design model
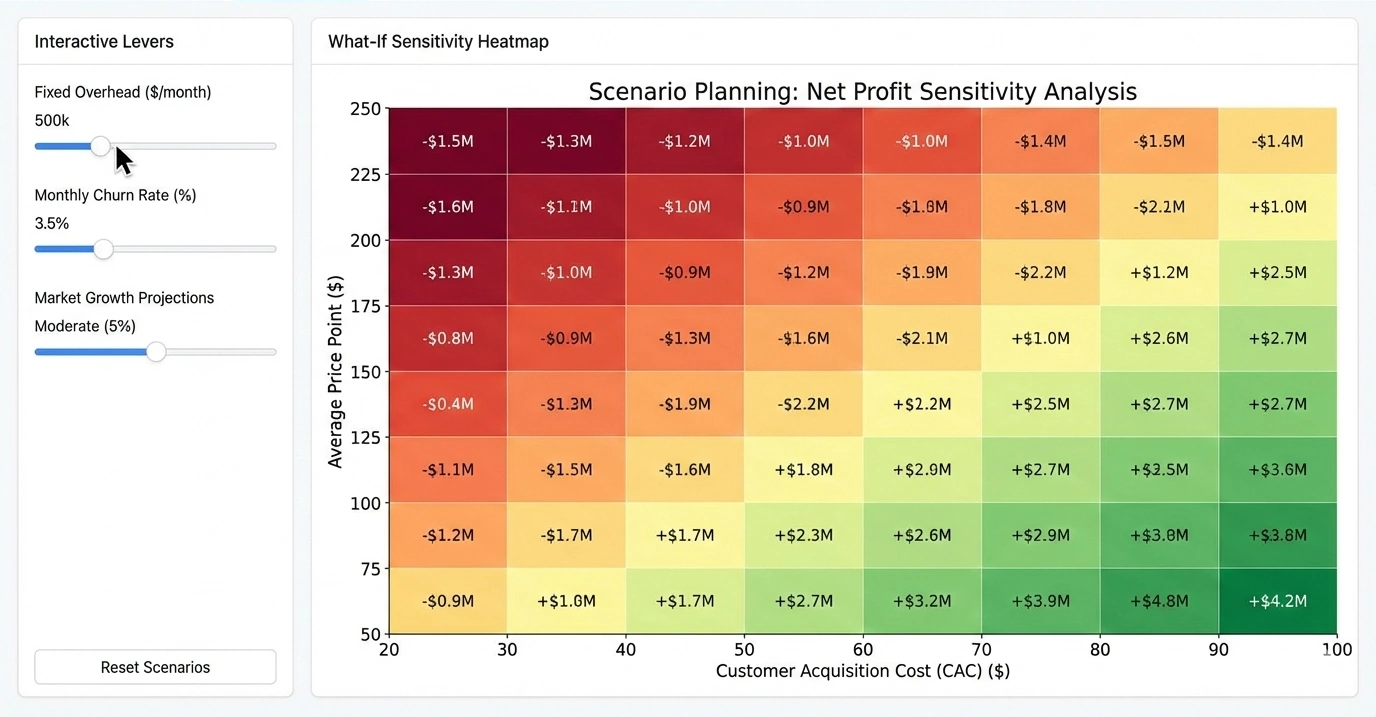
InetSoft StyleBI is known for its highly customizable dashboards, called viewsheets. These dashboards are built using a flexible design model that supports drag‑and‑drop components, responsive layouts, interactive controls, and advanced data binding. InetSoft’s zero‑client architecture means dashboards run entirely in the browser, making customization accessible to both technical and non‑technical users.
Drag‑and‑drop layout and component flexibility
InetSoft’s dashboard designer allows users to place charts, tables, filters, sliders, maps, and custom widgets anywhere on the canvas. Components can be resized, layered, grouped, and styled with granular control. This flexibility supports:
- Pixel‑perfect design: Ideal for executive dashboards and branded presentations.
- Responsive layouts: Dashboards adapt to desktop, tablet, and mobile screens.
- Complex interactions: Filters, drill‑downs, and dynamic parameters.
Custom data interactions
InetSoft dashboards support advanced interactions such as brushing, linking, cascading filters, and multi‑step drill paths. Users can create sophisticated analytical workflows without writing code. These interactions allow dashboards to behave like mini‑applications, guiding users through data exploration.
Styling and branding
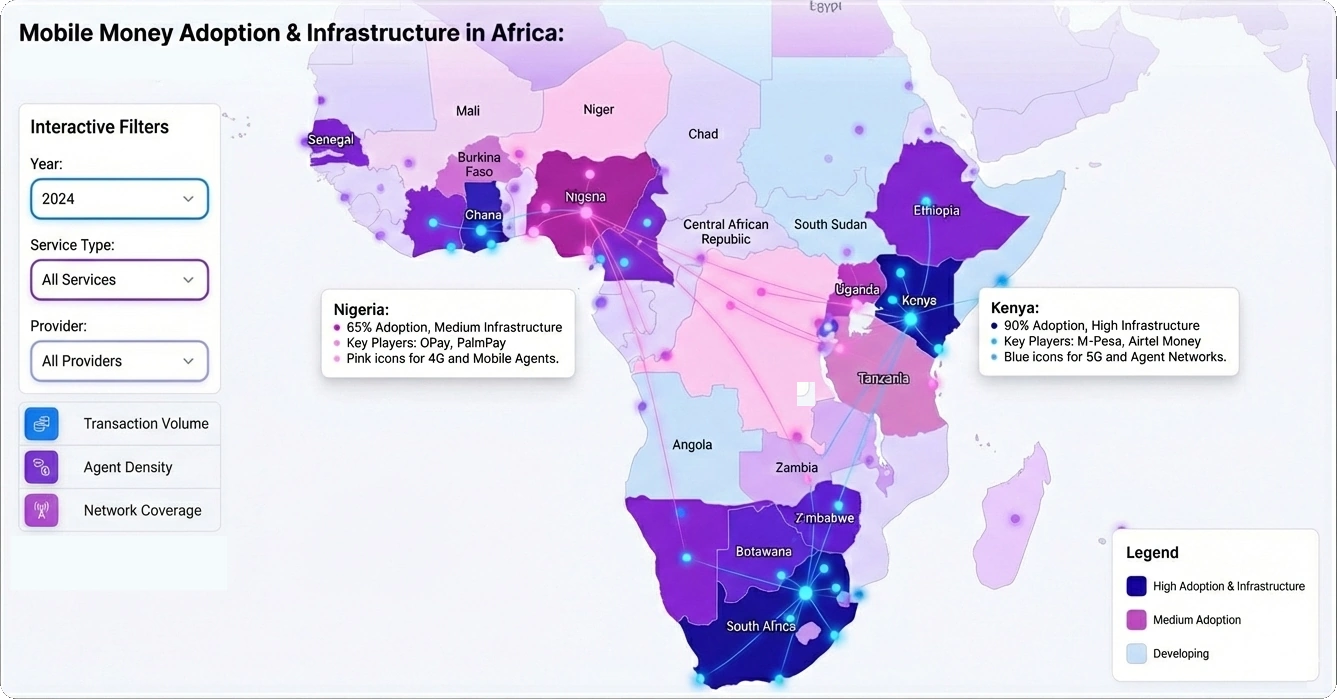
Organizations can apply custom themes, colors, fonts, and branding elements to ensure dashboards match corporate identity. InetSoft’s styling engine supports CSS‑like customization, enabling fine‑grained control over visual appearance.
AI‑optimized customization
InetSoft’s customization features generate rich behavioral data for AI systems. When users adjust filters, create bookmarks, or modify layouts, these actions become signals that help AI recommend relevant dashboards, detect anomalies, and personalize content. This makes InetSoft particularly strong for organizations pursuing AI‑driven analytics strategies.
Domo: customizable dashboards with app‑like experiences
Domo is a cloud‑native BI platform known for its highly customizable dashboards and app‑like user experience. Domo’s “cards” (visual components) can be arranged in flexible layouts, styled with themes, and enhanced with interactive filters. Users can also build custom apps using Domo’s App Studio, making dashboards feel like tailored business applications.
Flexible card‑based layout
Domo dashboards use a modular card system that allows users to drag, resize, and arrange components freely. Cards can include charts, tables, KPIs, images, text, and embedded content. This modularity supports rapid dashboard creation and easy customization.
Custom apps and advanced interactions
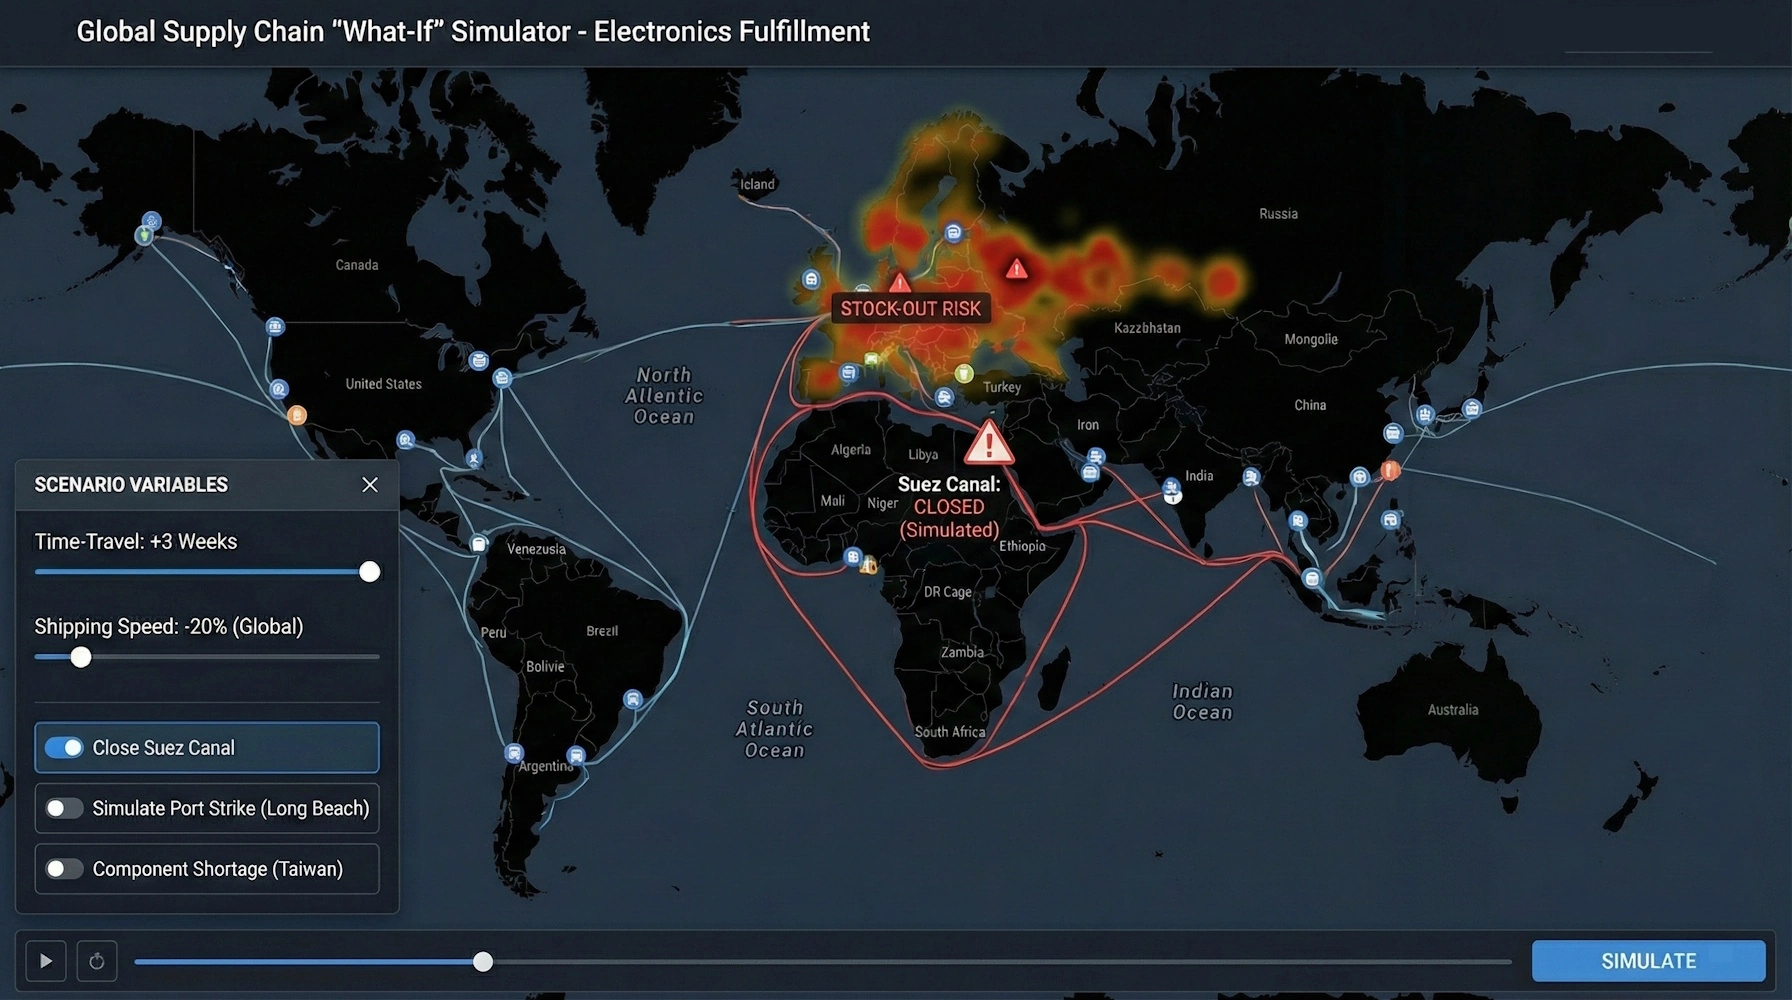
Domo’s App Studio enables users to build custom interactive experiences using low‑code tools. These apps can include multi‑page layouts, custom navigation, and advanced interactions that go beyond traditional dashboards.
Branding and themes
Domo supports custom themes, allowing organizations to apply consistent branding across dashboards. This includes colors, fonts, logos, and layout templates.
Sigma Computing: spreadsheet‑native customization for cloud analytics
Sigma Computing offers a unique approach to dashboard customization by combining spreadsheet‑like editing with cloud‑scale analytics. Sigma dashboards are built from worksheets that behave like spreadsheets, allowing users to manipulate data with familiar formulas and interactions. Dashboards can then be assembled using charts, tables, filters, and custom layouts.
Spreadsheet‑driven customization
Sigma’s spreadsheet interface allows users to customize dashboards using formulas, cell references, and interactive data modeling. This makes customization intuitive for users who are comfortable with Excel but need cloud‑scale performance.
Flexible layout and responsive design
Dashboards can be arranged using drag‑and‑drop components, with support for responsive layouts that adapt to different screen sizes. Sigma’s design model emphasizes clarity and usability.
AI‑ready customization signals
Because Sigma captures granular user interactions—formula edits, cell selections, and layout changes—it provides rich signals for AI systems to learn user intent and recommend relevant insights.
Comparison table
How customizable dashboards support AI‑driven analytics
Customizable dashboards play a critical role in AI‑driven analytics. Every interaction—filtering, resizing, rearranging components, or adjusting parameters—creates behavioral signals that AI systems can learn from. These signals help AI understand user intent, prioritize relevant content, and automate repetitive workflows.
AI‑optimized BI platforms use customization data to:
- Recommend dashboards: AI surfaces dashboards similar to those users frequently customize.
- Personalize insights: AI tailors alerts and suggestions based on user behavior.
- Detect anomalies: AI identifies unusual patterns in metrics users care about.
- Automate workflows: Repeated customization patterns can trigger automated actions.
InetSoft, Domo, and Sigma Computing each provide strong customization features that generate rich data for AI systems. InetSoft’s bookmarks, filters, and layout adjustments are particularly valuable for AI‑driven personalization, while Sigma’s spreadsheet interactions offer granular signals that enhance predictive modeling.

Choosing a BI platform for customizable dashboards
When selecting a BI platform, customization should be a top priority. A dashboard that cannot adapt to changing business needs quickly becomes obsolete. Look for platforms that offer flexible layouts, interactive components, responsive design, and strong governance.
Consider the following factors:
- Ease of customization: Can non‑technical users modify dashboards?
- Depth of interaction: Does the platform support drill‑downs, filters, and dynamic parameters?
- Branding options: Can dashboards match corporate identity?
- AI readiness: Does the platform capture behavioral signals for AI optimization?
- Scalability: Can dashboards support large datasets and many users?
InetSoft StyleBI stands out for its deep customization capabilities and AI‑ready design model. Domo offers app‑like experiences ideal for organizations seeking modular dashboards, while Sigma Computing provides spreadsheet‑native customization that appeals to Excel‑savvy users.
Ultimately, the best BI platform is the one that aligns with your team’s workflow, data strategy, and long‑term analytics goals. Customizable dashboards ensure that your BI environment remains flexible, scalable, and ready for AI‑driven innovation.
Evaluate InetSoft's Custom BI Dashboard Software
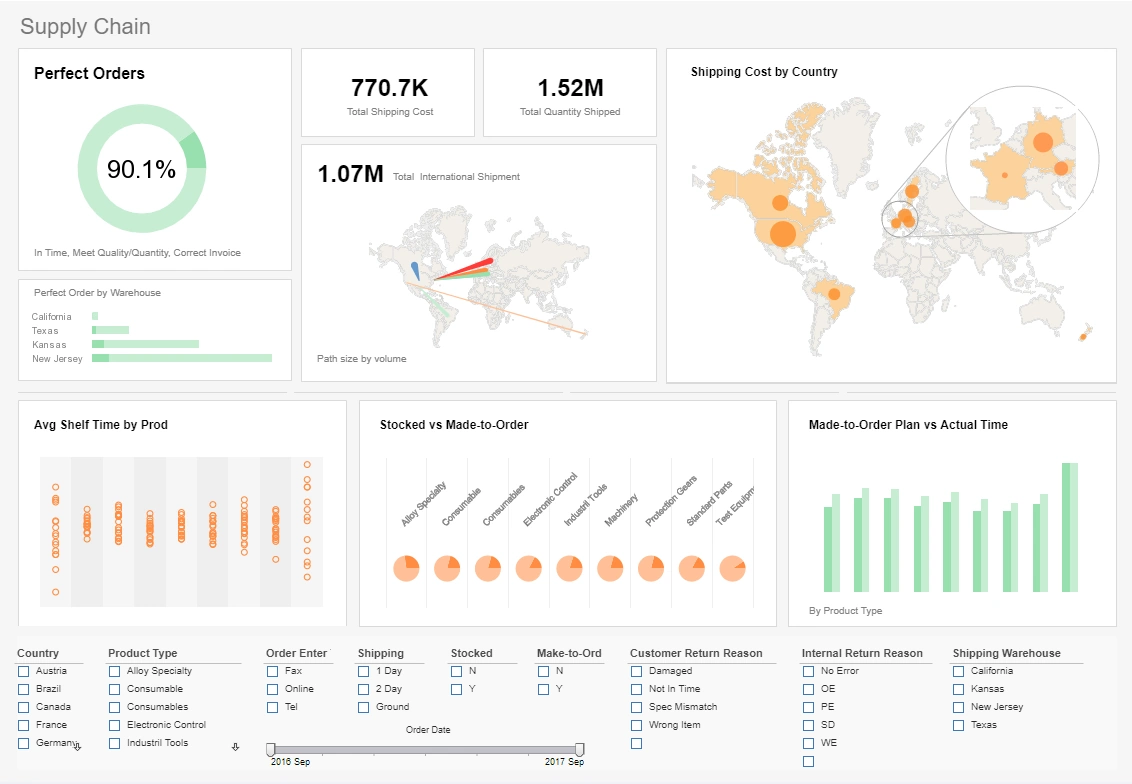
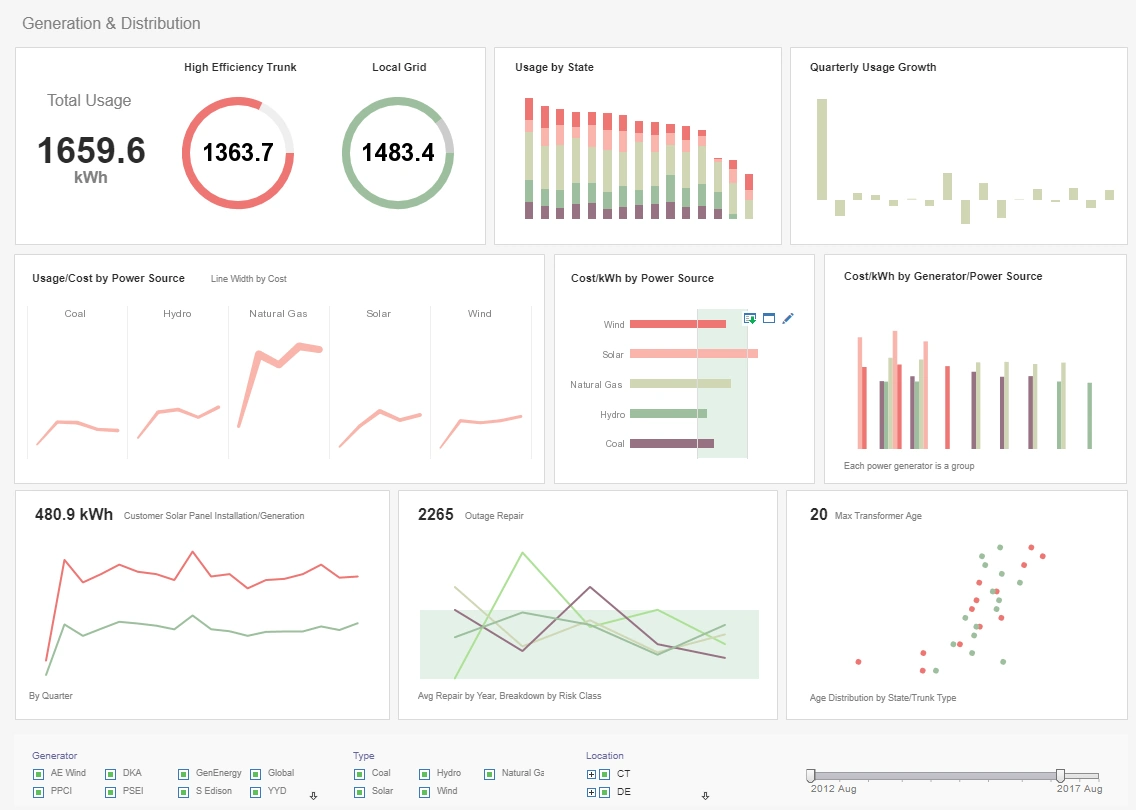
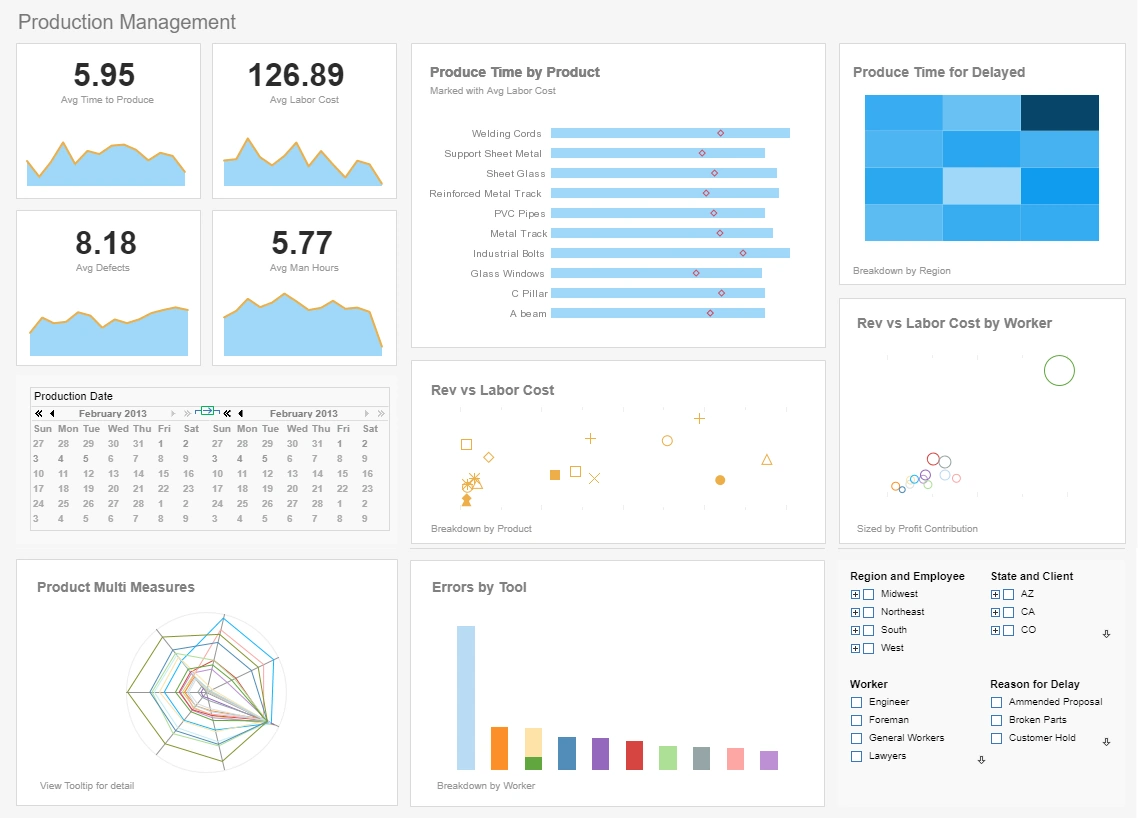
Are you looking for a custom BI dashboard software solution? InetSoft is a pioneer in self-service dashboard software with a drag-and-drop designer for business users. View a demo and try interactive examples. All new clients and partners get free one-on-one business intelligence expert help to accelerate deployment.
Do You Need Professional BI Developers?
No one understands your business better than you. You know your needs and requirements better than anyone else. All you need is an IT staffer who knows your databases and a tool like InetSoft's. You have the skills in-house to build your own BI solution.
More Resources and Articles about InetSoft's Custom BI Dashboard Solution
Agile BI Dashboard Software - Style Intelligence is business intelligence software for dashboards, reporting, and analysis. It blends enterprise strength with a small, 100% Java footprint. Unlike traditional BI dashboard tools, StyleBI does not require specialized BI skills or consultants to implement or use. Patent pending Data Block technology is the foundation for StyleBI's flexible and high performance data access...

BI Dashboard Solution Examples - Since 1996, InetSoft's dashboard software StyleBI uses a visualization-driven approach to enable rapid deployment of business intelligence dashboards. They are business user-driven and offer strong analytic functions. Dashboard software has been established as a highly effective business intelligence tool. Our dashboards can be monitoring-oriented or analysis-oriented and are a foundation of performance management software...
Better Business Intelligence for Government - Dashboards and reports must demonstrate how public funds are being spent along with the effectiveness of particular programs. While the IT budget for many of those agencies has increased, efficiency remains the key driver for any IT project. InetSoft's powerful and flexible business intelligence application is well suited to meet those requirements...
Create Prototype Reports for Testing - Users of InetSoft's reporting software can create prototype reports that can serve as a preliminary test before long-term changes are induced. View the information below to learn more about the StyleBI solution....
Custom Company Dashboards - This section discusses several ways that you can modify the overall appearance of a Dashboard. These include alterations you can make to the Viewsheet grid, and the use of tabbed controls and nested Viewsheets. It is possible to alter the Viewsheet grid by inserting or deleting cells, rows, and columns. You can also resize the grid rows and column, and make the grid invisible...

Customizable Analytic BI Tools - Are you looking for the best analytic BI tools? Since 1996 InetSoft has been making BI software that is easy to deploy and easy to use. Build self-service oriented dashboards and visual analyses quickly. InetSoft's data mashup engine solves the data access and transformation challenges that other tools cannot. View a demo and read customer reviews...
Dashboard Builder for MS Access - Searching a Microsoft Access dashboard builder? InetSoft offer free and commercial Web-based dashboarding software that connects to MS Access and other data sources. The drag and drop designer makes design easy and quick. The chart engine makes attractive looking charts, and the toolbox includes many choices of dashboard components like gauges and speedometers...
Dashboard Design Step by Step - To set an element as a Primary Assembly, right-click the element and select'Set As Primary' from the context menu. To disable the Primary setting for an element, select 'Clear Primary' from the right-click context menu...
Dashboard Visualization and Analysis Features - Multi-dimensional charting is the ability to depict more than two dimensions on a graph by simultaneously representing points through various shapes, sizes, or colors. This enables users to create 3d, 4d, or even 5d charts...

Dashboards for Exploring - . Interacting with charts . Using dashboard filters . Using selection lists . Using range sliders...
Data Mashup Engine Can Access - InetSoft's data mashup engine can access almost any data source. This ranges from spreadsheet files, relational databases, data warehouses, big data storages, all the way to on-premise or cloud-based applications that use JSON and REST API...
Design an Interactive Dashboard - Next is a little preview of what it's like to create an interactive dashboard. Again it's a drag & drop environment where you are dragging over different elements like speedometers and charts and just dragging, dropping a field that you want to show up on a speedometer and really within a few minutes, you will see how quickly you can build a very usable interactive dashboard...
Develop a Business Intelligence Methodology - We have developed a business intelligence methodology that focuses on the business strategy and help customers focus on that. This is what I want to take you through today because we believe that building a solid BI strategy is vital to your success. So, we have seen many BI implementations, and we believe that we have the expertise to help you with the BI strategy development...

Form Sophisticated Dashboards - InetSoft's dashboard software is setup for users to create viewsheet dashboards, a simple process that can be used to form sophisticated dashboards in a matter of minutes...
Fraction of the Cost of Big BI - InetSoft's business intelligence platform has the robust features of the "Big BI" firms at a fraction of the cost. InetSoft's BI features: Streamlined table and section binding, instant chart calculations, query trap handling, custom viewsheet scripting, advanced scheduling, accessible offline viewsheets, and much more. Best of all, users are able to run these features from a totally redesigned customizable desktop interface that anticipates a marked improvement in usability and work-flow...
Free Cloud-based BI Tool - Are you looking for free business intelligence software? InetSoft offers a version of its commercial BI software that requires no download. This cloud-based BI tool is called Visualize Free. Upload your xls or csv file and use the intuitive BI analysis creator to make interactive visual analyses with advanced chart types...
Good Data Dashboard Designs - Searching for the best dashboard designs? InetSoft provides many examples to learn from, demonstrating consistency across chart elements and pleasing color palettes...
Graph Visualization Software Application - Looking for a graph visualization software application to plot your data in a visually comprehensible manner? InetSoft's dashboard software combines all common styles of graphing with interactive filtering, allowing you to comb your data for new insights into patterns and trends...
How to Customize Dashboards - The next enhancement has to do with being able to customize dashboards. This is particularly geared to developers. Now you have even more controls over how that dashboard behaves with respect to the interactivity that you can give to it...
InetSoft's BI Query Tool - With this tool, non technical users can create queries by adjusting visual elements, opening up the world of query to all who desire to use it. InetSoft's BI query tool automatically optimizes the underlying queries for the quick retrieval of data...
Info about Dashboard Development Tools - Looking for good dashboard development tools? InetSoft's pioneering dashboard reporting application produces great-looking web-based dashboards with an easy-to-use drag-and-drop designer. View a demo and try interactive examples...
Operational BI Measure Dashboards - Operational BI measures and drives daily business activities. It is used by managers as well as front line workers. It typically consists of components such as business activity monitoring, enterprise reporting, and ad hoc reporting. What's unique about operational BI is that it must be able to drill down to a very detailed level, such as an individual line item...
Providing the Best Flexible Dashboard - Searching for the most flexible data dashboard software and reporting business intelligence tool? InetSoft's StyleBI is a flexible and powerful reporting business solution...
Report Writer Product - Looking for report writer software? InetSoft offers Web-based reporting software that includes an easy drag and drop designer and powerful production reporting features. Free evaluation download. View a demo. Read customer reviews...
Searching For Performance Dashboard Examples? - A performance dashboard is a business management tool that will allow a business to keep track of all aspects of their daily activity. Below are examples of performance dashboards built with InetSoft's easy-to-use dashboard software. For example, the sales performance dashboard is able to track your sales on the east coast and compare them with your sales on the west coast...

Show Some Business Dashboard Examples - Below are examples of business dashboards built with InetSoft's business dashboard software, some of which you can try out with the free downloadable 5-day evaluation copy of Style Intelligence...
Software for Scheduling Custom Reports - InetSoft's interactive reporting software gives users the power to schedule custom reports for mass or segmented audiences, providing a powerful distribution tool. View the example below to learn more about the StyleBI solution...
Steps for Creating a Dashboard - Upload your own data from an excel or CSV into the program. Save your dataset in your personal folder(the application will create a folder for you automatically). After clicking "create dashboard", give the dashboard a name and select the dataset you just saved. Then pick a name for your dashboard, also selecting your personal folder as the location. From there, you'll see how easy it is to drag out different dashboard elements to create a visualization from your own data...
Tools That Visualize Key Metrics - A BI dashboard or business intelligence dashboard software are tools that visualizes key metrics, statistics, or any kind of data for the purpose of generating insights. Many BI users struggle with the problem of poor BI dashboard design software and delivery. A poorly designed data visualization can work against the main purpose of BI, which is to attain accurate fact-based insight into the strategic or tactical performance of an organization. In this post, we aim to understand this potentially disastrous situation and provide some useful dashboard design ideas that can help draw the attention of organizations towards dashboard design best practices...

Try Business Dashboard Examples - Below are examples of dashboards built with InetSoft's Web dashboard software, some of which you can try out with the free downloadable 5-day evaluation copy of StyleBI...
Which is the Best Web Based Reporting System? - Looking for the best web based reporting system? Since 1996 InetSoft has been offering an award-winning Web-based reporting system that generates everything from paginated reports to interactive dashboards. Check out evaluation resources to the left and additional relevant articles below...
Who Offers the Best Dashboard Creator? - InetSoft's dashboard creator is flexible; it offers a simple drag-and-drop interface for less technically inclined users as well as complex scripting capabilities for IT and programmers. Because of this malleability, the tool's applications can be quite varied...
Winning Business Reporting Tool - InetSoft's Business reporting tool is a software providing for the creation of production reports and ad hoc reports that drive business activities. Professionals need a powerful authoring tool to manage business logic, manipulate data, and present information effectively. Business users also need flexibility when extending the IT department's pre-built reports and when utilizing self service reporting...