What is an Ad Hoc Report?
An ad hoc report is a report that is created on demand for unanticipated business questions. In contrast to a production report that is pre-designed for known business questions, ad hoc report requirements exhibit noticeably different characteristics:
| Ad Hoc Report | Production Report | |
| Report Creators | Self-service business users | IT oriented developers/analysts |
| Data Preparedness | No ready support | Well prepared. May even be supported by a data warehouse |
| Output Requirement | From paginated to visual analytic reports | Paginated reports |

Ad Hoc Report Uses
Ad hoc reports are often also used to meet analytic requirements. In these scenarios, the business question is not only unanticipated but also not well defined. For example, a sales manager may try to find the root cause of the sudden popularity of a particular product. For analysis oriented ad hoc reports, the key requirements are the ability to:
- Quickly switch perspectives and parameters for exploration
- Intuitively detect patterns or trends in the graphic or visualization
- Easily navigate and mashup multiple data sources when required
- Scale to big data if mashup and/or analytic scope requires it
Ad hoc reports are usually created for a single use. However, valuable ad hoc reports often turn into useful long-term assets. The sales manager may want to schedule the report or to repeat the analysis on an on-going basis. It also may become worthy of sharing with other users.
SAFE(simple, adaptable, flexible and endurable) are four defining properties of a robust ad hoc reporting solution:
- Simple to learn: power users and casual users can all maximize their self-service
- Adaptable to use: user can adapt it from a traditional ad hoc report to a tool for visual analytics
- Flexibility on data: transform, mashup and scale with ad hoc assembled data
- Endurable for long term: ad hoc outputs are ready to be used for long term purposes
RenalTech Services Moves from NetSuite to StyleBI for Ad Hoc Reporting
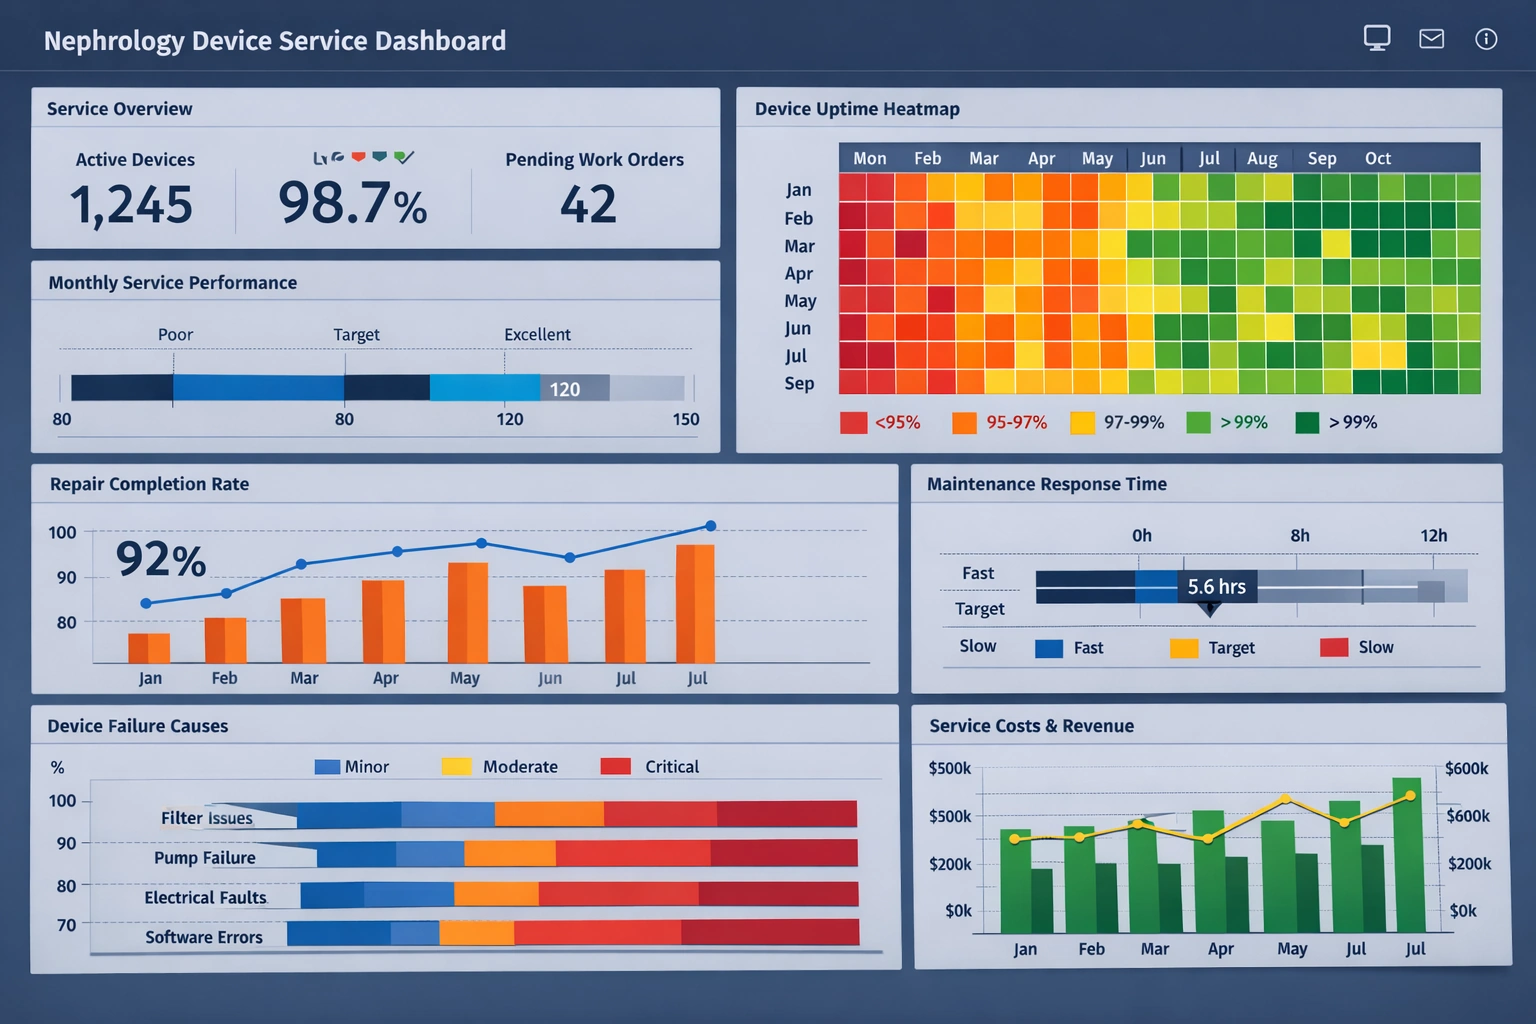
RenalTech Services maintains thousands of hemodialysis machines, peritoneal dialysis cyclers, CRRT systems, and water treatment equipment across North American dialysis centers and hospitals. Every day, their technicians complete hundreds of preventive maintenance visits, emergency repairs, and compliance calibrations. Behind this field operation sits a constant need for fast, accurate, custom reports: which device models are failing most often in specific regions? How quickly are technicians resolving high-priority calls? Which parts inventory is trending toward shortage before the next quarter?
Until mid-2025, the company answered these questions primarily through Oracle NetSuite. NetSuite handled core ERP duties—financials, service order management, inventory tracking, purchasing, and customer contracts—reasonably well. Its saved searches and basic reporting features covered standardized monthly and quarterly outputs. However, anything outside those predefined paths became painful.
Where NetSuite Reporting Started Breaking Down
The first serious friction appeared when service managers wanted to analyze patterns that crossed module boundaries. A typical ad hoc request looked like this: “Show me all CRRT machines serviced more than three times in the last six months, grouped by hospital, including total parts cost, average resolution time, and the primary technician involved—only for units located in the Midwest.” NetSuite users could eventually build such a report using multiple joined saved searches, but the process frequently required:
- Twenty to forty minutes of trial-and-error criteria building
- Help from someone who understood SuiteScript or advanced search syntax
- Export to Excel followed by manual pivoting and VLOOKUP cleanup
Performance degraded noticeably once the database contained more than four years of detailed service history. A report that took eight seconds in 2022 could take ninety seconds or more by early 2025. During peak months, when regional managers needed answers before daily stand-up calls, waiting became unacceptable.
Regulatory reporting added further pressure. Annual FDA and CMS audits require detailed proof of preventive maintenance schedules, calibration records, and corrective actions tied to specific device serial numbers. Auditors increasingly expect trend analysis (e.g., “Has the failure rate of model X increased since the supplier changed the pump membrane material in Q3 2023?”). NetSuite’s native tools offered limited support for time-series comparisons and almost no built-in visualization beyond basic charts.
Finally, the hidden cost accumulated. RenalTech spent roughly $180,000 annually on NetSuite consultants who built, optimized, and maintained custom reports and dashboards. That figure excluded the opportunity cost of internal analysts spending half their time acting as report translators for operations and sales teams.

Why StyleBI Became the Target Solution
After reviewing several business intelligence platforms during Q1 2025, the evaluation team selected StyleBI. Three characteristics drove the decision:
- Self-service ad hoc speed — Users build complex reports by dragging fields onto a canvas. No scripting required. Natural language query handles most English-language questions (“Which dialysis centers have had more than two unscheduled downtime events this year?”).
- Native, real-time NetSuite connector — StyleBI pulls data directly through NetSuite’s REST API without nightly ETL jobs or duplicate data stores. Service orders, inventory transactions, and financial postings stay current.
- Service-industry focus — Pre-built calculation libraries for MTBF, MTTR, first-time fix rate, technician utilization, and warranty recovery analysis fit RenalTech’s daily vocabulary immediately.
The licensing model also helped. StyleBI charged per named user rather than per report creator + viewer combination, making broad rollout across operations, field management, and finance economically viable.
Implementation Timeline
The project kicked off in April 2025 and reached production usage by October 2025.
Month 1–2: Data inventory and mapping. The team identified 47 critical NetSuite record types (service orders, inventory adjustments, technician time entries, customer sites, device assets) and approximately 280 fields that needed to be available in StyleBI. Security rules mirrored NetSuite role permissions.
Month 3: Pilot with twelve users (four regional operations managers, three inventory planners, two finance analysts, three IT staff). StyleBI consultants delivered two weeks of hands-on workshops. Pilot users built twenty high-value reports, including a live “Parts Consumption Forecast by Device Type” dashboard that became an instant favorite.
Month 4–5: Full data model refinement, mobile report optimization, and HIPAA-aligned row-level security. Historical service notes (free-text) were processed with StyleBI’s built-in text extraction to create categorical tags such as “membrane rupture,” “flow error,” or “alarm fatigue.”
Month 6: Staged rollout. Finance went live first (cost and margin reports), followed by operations (service performance), then field supervisors (mobile access to device history at the point of service). Training reached 340 users through recorded sessions, quick-reference guides, and weekly office hours.

Results After Three Months in Production
By January 2026, measurable improvements are visible across several dimensions:
- Average time to create a new ad hoc report dropped from 45 minutes to under 4 minutes.
- IT/reporting support tickets related to custom analytics decreased by 82%.
- Parts stock-out incidents fell 28% after inventory planners started using weekly trend reports with automatic low-stock alerts.
- Mean time to resolve high-priority service calls improved by 17%, partly because dispatchers can now see real-time technician skill matrix and travel time estimates within the same interface.
- Annual external consulting spend on reporting dropped by approximately $145,000 (projected full-year savings).
Qualitative changes are equally significant. Regional managers now start most Monday meetings by pulling the latest StyleBI dashboard rather than waiting for Friday’s static PDF. Field technicians increasingly reference device service history on tablets while on-site, reducing repeat visits for the same unresolved issue. Sales representatives use customer-specific trend reports during renewal discussions, showing concrete uptime improvements after RenalTech took over servicing contracts.
Looking Forward
RenalTech plans to activate StyleBI’s machine learning anomaly detection module in Q2 2026. The goal is to flag unusual failure clusters earlier (e.g., a sudden spike in pressure valve faults across multiple clinics in the same water district). Longer term, the company is exploring integration with IoT telemetry feeds from newer dialysis machines, allowing predictive service recommendations before devices even log a fault code.
The move from NetSuite’s built-in reporting to StyleBI has not eliminated the ERP system; it has liberated it to focus on what it does best while giving every department fast, flexible answers to questions that change daily in the nephrology service world.

More Articles About Ad Hoc Reports
- What Is An Ad Hoc Report
Begins with a definition of ad hoc reporting as on‑demand, unanticipated query‑based report creation, contrasting it with pre‑built production reports. Explains key characteristics such as self‑service by non‑technical users, rapid generation, and flexibility of output formats. Discusses how such reports may evolve into reusable assets over time. - Ad Hoc Reporting Self‑Service Visualization
Highlights InetSoft’s ad hoc reporting paired with self‑service visualization capabilities that empower business users to analyze data visually without needing developers. Describes support for intuitive data views, interactive dashboards, and document generation on the fly. Covers Data Block mashups and drag‑and‑drop customization in dashboards. - Integration‑Ready Ad Hoc Reporting
Focuses on a lightweight, integration‑ready web‑based ad hoc reporting engine ideal for embedding in cloud applications. Highlights real‑time data mashup, secure multi‑source connectivity, and browser‑based designer for drill‑down and collaboration. Emphasizes small‑footprint Java architecture for SaaS or OEM use. - Report Based Ad Hoc Analysis
Explores how ad hoc analysis integrates with structured reporting environments to enable dynamic, self‑service exploration from within canned reports. Shows how StyleBI allows end‑user defined data mashups, drag‑and‑drop OLAP access and layout tools. Emphasizes minimal training, low IT overhead, and scalability across users. - Cloud Flexible Ad Hoc Analysis
Describes InetSoft’s drag‑and‑drop ad hoc query builder and reporting tools intended for flexible, cloud‑based analytics. Explains how ad hoc analysis serves biotech and scientific use cases with real‑time exploration and preprocessing for machine learning. Highlights synergy between ad hoc analysis and automated feature engineering workflows. - Ad Hoc Analysis And OLAP Tools
Details the combination of ad hoc analysis with OLAP cube access, enabling users to explore multi‑dimensional data interactively. Covers supported operations such as joins across domains, grouping, filtering, and point‑and‑click drill‑downs. Advocates self‑service mashup powered by minimal IT support and high performance. - Try InetSoft Ad Hoc Reporting Tool
Introduces a zero‑client, browser‑based ad hoc reporting tool allowing fast creation of visual reports and dashboards. Highlights scale from laptop use to enterprise deployment and style‑flexible visualization templates. Notes fast onboarding and StyleBI’s adoption by thousands of organizations. - Creating Ad Hoc Reporting Columns
Explains how to define custom expression columns during ad hoc report creation via a wizard interface. Shows support for both SQL and JavaScript syntax for dynamic derived fields. Emphasizes flexibility in calculated metrics without needing backend ETL or schema changes. - Using Ad Hoc Reporting With SQL Server
Describes connecting InetSoft’s ad hoc solution to SQL Server with multi-source mashup, analytics dashboards, and alerting. Covers browser-based design, drill‑downs, export to PDF/Excel, and shared annotations/bookmarks. Highlights integration in cloud DevOps workflows and enterprise security support. - Ad Hoc Reporting Software Overview
Summarizes InetSoft’s overall ad hoc reporting capabilities across production and self‑service use cases. Describes Data Block mashup architecture, visualization integration, dashboards, and report layout flexibility via browser tools. Positions Style Intelligence™ as a unified suite for ad hoc and scheduled reporting alike.