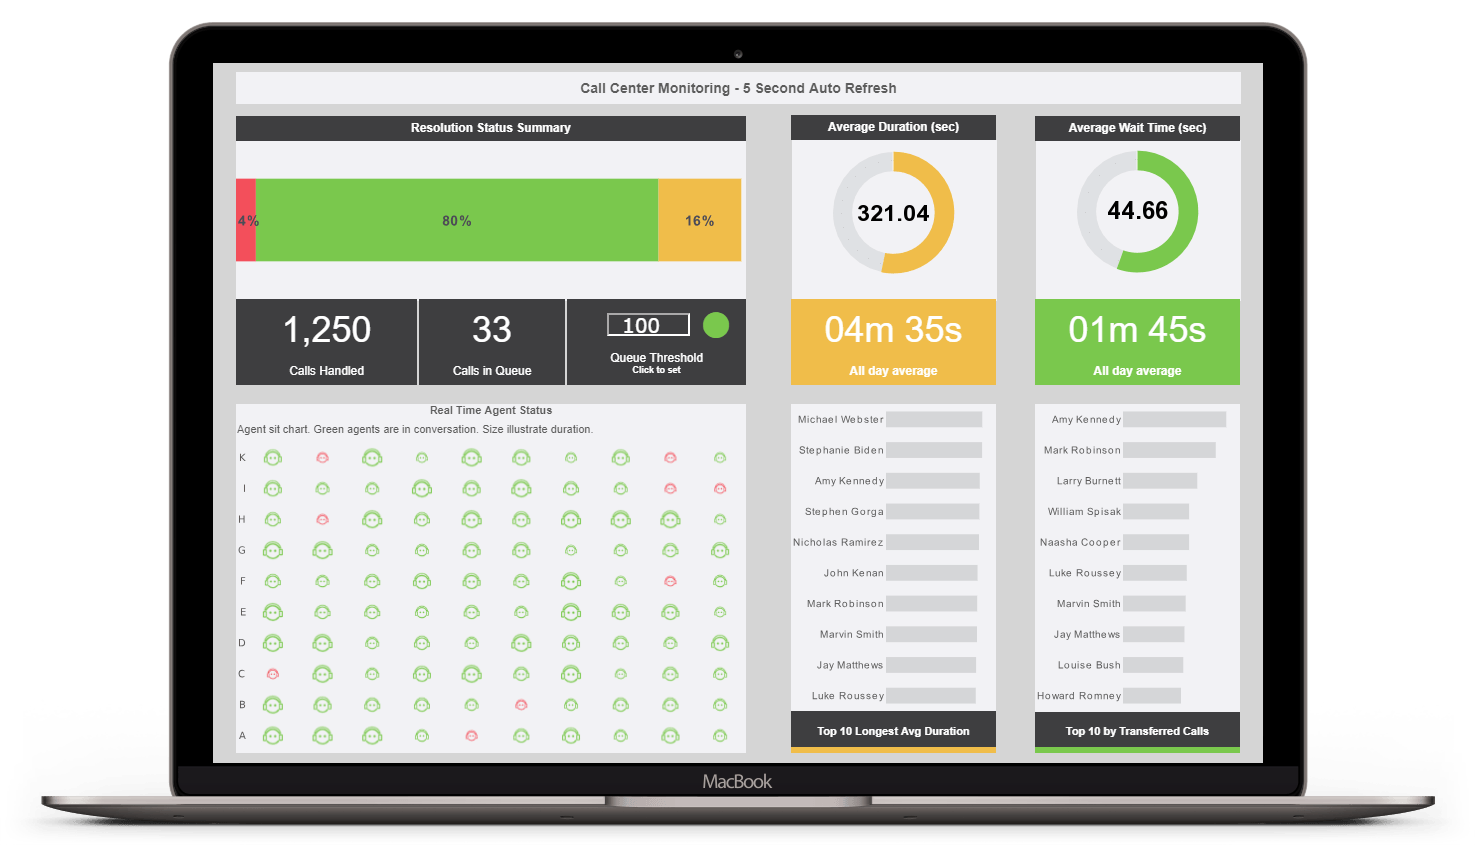
Operational Business Intelligence
InetSoft's visualization dashboards can be easily made to auto-refresh with real-time data. This BAM call center status dashboard updates in real time so managers can see how the overall calling queue compares to its set threshold. Moreover, each agent's call progress can be seen at a glance. Where attention may be needed, a big red face will indicate this to the manager.
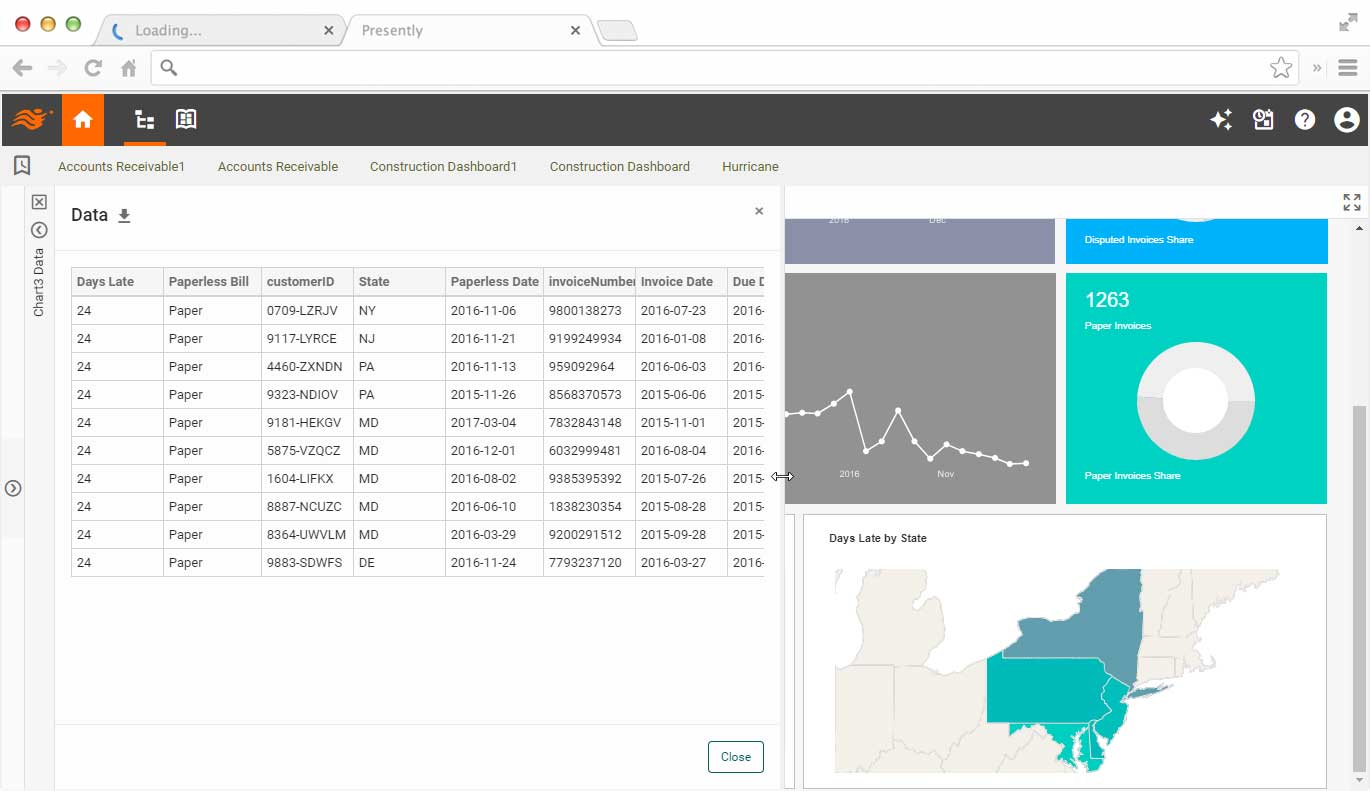
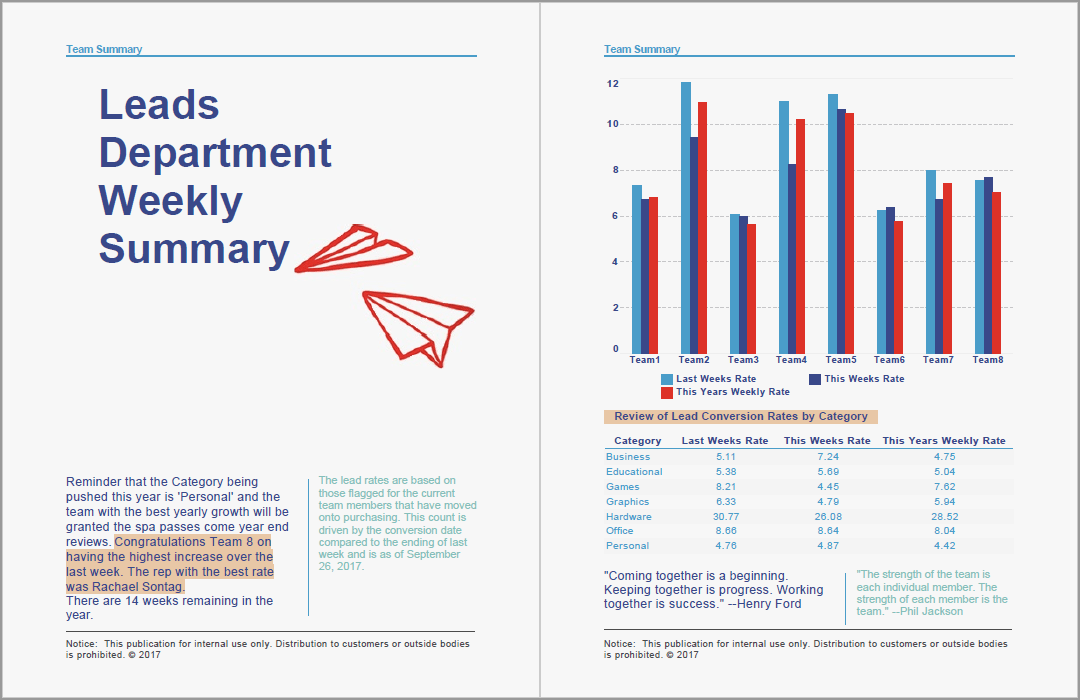
Data Mashup Based Online Analytics and Detailed Information Reporting
InetSoft's unique data mashup engine is the foundation for all of its reporting and analytics. Its visualizations and dashboards all allow for the drilling down into the most detailed level of information. InetSoft's document reporting is perfect for delivering a large volume of details to people on a schedule.
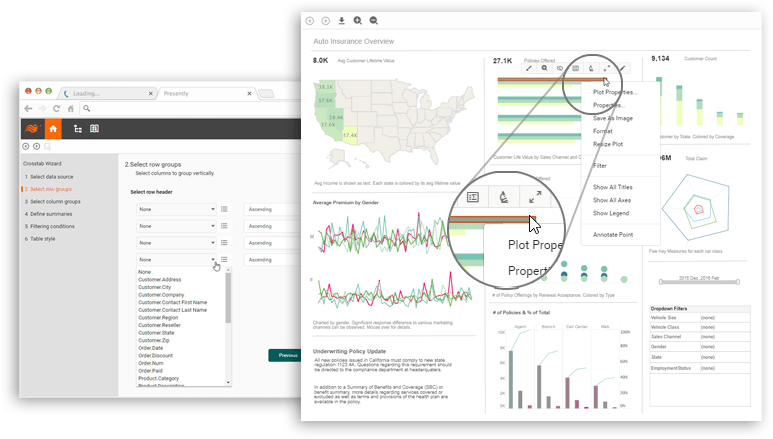
Business Users Self-Service
InetSoft's visualization dashboards are highly customizable. With minimum training, business users can completely change visual perspectives. Furthermore, business users can use the data wizard to create brand new reports.
How a Human-Powered Vehicle Manufacturer Switching from Splunk to StyleBI for Its Operational Business Intelligence Solution
The market for human-powered vehicles (HPVs) is a specialized niche that requires careful attention to production efficiency, supply chain management, product quality, and market trends. Manufacturers in this field produce pedal-powered cars, tricycles, recumbent bikes, and other human-propulsion-based transport solutions, often with a focus on sustainable transportation and recreational products. For the Human-Powered Vehicle Manufacturer, gaining a complete view of operations and optimizing business performance has become increasingly critical. Historically, the company relied on Splunk for operational analytics and monitoring, but as its data needs grew in volume and complexity, it became apparent that a more flexible and visually intuitive solution was required. After evaluating several options, the company switched to InetSoft’s open-source StyleBI platform to serve as its Operational Business Intelligence (OBI) solution.
One of the primary drivers for switching from Splunk to StyleBI was the need for more interactive and user-friendly dashboards. While Splunk provided powerful log aggregation and search capabilities, the Human-Powered Vehicle Manufacturer found it challenging to create dashboards that combined operational, production, and sales data in a cohesive, interactive format. StyleBI allows the company to build custom dashboards using a drag-and-drop interface, providing real-time visualization of KPIs across departments. For example, production managers can now monitor assembly line throughput, defect rates, and equipment uptime in a single dashboard, while executives can view high-level operational summaries with the option to drill down into granular data.
Production monitoring is one of the areas where StyleBI has had an immediate impact. Human-powered vehicles involve complex assembly processes that integrate mechanical, ergonomic, and safety considerations. By connecting to ERP systems, production machines, and quality control databases, StyleBI aggregates data in real time to monitor key operational metrics. Bar charts, line graphs, and gauge widgets display throughput rates, defect percentages, and average cycle times, while heat maps identify bottlenecks in assembly stations. This visibility allows production managers to respond proactively to slowdowns, identify recurring defects, and optimize resource allocation to maintain consistent output and quality.

Quality assurance is another critical area enhanced by StyleBI. Each human-powered vehicle undergoes rigorous testing to ensure durability, performance, and safety. StyleBI dashboards consolidate data from inspection reports, component test results, and customer feedback to provide an integrated view of product quality. KPI tiles track the number of units passing first-time inspections, failure rates per component, and repair turnaround times. Trend charts allow engineers to identify patterns over time, such as recurring issues with specific gear systems or pedal assemblies. This information supports continuous improvement and reduces the incidence of product recalls or warranty claims.
Supply chain management has also benefited significantly from the switch. The company sources specialized components such as lightweight frames, bearings, and advanced braking systems from multiple suppliers, some of which are international. StyleBI dashboards monitor supplier performance, delivery schedules, and inventory levels across multiple warehouses. KPI metrics such as lead times, order fulfillment rates, and stockout incidents are displayed in a visually intuitive format, while predictive analytics can forecast potential supply disruptions. By integrating supply chain data into operational dashboards, the company can proactively adjust orders, manage buffer inventory, and ensure uninterrupted production schedules.
Sales and marketing analytics are now fully integrated into the operational intelligence environment. Data from e-commerce platforms, dealer networks, and customer inquiries are visualized alongside production and inventory metrics. Interactive charts display regional sales performance, customer purchase trends, and product popularity. KPIs such as lead conversion rates, average order values, and repeat purchase behavior help the marketing team align campaigns with production capabilities. By combining operational and sales data in StyleBI, the company can anticipate demand spikes, adjust production plans, and optimize distribution strategies.

Customer feedback, a critical input for product development, is integrated into StyleBI dashboards to provide a holistic view of market reception. The platform aggregates online reviews, service tickets, warranty claims, and survey responses. Sentiment analysis visualizations help identify patterns in customer satisfaction, while funnel charts track the resolution of support issues. For example, if multiple customers report difficulty with a particular gear mechanism, engineers can prioritize design improvements, and the marketing team can proactively provide guidance to dealers. This integration of customer feedback into operational intelligence fosters rapid response and continuous product enhancement.
Financial and operational metrics are closely monitored through StyleBI’s dashboards. By connecting the finance ERP system with production, supply chain, and sales data, the company can assess profitability, cost per unit, and margin trends across different vehicle models. KPI tiles highlight budget variances, R&D expenditure efficiency, and overall operational costs. Trend analyses reveal whether particular assembly lines or product categories are underperforming financially. This comprehensive financial oversight allows executives to make strategic decisions regarding pricing, production scaling, and resource allocation.
Predictive analytics is a standout feature of StyleBI that supports operational planning. Historical production data, customer demand trends, and component delivery records are analyzed to forecast future production requirements and identify potential risks. Scenario modeling capabilities simulate the effects of supply disruptions, labor shortages, or sudden demand spikes. For example, the platform can project the impact of launching a new tricycle model on production schedules and inventory requirements. This forward-looking insight allows the company to act proactively, mitigating risks and maximizing operational efficiency.

Collaboration across departments has improved significantly since the transition to StyleBI. Production engineers, quality managers, supply chain planners, and marketing professionals now have access to shared dashboards with relevant KPIs. Self-service analytics enable teams to explore data, run ad-hoc queries, and test hypotheses independently, reducing reliance on IT for routine reporting. Role-based access ensures that sensitive data, such as supplier contracts or payroll, is restricted while still enabling cross-functional collaboration on operational metrics. This democratization of data fosters a culture of evidence-based decision-making across the organization.
Real-time monitoring capabilities are particularly valuable for field operations, where vehicle deliveries, maintenance schedules, and dealer performance must be tracked continuously. Mobile-accessible dashboards allow supervisors and sales teams to view KPIs and receive alerts on tablets or smartphones. Notifications can be configured for critical thresholds, such as late deliveries, production delays, or warranty claim spikes. The immediacy of these insights ensures rapid intervention and maintains customer satisfaction.
StyleBI’s data visualization capabilities have transformed how the company interprets operational information. Complex datasets, including production logs, quality inspections, supply chain records, and sales data, are presented through interactive charts, maps, and tables. Drill-down functionalities allow users to explore individual batches, components, or dealer performance. By translating raw data into intuitive visual formats, StyleBI empowers decision-makers to quickly identify trends, anomalies, and opportunities for improvement.