Enterprise Data Mashup Maintains Reporting Consistency While Retaining Flexibility
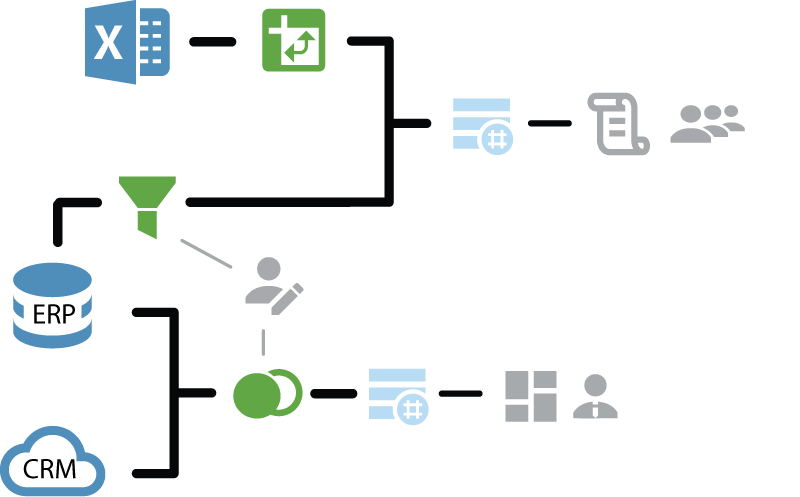
InetSoft's data mashup technology maintains data lineage for core corporate data. In many cases, it can even replace an IT-heavy data warehouse. But it still allows lower level users to mashup their own databases and Excel files with core data. Regardless of whether the data is in-cloud or on-premise, stored in a data warehouse or databases, data mashup can draw in the data in real time or build a high speed cache for fast retrieval.

Online Dashboards For the CEO and the Front Line, Offline Reports Delivered to Customers and Agencies
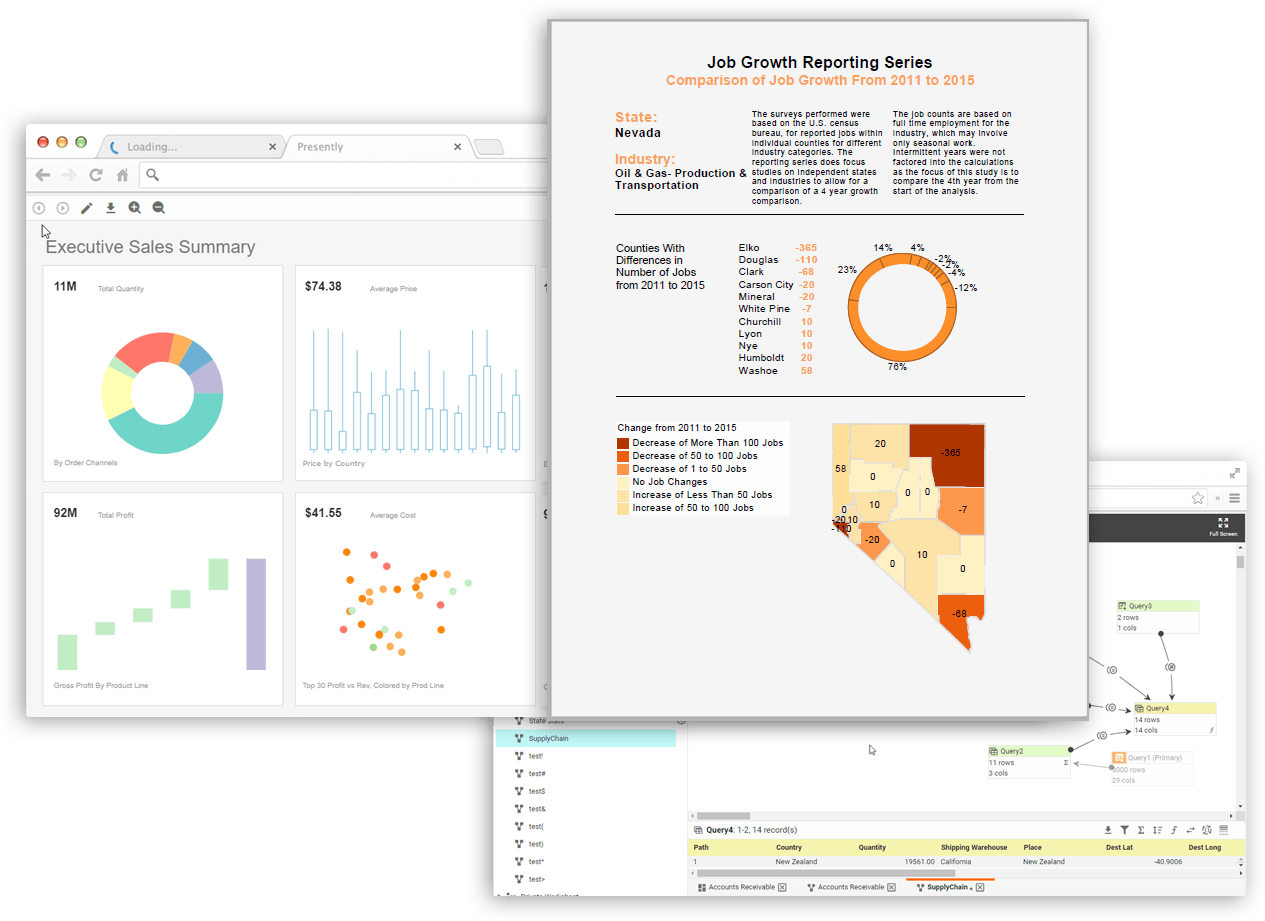
Enterprise reporting has a widely diversified user population. InetSoft's highly customizable dashboard reports give CEO's a 30,00 foot view and provide front line business users action-oriented visual reporting. Document-oriented reporting allows further delivery flexibility, especially for customers and external agencies.

How a Graphene Coatings Specialist Switched from Bold Reporting to InetSoft for Its Enterprise Reporting Tool
In the advanced materials sector, data precision and visibility are critical. A Graphene Coatings Specialist, producing high-performance graphene-based coatings for applications ranging from electronics to aerospace, found itself facing a growing challenge: its reporting infrastructure could no longer keep up with the complexity and volume of operational, production, and R&D data. The company had relied on Bold Reporting, a lightweight reporting solution, for several years. While it handled basic operational reports adequately, Bold Reporting began to show limitations as the firm expanded its production lines, introduced new graphene formulations, and sought to integrate data from multiple sources across research, quality, and manufacturing functions. This led the company to evaluate and ultimately adopt InetSoft as its enterprise reporting tool, a move that transformed its data visibility, analytics capability, and operational efficiency.
The Complexity of Graphene Coatings Data
Graphene coatings involve a host of precise chemical and physical properties that must be carefully monitored during production. Each batch requires tracking of raw material characteristics, coating thickness, adhesion properties, conductivity, thermal performance, and surface uniformity. These measurements are captured in high-resolution datasets generated by laboratory instruments, sensors on production equipment, and automated inspection systems. Additionally, production schedules, batch histories, and quality control logs reside in enterprise resource planning (ERP) systems, while customer specifications and project requirements are often managed in customer relationship management (CRM) systems. Bringing all of this data together for meaningful reporting posed a challenge for the Graphene Coatings Specialist, especially given that Bold Reporting lacked the flexibility for complex data mashups and multi-source integration.
Limitations Experienced with Bold Reporting
Although Bold Reporting offered a user-friendly interface for basic report creation and distribution, the company quickly identified several limitations that hindered operational and strategic decision-making:
- Limited Data Integration: Bold Reporting was primarily designed to pull data from single sources. Integrating laboratory instrument outputs with ERP and CRM data required manual exports and consolidation in spreadsheets, increasing the risk of errors.
- Static Reports: Reports were largely pre-formatted and lacked interactivity. Managers and engineers could not drill down into underlying data, nor could they filter views dynamically to explore trends in production or R&D performance.
- Scaling Challenges: As production expanded and more instruments and sensors were deployed, report generation times increased dramatically, leading to delays in batch certification and internal decision-making.
- High Maintenance Overhead: Updating and distributing multiple report templates across departments consumed significant IT resources, diverting attention from higher-value analytical work.
These constraints became more pronounced as the company expanded its client base, added new coating lines, and undertook R&D projects requiring real-time performance monitoring and detailed batch analysis. The management team recognized the need for a modern enterprise reporting platform that could seamlessly integrate multiple data sources, provide interactive dashboards, and scale with the organization’s growth.
Why InetSoft Was Selected
During the evaluation phase, the Graphene Coatings Specialist compared several enterprise reporting and business intelligence platforms. InetSoft stood out for several reasons:
- Comprehensive Data Mashup: InetSoft’s platform allowed the IT team to combine structured and unstructured data from laboratory instruments, ERP, CRM, and cloud-based storage systems into a unified reporting schema.
- Interactive Dashboards: Engineers, production managers, and quality analysts could create or explore dashboards in real time, drill into batch-level data, and apply dynamic filters to assess coating performance trends.
- Embeddability and Customization: InetSoft could be embedded into the company’s existing internal portal, providing a consistent interface and enabling single sign-on across departments.
- Scalability and Performance: The platform’s in-memory processing engine ensured rapid query execution and visualization, even as the volume of measurement data increased with new production lines.
- Predictable Licensing and Cost Efficiency: InetSoft offered a licensing model that was more predictable than Bold Reporting, which relied heavily on per-report or per-user pricing that escalated as reporting demands grew.

Implementation and Migration
The migration from Bold Reporting to InetSoft was carefully planned and executed over a three-month period. Key steps included:
- Data Source Mapping: IT engineers cataloged all relevant data sources, including laboratory measurement systems, ERP modules, CRM records, and historical spreadsheets. Each data source was analyzed for compatibility and integration complexity.
- Data Mashup Design: Using InetSoft’s mashup tools, the IT team built a unified data model capable of supporting complex joins, aggregations, and calculated fields. This included formulas for coating thickness averages, thermal conductivity distributions, and adhesion test results.
- Dashboard Development: Production, quality, and R&D teams collaborated with IT to design interactive dashboards. Common dashboards included batch performance metrics, instrument calibration tracking, trend analysis of coating properties, and customer-specific project dashboards.
- Training and Change Management: Staff received training on building and interacting with InetSoft dashboards. The company emphasized self-service capabilities, enabling engineers to explore data without IT intervention.
- Validation and Parallel Run: For a month, both Bold Reporting and InetSoft were run in parallel to validate data accuracy and performance. Discrepancies were resolved, and users gradually transitioned to InetSoft as the primary reporting platform.
Operational Benefits Achieved
The transition to InetSoft brought significant improvements across multiple dimensions of the company’s operations:
- Faster Reporting Cycle: Batch reports that previously required hours of manual data consolidation were now generated in minutes, with live updates from laboratory and production systems.
- Enhanced Analytical Capability: Engineers could drill into individual measurement points, compare multiple production runs, and perform trend analyses that were previously impossible within Bold Reporting.
- Improved Collaboration: Dashboards were accessible across departments, ensuring that R&D, production, and quality teams worked from the same data and avoided duplication of effort or misaligned interpretations.
- Reduced IT Overhead: Centralized reporting and self-service dashboard capabilities reduced the need for IT staff to maintain multiple report templates or respond to ad-hoc data requests.
- Customer Transparency: Clients could access interactive reports showing coating performance for their specific orders, enhancing trust and providing an added service differentiator.
- Scalability: As the company expanded production lines and instrument installations, InetSoft’s in-memory engine handled increased data volumes without performance degradation.
Strategic and Long-Term Impact
Beyond operational efficiencies, the switch to InetSoft positioned the Graphene Coatings Specialist for long-term strategic growth. The unified reporting platform enabled predictive analytics initiatives, such as modeling batch yield rates, identifying potential production bottlenecks, and forecasting maintenance requirements for coating equipment. R&D teams could also analyze experimental formulations and process parameters more efficiently, accelerating innovation cycles.
Moreover, InetSoft’s platform supports integration with AI and machine learning models, allowing the company to explore future possibilities like real-time defect prediction, coating property optimization, and automated client reporting. The combination of interactive dashboards, flexible data mashups, and scalable infrastructure has transformed reporting from a back-office chore into a strategic enabler for growth, innovation, and customer satisfaction.

