SAP Dashboard Reports
InetSoft's business intelligence software for dashboards, reports, and data mashups can access many open standards data sources plus some proprietary ones such as SAP. InetSoft's BI application makes a good option if you are looking to:
Upgrade Your Dashboards and Reports for Your SAP Modules
For any of the modules you may be using, you may be dissatisfied with the level of interactivity or the visual appeal of the built-in dashboard and reporting capabilities provided by SAP. Similarly you may want to improve the reporting from the data marts in your SAP Business Information Warehouse (SAP BW) or the OLAP cubes in your SAP NetWeaver. InetSoft is a specialist and pioneer in the area of highly engaging, user-friendly HTML5-based visualizations and dashboards that are easy to develop and personalize.
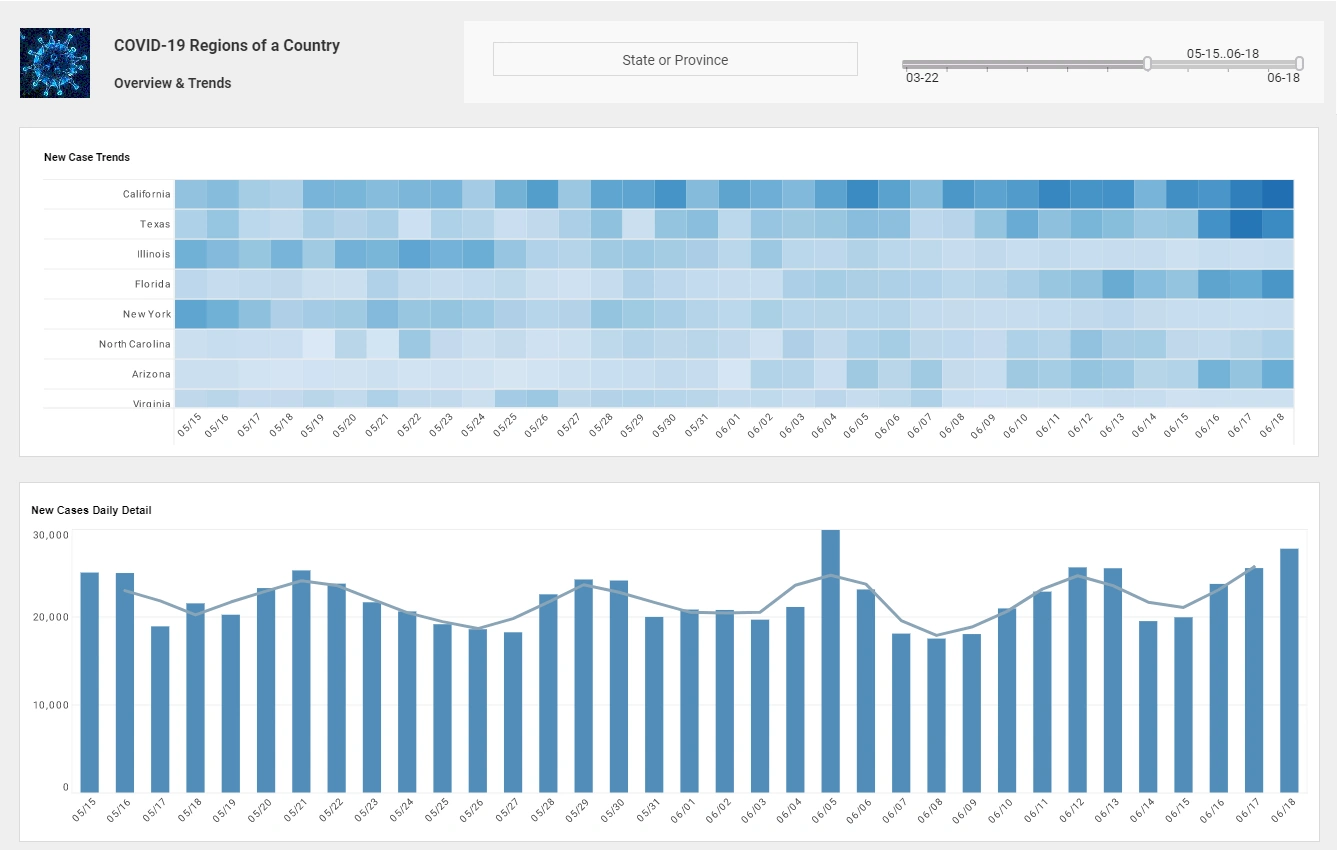
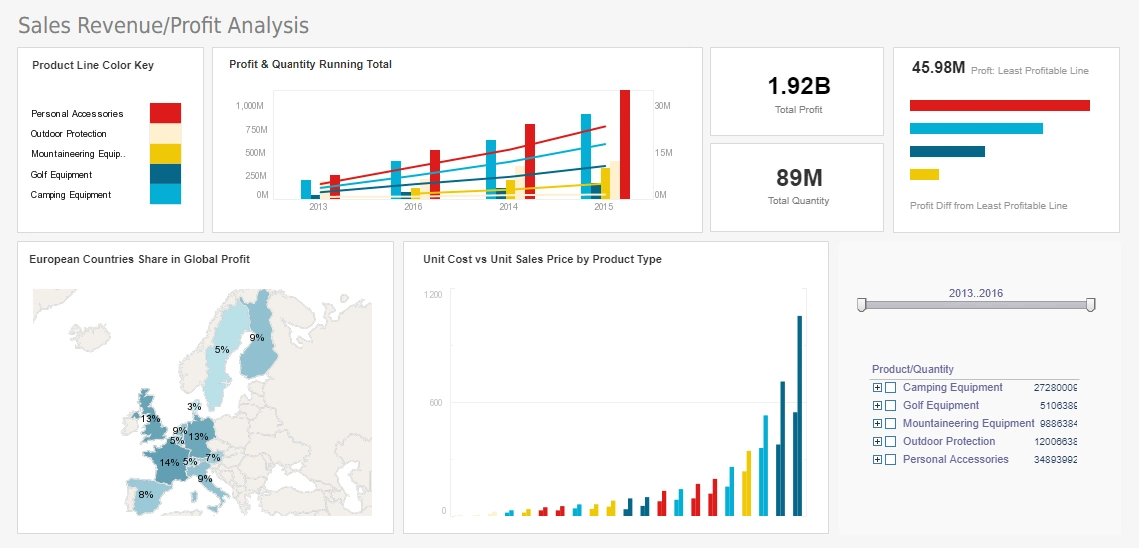
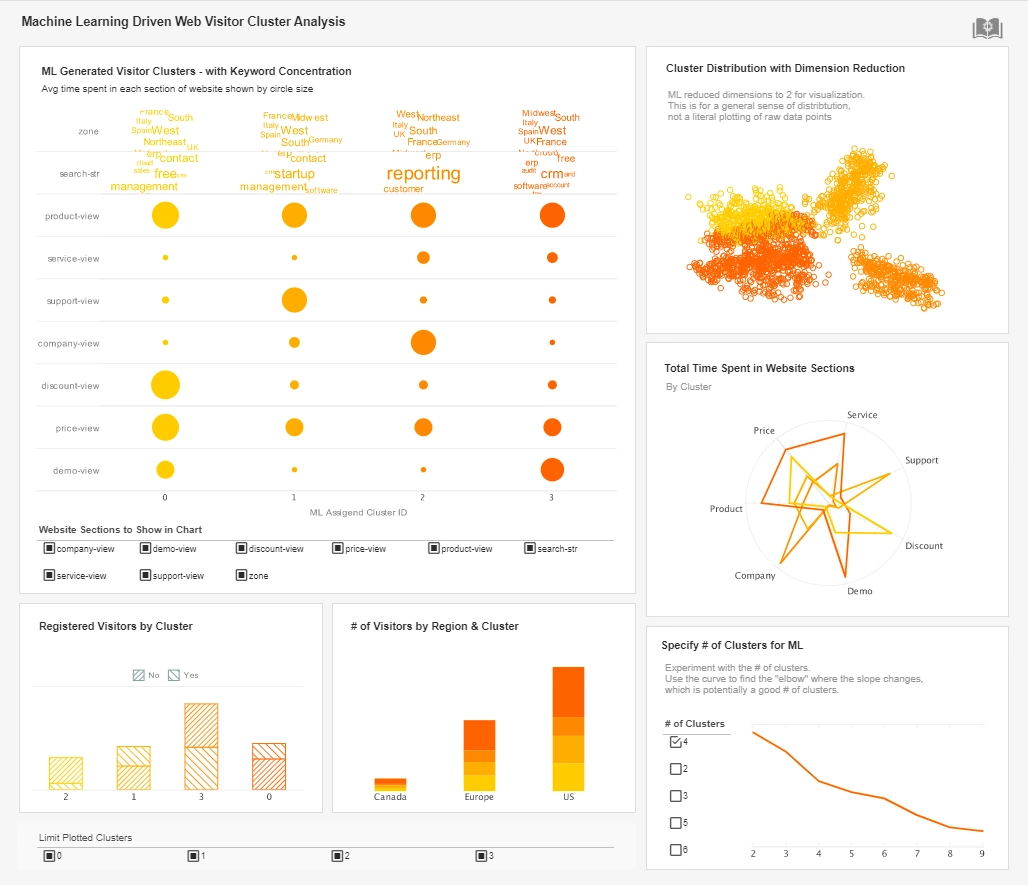
StyleBI is a small-footprint Java-based business intelligence server that enables rapid development and deployment of monitoring and analytical dashboards such as this.

Compared to the option of adding SAP's Business Objects dashboard suite, you will likely find InetSoft's solution more agile, easier to learn and deploy, and more flexibly and affordably priced.

Create Data Mashups of Your SAP Data
and Other Enterprise Data
Another strong point for InetSoft's business intelligence software is support for data mashups. You can combine data from your SAP modules with almost any other data source you have in your organization such as: relational databases (JDBC), multi-dimensional databases, XML, SOAP, Java beans (POJO), EJB beans, flat files, Microsoft Excel spreadsheets, OLAP cubes, PeopleSoft, JD Edwards, and Siebel CRM.
InetSoft also offers unique capabilities in the area of data mashup. Business end-users can create their own mashups with whatever data you expose to them combining different data sources that have not been previously modeled for them.
It is also possible for users to bring in their own data sets such as those in local spreadsheets or those provided by external partners and then share the dashboards or reports based on them, inside the corporate BI environment.
Supported SAP Data
StyleBI can access data from any of the following SAP modules: Administration Module, Financials Module, Sales Opportunities Module, Sales Module, Purchasing Module, Business Partners Module, Banking Module; Inventory Module, Plant Maintenance Module, Production Module, MRP Module, Service Module, Human Resources Module, E-commerce Module, and WebCRM Module; as well as data marts in SAP Business Information Warehouse (SAP BW) and OLAP cubes in SAP NetWeaver.
So whether it is providing better marketing campaign management analyses, or creating a unified view of equipment downtime, workforce production hours, and maintenance labor from the Production Planning and Plant Maintenance modules, you will be able to deliver the dashboards or reports your business needs.
Limitations of the Dashboards and Reports That Come with SAP
SAP is one of the most widely used enterprise resource planning (ERP) systems globally, providing organizations with extensive capabilities for finance, logistics, human resources, and operations management. A key component of SAP’s value proposition lies in its dashboards and reporting tools, which are designed to deliver insights and help managers make informed decisions. While SAP offers a wide range of reporting options—from classic SAP GUI reports to SAP Fiori analytical apps and SAP BusinessObjects dashboards—these tools have notable limitations that can affect usability, flexibility, and the speed of decision-making.
1. Complexity and Steep Learning Curve
One of the most frequently cited limitations of SAP dashboards and reports is their inherent complexity. SAP’s reporting tools often require specialized knowledge to design and maintain, including understanding underlying data structures, tables, and query languages. Classic SAP reports rely heavily on ABAP programming or custom queries, which means non-technical users are largely dependent on IT or specialized analysts. Even with SAP Fiori apps, users often need training to navigate the dashboards effectively, which can slow adoption and limit the democratization of data within the organization.
2. Limited Flexibility and Customization
While SAP provides pre-built dashboards and standard reports for common business processes, the customization options can be restrictive. Modifying standard reports to meet unique business requirements often requires development work, complex configuration, or additional licenses for SAP BusinessObjects or SAP Analytics Cloud. For example, users may want to adjust KPI calculations, combine multiple data sources, or create advanced visualizations — tasks that can be difficult or time-consuming in SAP’s native tools. This limitation reduces the agility of organizations to respond to changing business needs quickly.
3. Performance Issues with Large Data Sets
SAP systems often handle massive volumes of transactional data across multiple modules, which can pose performance challenges for dashboards and reports. Classic SAP reports or dashboards that query live transactional tables can experience slow load times, especially when multiple users are accessing data simultaneously. Even with SAP HANA’s in-memory computing capabilities, poorly optimized queries, excessive joins, or complex calculations can result in sluggish performance. This can impact decision-making, as managers may be forced to wait for reports to load or rely on pre-aggregated snapshots instead of real-time insights.

4. Limited Advanced Analytics Capabilities
SAP’s standard reporting tools are primarily designed for descriptive analytics—they show what happened historically—but they lack built-in predictive or prescriptive analytics capabilities. While SAP Analytics Cloud and third-party extensions provide machine learning and predictive modeling features, the dashboards that come out-of-the-box with SAP ERP do not offer advanced forecasting, anomaly detection, or simulation tools. Organizations that wish to leverage advanced analytics often need additional investments in software, licenses, or integration with external BI tools.
5. Integration Challenges
Another limitation concerns integration with external data sources. Standard SAP dashboards typically focus on internal ERP data, making it difficult to consolidate insights from CRM systems, marketing platforms, external market data, or IoT devices. Integrating these diverse datasets often requires middleware, custom ETL processes, or third-party BI solutions. Without this integration, users may have incomplete views of operational performance or miss opportunities for holistic decision-making across multiple systems.
6. Limited Mobile Reporting Functionality
Although SAP Fiori and SAP Analytics Cloud provide mobile-friendly interfaces, the reporting capabilities on mobile devices remain constrained compared to desktop experiences. Mobile dashboards often feature simplified visualizations, reduced interactivity, and limited drill-down capabilities. For organizations that rely on field sales, service personnel, or executives who need to make data-driven decisions on the go, the mobile reporting limitations can hinder productivity and responsiveness.
7. Difficulty in Real-Time Reporting
Real-time reporting is often essential in fast-moving industries where decisions need to be based on current operational conditions. Traditional SAP reports, particularly those based on ECC or older SAP modules, often rely on batch processing or extracts from transactional tables. This latency means that dashboards may display slightly outdated information, limiting their effectiveness for time-sensitive decision-making. Organizations must implement additional technologies, such as SAP HANA Live views or event-driven data pipelines, to achieve real-time visibility, which increases complexity and cost.
8. User Interface and Visualization Limitations
While SAP has made strides with Fiori and BusinessObjects, the default dashboards and reports often lack modern, interactive, and visually appealing elements compared to contemporary BI tools. Users accustomed to drag-and-drop visualization platforms like Tableau, Power BI, or StyleBI may find SAP’s interface less intuitive. The limited visual options can make it difficult to convey complex data stories effectively, reducing user engagement and impacting the overall adoption of analytics tools.

9. Constraints on Self-Service Analytics
Self-service analytics has become a major trend, empowering business users to explore data independently without relying on IT. SAP’s traditional reporting tools, however, are less conducive to self-service. Users often need IT support to create new reports, adjust dashboards, or combine datasets. Even with SAP Analytics Cloud, self-service functionality may be constrained by governance rules, data security considerations, or licensing restrictions. This limitation can slow down insight generation and reduce the responsiveness of business units.
10. Cost and Licensing Considerations
Expanding SAP dashboards and reports beyond the standard capabilities often comes with significant costs. SAP Analytics Cloud, BusinessObjects, or other add-ons require additional licenses, which can be expensive for large organizations. Moreover, developing custom reports or dashboards typically requires skilled consultants or internal developers, further increasing operational costs. These financial and resource constraints can prevent organizations from fully leveraging the reporting capabilities SAP offers.
11. Limited Drill-Down and Contextual Analysis
Standard SAP dashboards often provide high-level summaries or aggregated KPIs but offer limited drill-down options for detailed investigation. Users may need to navigate multiple reports or perform manual analysis to uncover root causes behind trends or anomalies. This limitation can make problem-solving slower and reduce the effectiveness of dashboards as decision support tools.
12. Static Reporting Schedules
Many SAP reports are run on scheduled intervals, such as daily, weekly, or monthly, which can be limiting for real-time or ad hoc analysis needs. Organizations that require immediate visibility into sales performance, inventory levels, or production bottlenecks may find that the standard scheduling options do not provide timely insights. Ad hoc analysis often requires additional configuration or third-party tools, increasing complexity.