More Articles About Replacement Reporting Tools
Alerts Assisted Living Providers to Problems - It
is a good idea to keep an eye on the health of your loved ones, especially elderly or disabled family members,
who are the most vulnerable. It is a good idea that you can easily make happen by installing a smart and fully
featured assisted living dashboard. Here are some of the benefits you get from doing so; A person's health
could decline at any point in time. So, there is no way for anyone to know when such a decline will happen...
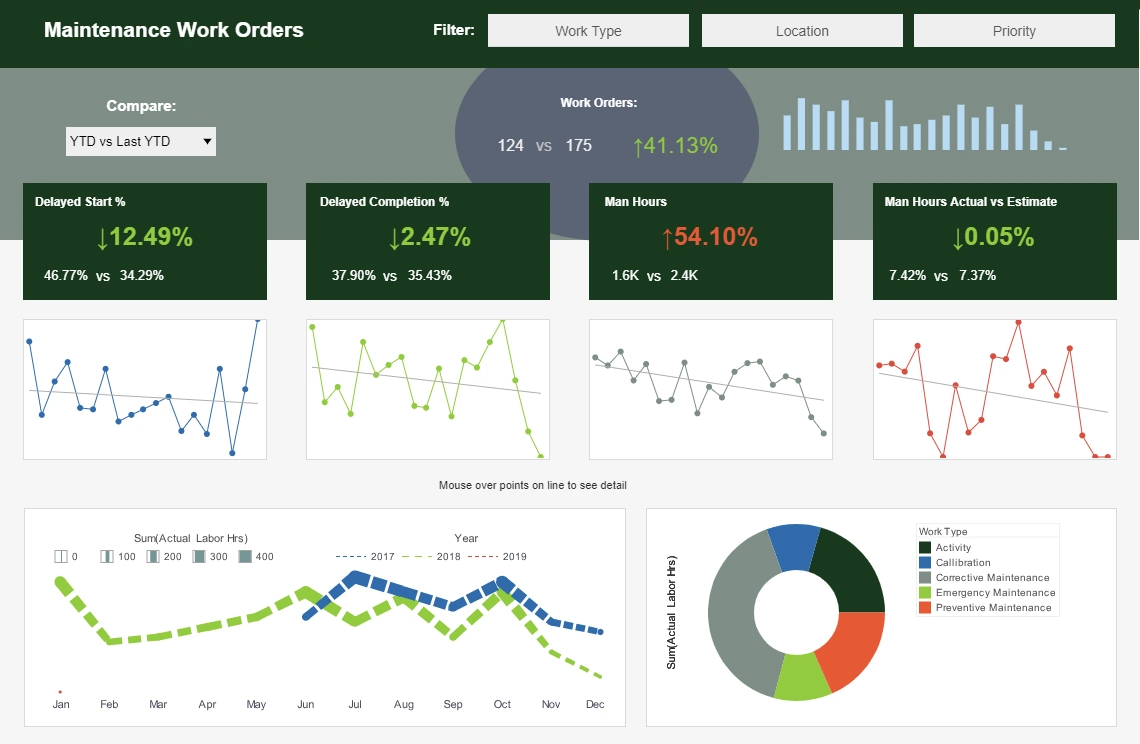
Create a Maintenance Work Orders Dashboard - This
document will explain how to create a maintenance dashboard such as the one at right using dashboard creation
software from InetSoft. A working version of this dashboard can be found in the InetSoft Gallery. This
dashboard has a very large number of components, but these are primarily text KPIs, along with some filter
components and simple charts. The dashboard also incorporates some scripts that set various parameters based
on user input. Below, we will examine how you can create all these different elements. (Note that the data
source used by the dashboard contains a randomized element, so the data appears to be different every time the
dashboard refreshes.)...
Building
Maintenance Department Reporting - Building maintenance departments use a variety of key performance
indicators (KPIs) and metrics to assess the effectiveness, efficiency, and quality of their maintenance
operations. These metrics help measure performance, track progress, identify areas for improvement, and ensure
that buildings are safe, functional, and well-maintained. Here are some common reporting KPIs and metrics used
by building maintenance departments...
Data History in a Data Governance Dashboard -
Organizations are increasingly realizing the necessity for efficient data governance as the relevance of data
continues to rise. To guarantee that data is accurate, dependable, and secure, rules, processes, and standards
must be established. One of the key tools in any data governance program is a dashboard, which provides an
overview of key metrics and indicators related to data quality, usage, and compliance...
Entertainment
Industry Weekly Reports - Project Status Updates: Detailed information on the status of each project in
development or production. This includes any significant milestones achieved, challenges faced, and progress
made towards completion. Budgetary Information: A breakdown of the budget for each project, including
expenditures to date, remaining budget, and any potential overages or cost-saving measures implemented...
Managing Report
Schedules - It is possible to specify multiple actions. Click on the 'Multiple Actions' button at the
bottom right of the editing panel. This will display the schedule action list to which you can add, delete or
edit actions by clicking on the 'Add', 'Delete' and 'Edit' buttons respectively...
Tips
for Making a User-friendly Dashboard - If you've ever built a dashboard, you know how much work it can
be. It's not just about getting your data in the right place and displaying it in an attractive way. It's also
about making sure that what you're showing is easy to understand. The last thing anyone wants is for them to
spend an hour trying to figure out what's going on with their dashboard before they can even begin using it
properly! That's why we are going to share some tips and tricks on how we make user-friendly dashboards...
What Is
Unified Business Intelligence? - If you think about it, all traditional business intelligence
applications, no matter how user-friendly they try to make them, no matter how powerful they try to make them,
they are limited by one factor, which is the underlying database. Whatever you planned for, whatever you
designed, whatever you built in the underlying database, that has been the limit of your exploration and your
analysis...