Try a Powerful Reporting Tool for Your Business
A properly implemented and highly visual report tool will increase your business' analytical capabilities, helping you make better decisions.
The Problems with Data Management
Information, by its very nature, is messy. Every time a sale is made, that's a data point; every time someone is late to work, that's a data point; every time an email is sent, that's a data point. Data is the output of everything that happens in an organization, making tracking key information vitally important.
By understanding cause-and-effect relationships in business, you are able to create positive outcomes (in the form of good decisions). With all this endless and constant information being produced, how can you possibly keep up with or manage your data?


The Advantages of InetSoft's Reporting Software
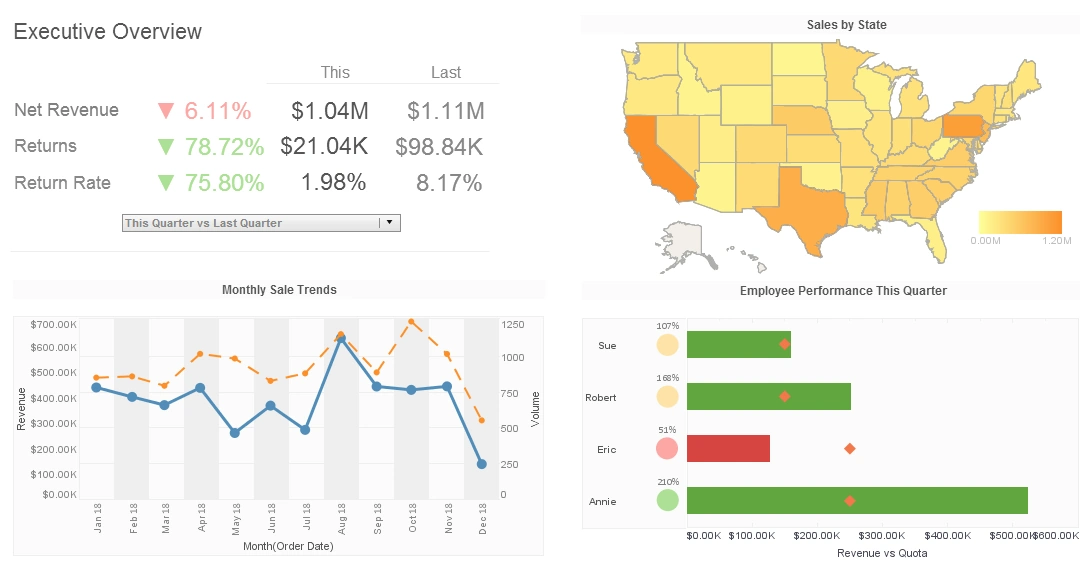
Visualized data has many large benefits over traditional text-based spreadsheet design. These are just a few advantages of well balanced visual appeal and functionality:
- Clarity - it's easier to absorb and understand a chart than it is to understand raw numbers
- More data - considerably larger amounts of data can be presented and still understood by viewers
- Less confusion - no need to process numbers, which can quickly become overwhelming
Leverage a Versatile Reporting Tool
InetSoft Technology can help you. StyleBI, our flagship business intelligence tool, offers several powerful methods of performing visual analysis:
- Multi-dimensional charting - depict more than just two dimensions on a graph
- Drill-down reporting - interactive point-and-click data exploration
- Filtering - targeted data selection and viewing
- and more...
How a Floriculture Supplier Switched From Bold Reports to InetSoft
Floriculture is a delicate, detail-driven industry where precision in tracking operations, sales, and supply chains often means the difference between profitability and waste. Floriculture suppliers—those who provide greenhouses, irrigation systems, fertilizers, seed stock, and logistics services to flower growers—live in a competitive market with slim margins. To remain competitive, these suppliers must harness their operational data to optimize efficiency and spot emerging trends in customer behavior. One mid-sized floriculture supplier recently faced a turning point when its existing reporting platform, Bold Reports, no longer met its growing demands. The company’s decision to migrate to InetSoft’s reporting and dashboarding solution illustrates how a shift in business intelligence (BI) tooling can improve efficiency, reduce costs, and elevate management confidence.
Challenges with Bold Reports
The supplier had been using Bold Reports for three years, primarily because of its affordability and ability to embed reports into internal portals. Initially, this worked well enough for tracking basic operational metrics such as fertilizer distribution volumes, irrigation equipment sales, and supplier orders. However, as the business expanded geographically and took on larger greenhouse clients, its reporting needs became more complex. The problems with Bold Reports became increasingly difficult to ignore:
- Licensing Costs Escalation: Although the platform seemed cost-effective at first, the need for additional user licenses and server capacity caused fees to climb steeply. For a supplier running multiple branches, the per-user model created overhead that exceeded expectations.
- Limited Data Mashup Capabilities: Floriculture supply chains rely on diverse data—from greenhouse environmental controls to distributor sales figures and customer relationship management systems. Bold Reports struggled to integrate these heterogeneous sources in real time, forcing analysts to rely on manual workarounds.
- Heavy IT Involvement: Bold Reports required frequent support from the IT department for tasks such as adjusting permissions, building queries, and creating custom visualizations. This slowed down the flow of information and frustrated business managers who wanted greater autonomy.
- Performance Bottlenecks: As datasets grew—especially with seasonal surges during peak growing months—the platform slowed noticeably. This made it difficult to generate timely insights and undermined decision-making agility.
For an industry where timing is critical—late shipment of irrigation supplies can jeopardize an entire crop—the lack of reliable, real-time reporting was unacceptable. The management team began searching for alternatives that could balance affordability with flexibility.
Choosing InetSoft
The evaluation process considered several reporting platforms, but InetSoft stood out for its serverless deployment option, lightweight footprint, and powerful data mashup capabilities. The supplier was particularly drawn to InetSoft’s ability to blend disparate data streams seamlessly: greenhouse environmental sensors, supplier invoices, shipping logistics data, and retail point-of-sale information could all be unified into a single reporting environment. This would allow managers to trace supply chain performance end-to-end.
Another deciding factor was InetSoft’s flexible licensing model. Instead of penalizing the company for adding more users, InetSoft offered scalable options that matched actual usage patterns. This meant the supplier could extend access to branch managers, sales representatives, and even some key customers without spiraling costs. Finally, the platform’s low IT overhead appealed to leadership: InetSoft’s self-service interface would empower managers and analysts to build reports without waiting for technical staff to intervene.
The Transition Process
Switching from Bold Reports to InetSoft was carried out over three months. The transition strategy had three major phases:
- Data Mapping: Analysts worked closely with InetSoft consultants to map existing data sources—ERP systems, CRM tools, greenhouse sensor feeds—into the new platform. The supplier quickly discovered that InetSoft’s mashup engine allowed for far cleaner integrations than they had managed with Bold Reports.
- User Training: InetSoft’s interface was intuitive enough that most users needed only a short training session. Branch managers particularly appreciated the drag-and-drop features, which let them create dashboards without relying on IT. The training emphasized designing performance dashboards tailored to local needs, such as fertilizer inventory levels or order fulfillment times.
- Report Migration: While some standard reports were rebuilt manually, many were redesigned from scratch to take advantage of InetSoft’s advanced visualization options. This was not seen as a burden; rather, it gave the supplier the opportunity to rethink how data was presented and used by staff across departments.
Immediate Benefits
The improvements after adoption were clear within the first quarter. The supplier reported several notable gains:
- Reduced Licensing and Overhead Costs: By switching to InetSoft, the supplier saved nearly 30% on annual reporting expenses. The flexible licensing model eliminated the previous frustration of adding new users, which encouraged broader adoption across the company.
- Faster Decision-Making: With real-time dashboards, managers no longer had to wait hours for reports to refresh. During seasonal peaks, when orders spike, this responsiveness allowed for quicker reallocation of inventory and labor resources.
- Improved Data Accuracy: The mashup capabilities eliminated the manual spreadsheet workarounds that had introduced errors. Now, when a greenhouse placed a bulk order for irrigation systems, the system immediately reflected it across sales, shipping, and supplier dashboards.
- Greater End-User Satisfaction: Managers and sales staff expressed enthusiasm at being able to create and customize their own dashboards. This autonomy not only sped up workflows but also built confidence in the insights generated.
Strategic Insights Gained
Beyond operational efficiencies, InetSoft enabled the supplier to extract insights that were previously invisible. For instance, by combining greenhouse climate control data with fertilizer usage and sales figures, analysts identified correlations between regional growing conditions and product demand. This helped the supplier forecast demand more accurately and adjust marketing campaigns accordingly. In another case, real-time mashups of logistics and retail data revealed delays in shipping that were impacting specific customer segments. The company quickly renegotiated with logistics partners and improved customer satisfaction scores as a result.
Long-Term Outlook
The supplier’s leadership now views data as a strategic asset rather than a byproduct of operations. With InetSoft in place, they are exploring advanced analytics such as predictive modeling, aiming to forecast not only sales trends but also customer churn risks. There is also interest in extending reporting capabilities outward, offering select customers self-service portals to track their own orders and consumption trends. This would position the supplier not just as a vendor but as a data-driven partner to floriculture businesses worldwide.
