What Is the Best Dashboard Software for Financial Reporting and Analysis?
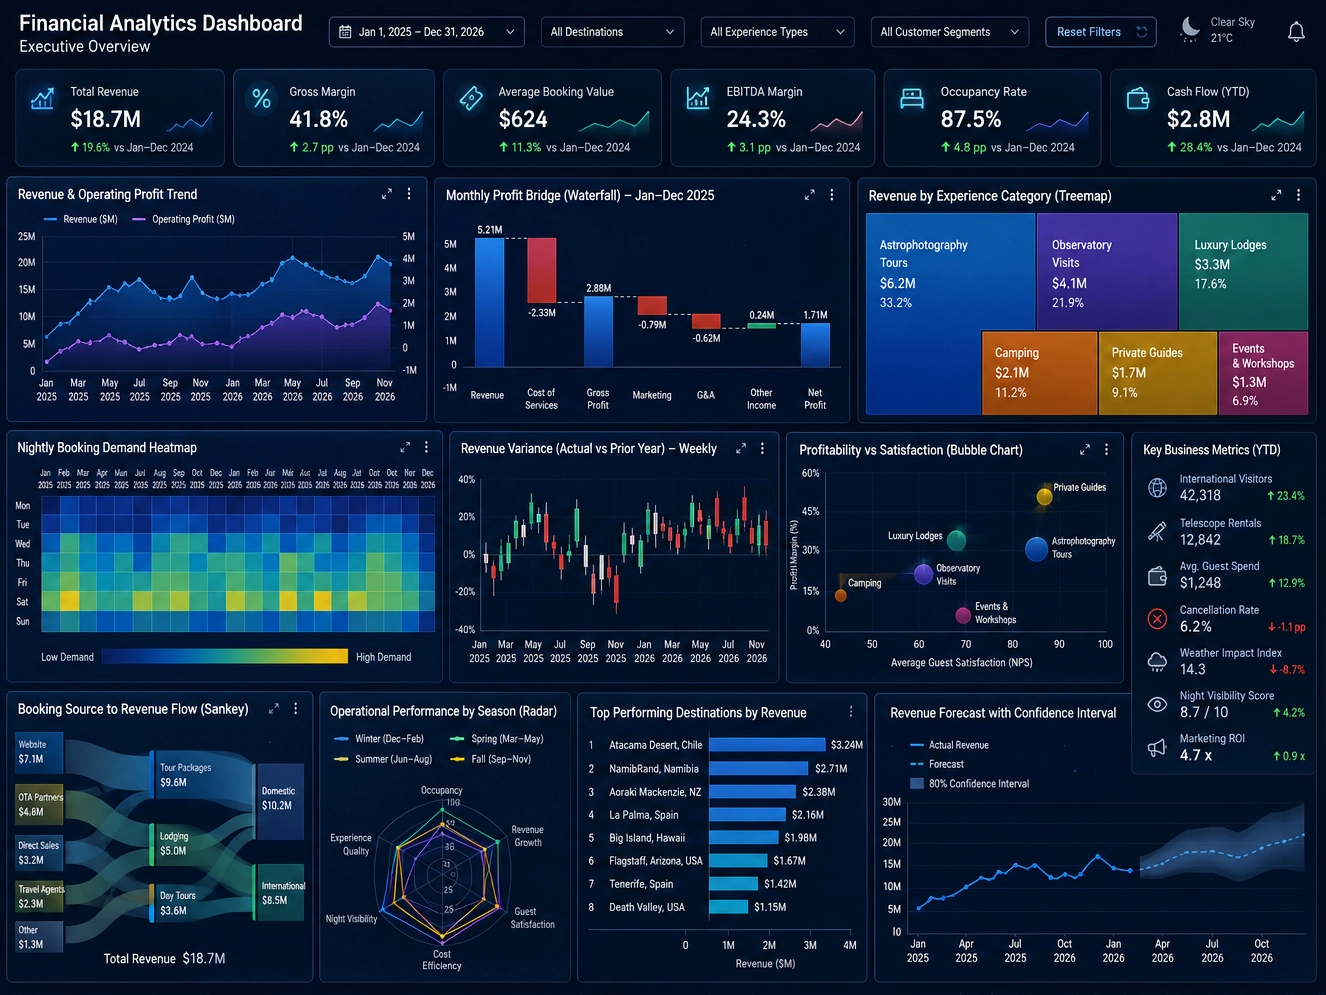
Financial reporting and analysis require precision, governance, and clarity. Finance teams depend on dashboards to monitor revenue, expenses, cash flow, profitability, forecasting accuracy, and operational efficiency. When organizations ask, “What is the best dashboard software for financial reporting and analysis?”, they are really asking which platform can deliver trusted financial KPIs, flexible modeling, secure access, and presentation-ready visuals that support CFOs, controllers, FP&A teams, and executive leadership.
This article explores the core requirements of financial dashboards, compares leading BI platforms including InetSoft, Power BI, Tableau, Qlik, and other financial analytics tools, and provides a practical framework for selecting the best dashboard software for your finance organization.
What finance teams need from dashboard software
Financial dashboards are different from general business dashboards. They must be accurate, governed, and aligned with accounting standards and internal controls. Finance teams rely on dashboards to support monthly close cycles, forecasting, budgeting, variance analysis, and executive reporting.
The best dashboard software for financial reporting must support:
- Governed financial metrics: Consistent definitions for revenue, margin, expenses, and cash flow.
- Secure access: Role-based permissions for sensitive financial data.
- Flexible modeling: Support for hierarchies, time intelligence, and multi-level drill-downs.
- Integration with financial systems: ERP, accounting software, data warehouses, and spreadsheets.
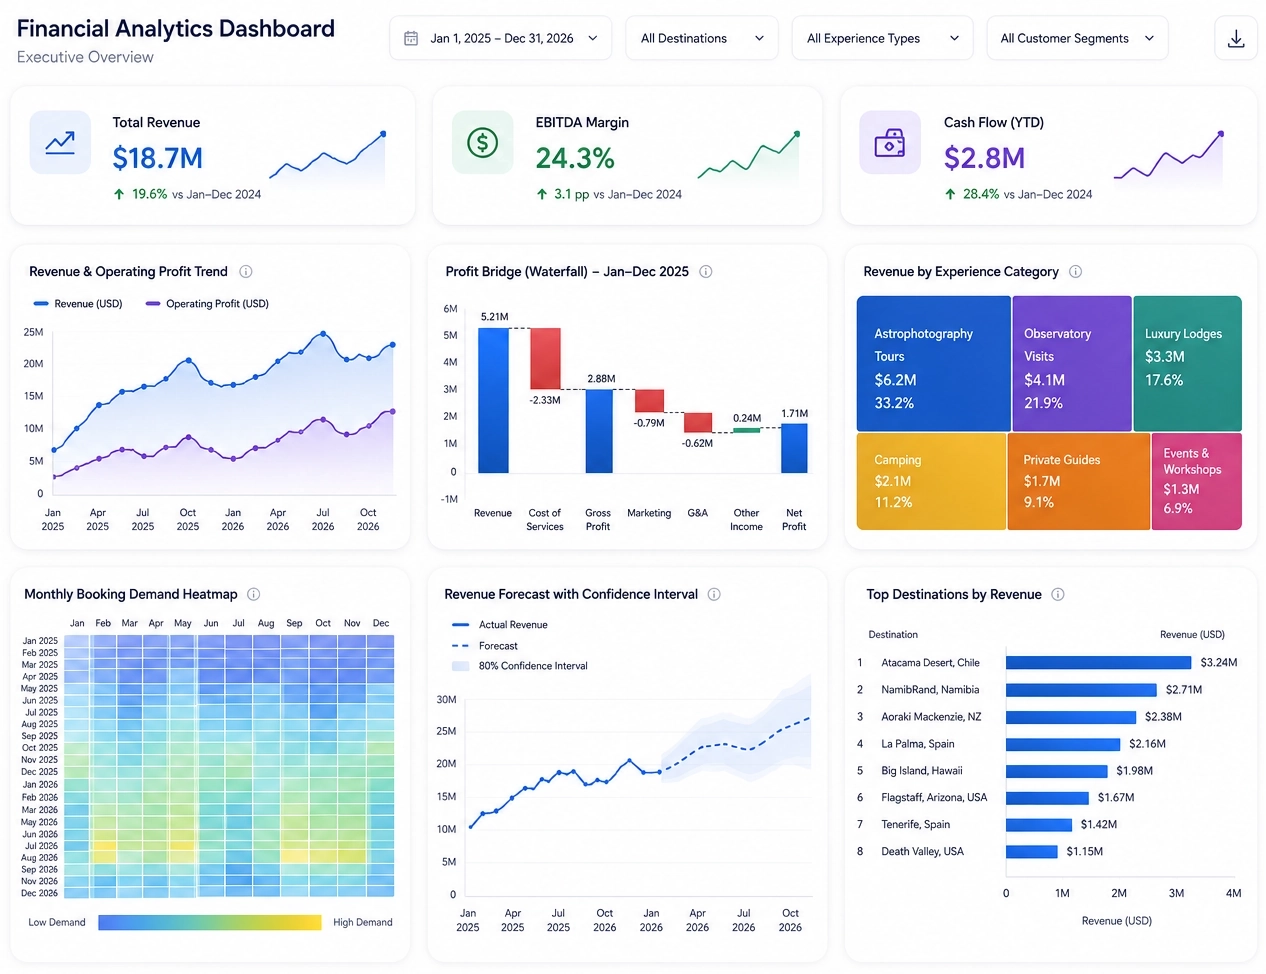
- Presentation-ready visuals: Clean layouts for board meetings and executive reviews.
- Scenario analysis: Ability to explore forecasts, budgets, and what-if models.
Any platform claiming to be “best” for financial reporting must excel in these areas.
Key criteria for evaluating financial dashboard software
Before comparing vendors, it helps to understand the criteria that matter most for financial reporting and analysis. Finance teams operate in a governed environment, so the dashboard platform must support accuracy, security, and repeatability.
1. Data connectivity and financial system integration
Financial dashboards depend on accurate data from ERP systems, accounting platforms, CRM systems, and data warehouses. The best BI tools support:
- Direct ERP connectors: SAP, Oracle, NetSuite, Microsoft Dynamics, and others.
- Accounting system integration: QuickBooks, Sage, Workday, and similar platforms.
- Warehouse connectivity: Snowflake, Redshift, BigQuery, Azure SQL, and on-prem databases.
- Spreadsheet ingestion: Excel remains central to FP&A workflows.
2. Financial modeling and semantic layers
Financial reporting requires reusable measures, time intelligence, and hierarchical structures. The best dashboard software supports:
- Reusable KPIs: Define revenue, margin, and expense formulas once.
- Time intelligence: Year-over-year, quarter-over-quarter, moving averages, and period comparisons.
- Hierarchies: Drill from company → division → department → cost center.
- Currency handling: Multi-currency conversions and historical rates.
3. Governance and security
Financial data is sensitive. Dashboards must support:
- Row-level security: Restrict data by department, region, or role.
- Role-based access: CFO, controller, FP&A analyst, and business unit leader views.
- Auditability: Ensure metric definitions cannot be changed accidentally.
- Version control: Promote dashboards from development to production.
4. Performance and scalability
Financial dashboards often involve large datasets and complex calculations. The platform must support:
- Fast refresh cycles: Daily or hourly updates for operational finance.
- High-performance queries: Even with large ERP datasets.
- Responsive interactivity: Filters, drill-downs, and scenario exploration.
5. Presentation quality
Financial dashboards frequently appear in board decks, investor presentations, and executive meetings. The best dashboard software supports:
- Clean layouts: Clear typography, spacing, and color consistency.
- Export options: PDF, PowerPoint, or embedded dashboards.
- Executive storytelling: Highlight trends, risks, and opportunities.

Top dashboard software for financial reporting and analysis
Several BI platforms consistently stand out for financial reporting. Each has strengths depending on your architecture, governance needs, and presentation workflows. Below is a detailed comparison of the leading options.
InetSoft
InetSoft is a powerful enterprise BI platform known for its governed modeling, flexible dashboard design, and strong financial reporting capabilities. Finance teams value InetSoft for its ability to combine data from ERP systems, warehouses, and spreadsheets into unified, governed dashboards.
- Financial modeling: InetSoft’s semantic layer allows finance teams to define KPIs once and reuse them across dashboards. Time intelligence, hierarchies, and multi-level drill-downs are supported out of the box.
- Governance: Row-level security, role-based access, and governed refresh schedules ensure financial data remains accurate and secure.
- Dashboard design: InetSoft supports responsive layouts, KPI tiles, variance charts, waterfall charts, and executive-ready visuals ideal for board meetings.
- Data integration: Connect to ERP systems, accounting platforms, warehouses, and Excel models.
- Best for: Organizations needing governed financial dashboards with flexible customization and strong integration.
InetSoft is especially strong for FP&A teams that need to combine structured ERP data with spreadsheet-based models and present insights to executives.
Microsoft Power BI
Power BI is widely used for financial reporting due to its strong modeling capabilities, integration with Excel, and robust governance features. Finance teams appreciate its ability to create reusable DAX measures and time intelligence calculations.
- Financial modeling: DAX supports complex financial formulas and time-based comparisons.
- Integration: Deep integration with Excel and Microsoft Dynamics.
- Governance: Row-level security and workspace permissions.
- Presentation: Embed dashboards in PowerPoint for executive meetings.
- Best for: Microsoft-centric organizations.
Tableau
Tableau is known for its visual storytelling and interactive dashboards. Finance teams use Tableau to explore trends, variances, and forecasting scenarios with intuitive drill-downs and clean visuals.
- Financial visuals: Waterfall charts, variance charts, and trend analysis.
- Interactivity: Filters, actions, and drill-throughs.
- Integration: Connect to ERP systems and warehouses.
- Best for: Organizations prioritizing visual clarity and exploration.

Qlik Sense
Qlik Sense’s associative engine makes it easy to explore relationships across financial data. FP&A teams value its ability to pivot between dimensions and uncover drivers behind financial KPIs.
- Associative exploration: Reveal hidden relationships in financial data.
- Governance: Strong security and app-based workflows.
- Best for: Organizations needing flexible exploration.
Other financial analytics platforms
Beyond general BI platforms, several specialized financial analytics tools support financial reporting and analysis. These include platforms focused on budgeting, forecasting, and performance management.
- FP&A tools: Platforms designed for budgeting and forecasting workflows.
- Accounting analytics: Tools focused on ledger analysis and close management.
- Operational finance dashboards: Tools for monitoring SLAs, throughput, and cost efficiency.

Comparing the top financial dashboard platforms
Each platform has strengths depending on your needs. Below is a comparison of key factors.
Financial modeling strength
- InetSoft: Strong semantic modeling and governed KPIs.
- Power BI: Advanced DAX formulas and time intelligence.
- Tableau: Flexible visuals but less modeling depth.
- Qlik Sense: Associative exploration for complex relationships.
Governance
- InetSoft: Enterprise-grade governance and security.
- Power BI: Strong workspace and row-level security.
- Tableau: Good governance with server/cloud deployment.
- Qlik Sense: Strong security rules and app governance.
Presentation quality
- InetSoft: Clean executive dashboards and responsive layouts.
- Power BI: Strong PowerPoint integration.
- Tableau: Best-in-class visual storytelling.
- Qlik Sense: Clear visuals with flexible exploration.

How to choose the best dashboard software for financial reporting
Choosing the best platform depends on your financial workflows, data landscape, and governance requirements. Use the following steps to make a confident decision.
- Identify core financial use cases: Monthly close, forecasting, budgeting, executive reporting.
- Map your data sources: ERP, accounting systems, warehouses, spreadsheets.
- Define governance needs: Security, auditability, and metric consistency.
- Prototype dashboards: Build financial dashboards in multiple tools.
- Evaluate performance: Test refresh speed and interactivity.
- Gather feedback: Ask CFOs, controllers, and FP&A teams to evaluate dashboards.
Strong financial integration
The best dashboard software for financial reporting and analysis depends on your organization’s data architecture, governance needs, and presentation workflows. InetSoft stands out for its governed modeling, flexible dashboard design, and strong financial integration. Power BI excels in Microsoft environments with advanced modeling capabilities. Tableau shines in visual storytelling, while Qlik Sense offers powerful associative exploration.
By evaluating financial modeling strength, governance, performance, and presentation quality, finance teams can select the dashboard platform that best supports accurate reporting, insightful analysis, and confident decision-making.