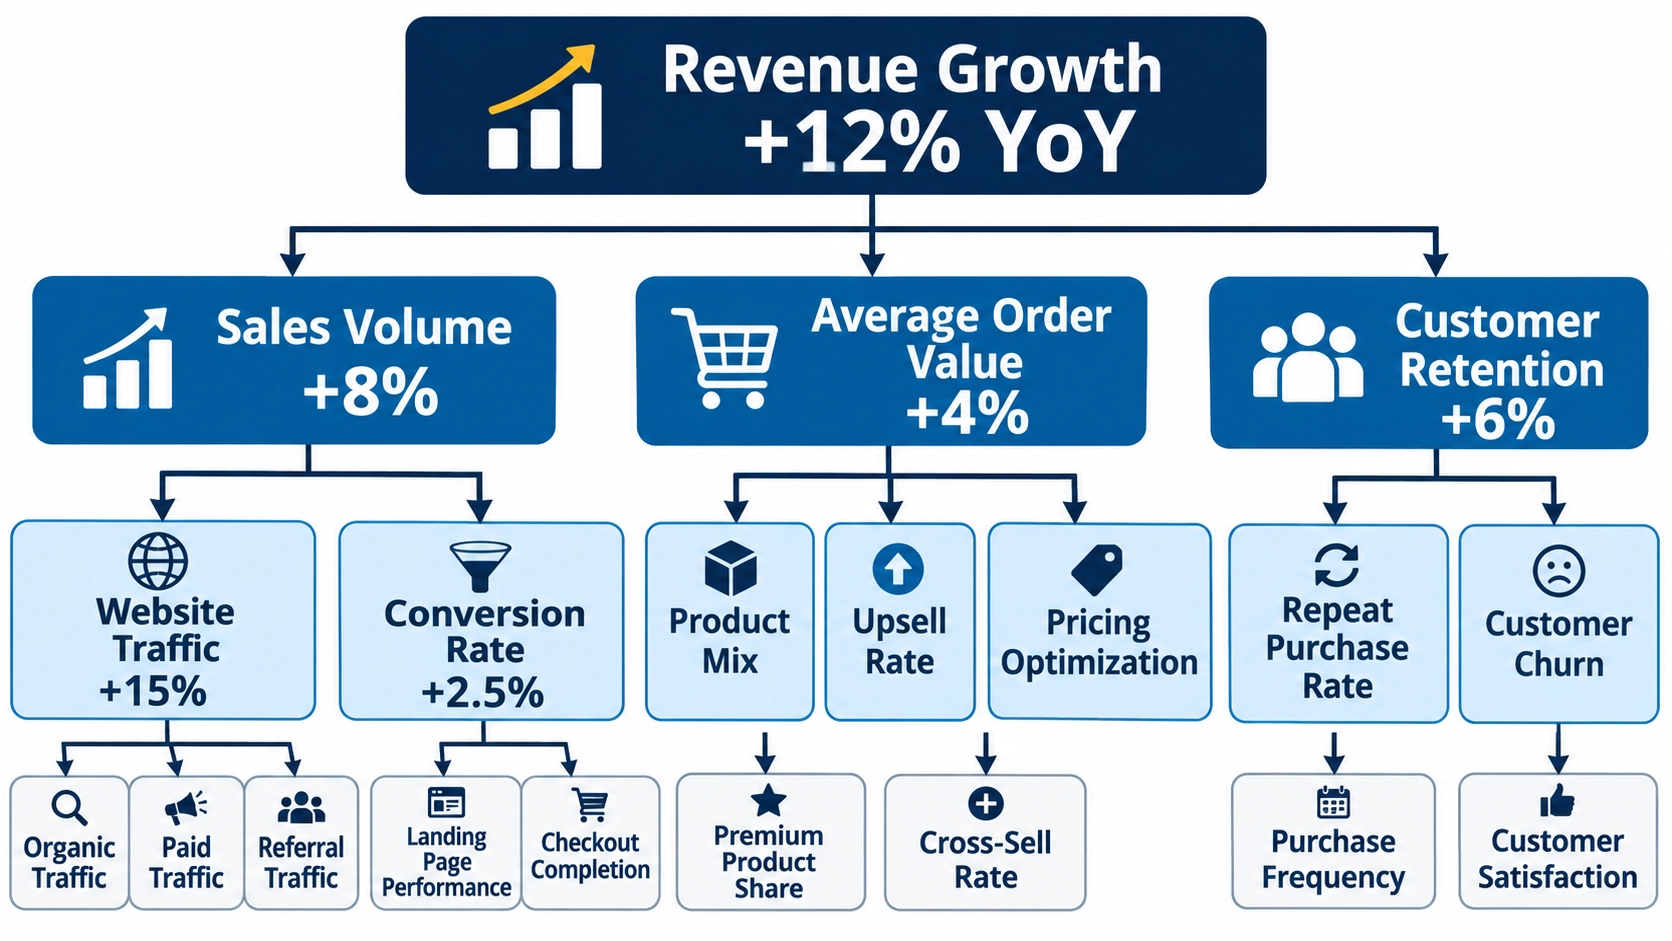
Understanding KPI Dependency Trees
Organizations often monitor dozens or even hundreds of KPIs. While each metric may provide useful information,
not every KPI directly impacts strategic success. A KPI Dependency Tree organizes metrics into a hierarchy
that shows cause-and-effect relationships between leading indicators and lagging indicators.
At the top of the tree are outcome metrics such as revenue growth, profit margin, customer satisfaction, or
retention rates. Beneath these are the operational metrics that influence those outcomes. Additional layers
reveal increasingly granular measurements that teams can directly control.
This structure helps employees and executives understand how day-to-day actions affect organizational
objectives.
How a KPI Dependency Tree Works
A dependency tree begins with a primary business objective. Analysts then identify the metrics that drive that
objective and continue breaking those metrics into increasingly detailed contributors.
For example:
- Revenue Growth
- Sales Volume
- Lead Generation
- Lead Conversion Rate
- Sales Cycle Length
- Average Deal Size
- Customer Retention
-
- Customer Satisfaction
- Support Resolution Time
- Product Adoption Rate
This visualization reveals how lower-level operational improvements can contribute to growth-oriented
outcomes.
Why KPI Dependency Trees Matter
Many organizations struggle because departments optimize local metrics without understanding how those KPIs
affect broader business goals. A KPI Dependency Tree provides visibility into organizational alignment.
Benefits include:
- Improved strategic alignment across departments.
- Better identification of performance drivers.
- Greater accountability among teams.
- Enhanced prioritization of improvement initiatives.
- More accurate root-cause analysis.
- Clear communication of organizational objectives.
By connecting metrics together, leaders gain a more complete understanding of performance dynamics.
Connecting Leading and Lagging Indicators
One of the most valuable aspects of a KPI Dependency Tree is its ability to connect leading indicators with
lagging indicators.
Lagging indicators measure outcomes that have already occurred, such as annual revenue or churn rates. Leading
indicators measure activities that can influence future outcomes, such as customer engagement,
marketing-qualified leads, or product usage frequency.
Through dependency mapping, organizations can identify which leading indicators deserve the most attention
because of their potential downstream impact.
Real-World Example
Consider an e-commerce retailer seeking to improve profitability. The company identifies Net Profit Margin as
its top-level KPI.
Analysis reveals that profit margin depends on:
- Revenue Growth
- Inventory Efficiency
- Customer Acquisition Costs
- Order Fulfillment Costs
Inventory Efficiency may further depend on:
- Stock Turnover Rate
- Forecast Accuracy
- Supplier Lead Times
A KPI Dependency Tree makes these relationships visible, allowing management to address root causes rather
than simply reacting to declining profitability.
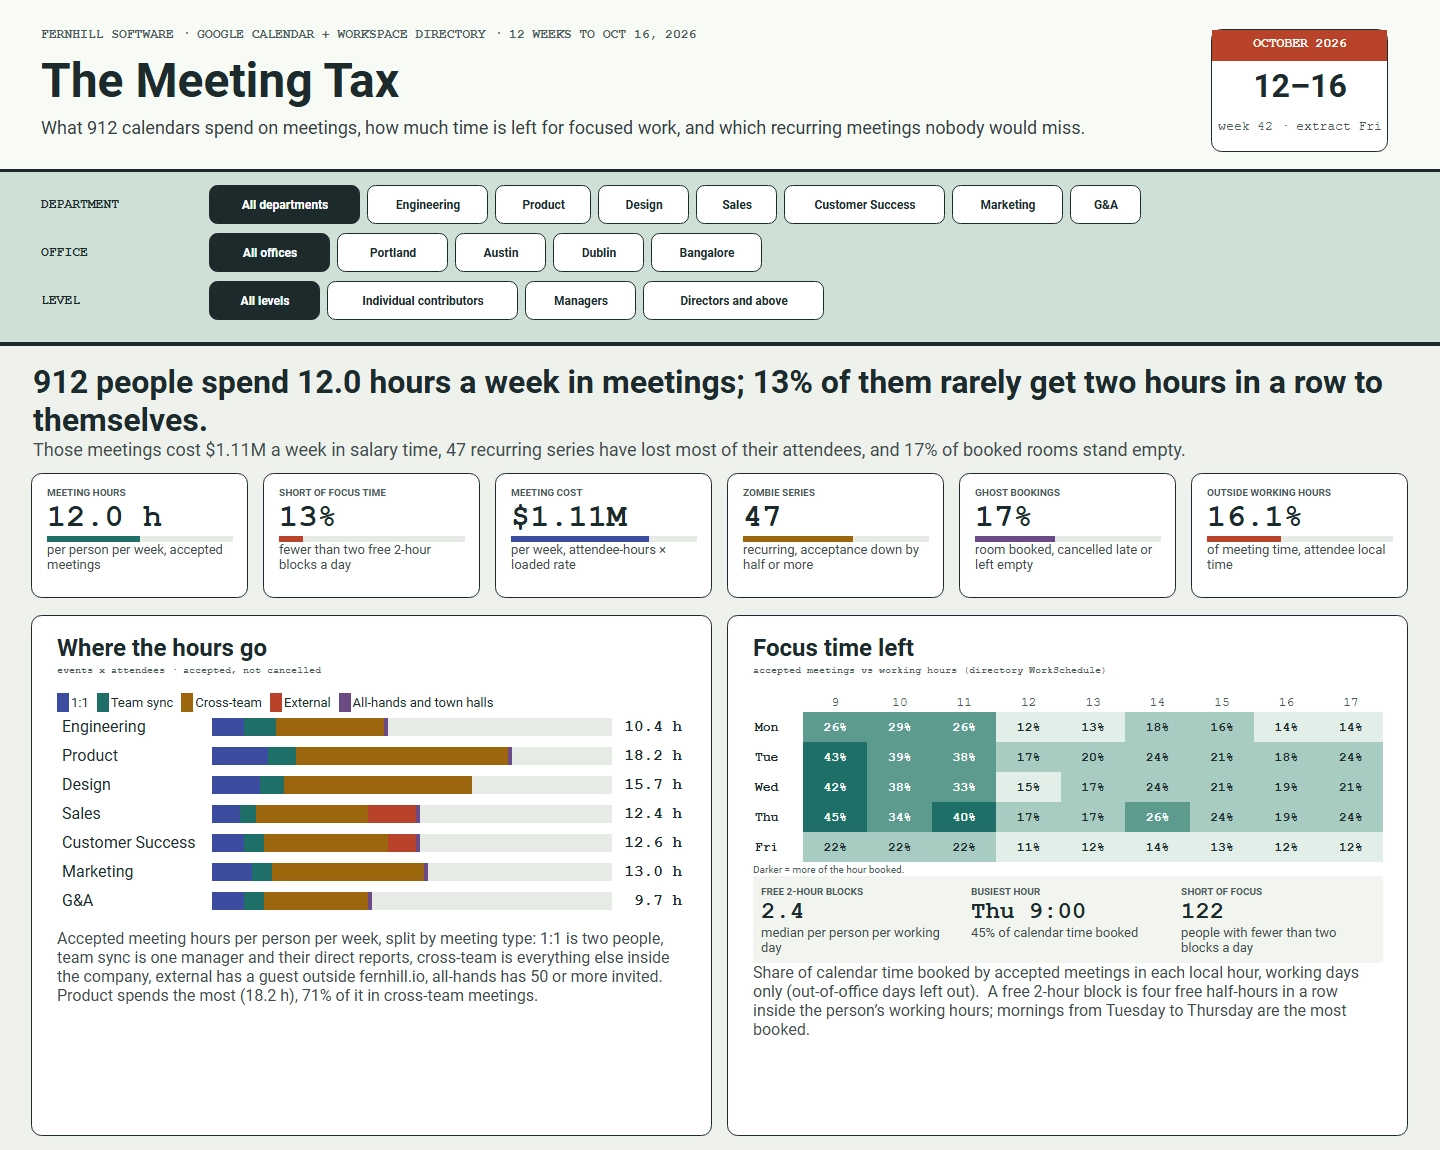
Visualizing KPI Dependency Trees with Dashboards
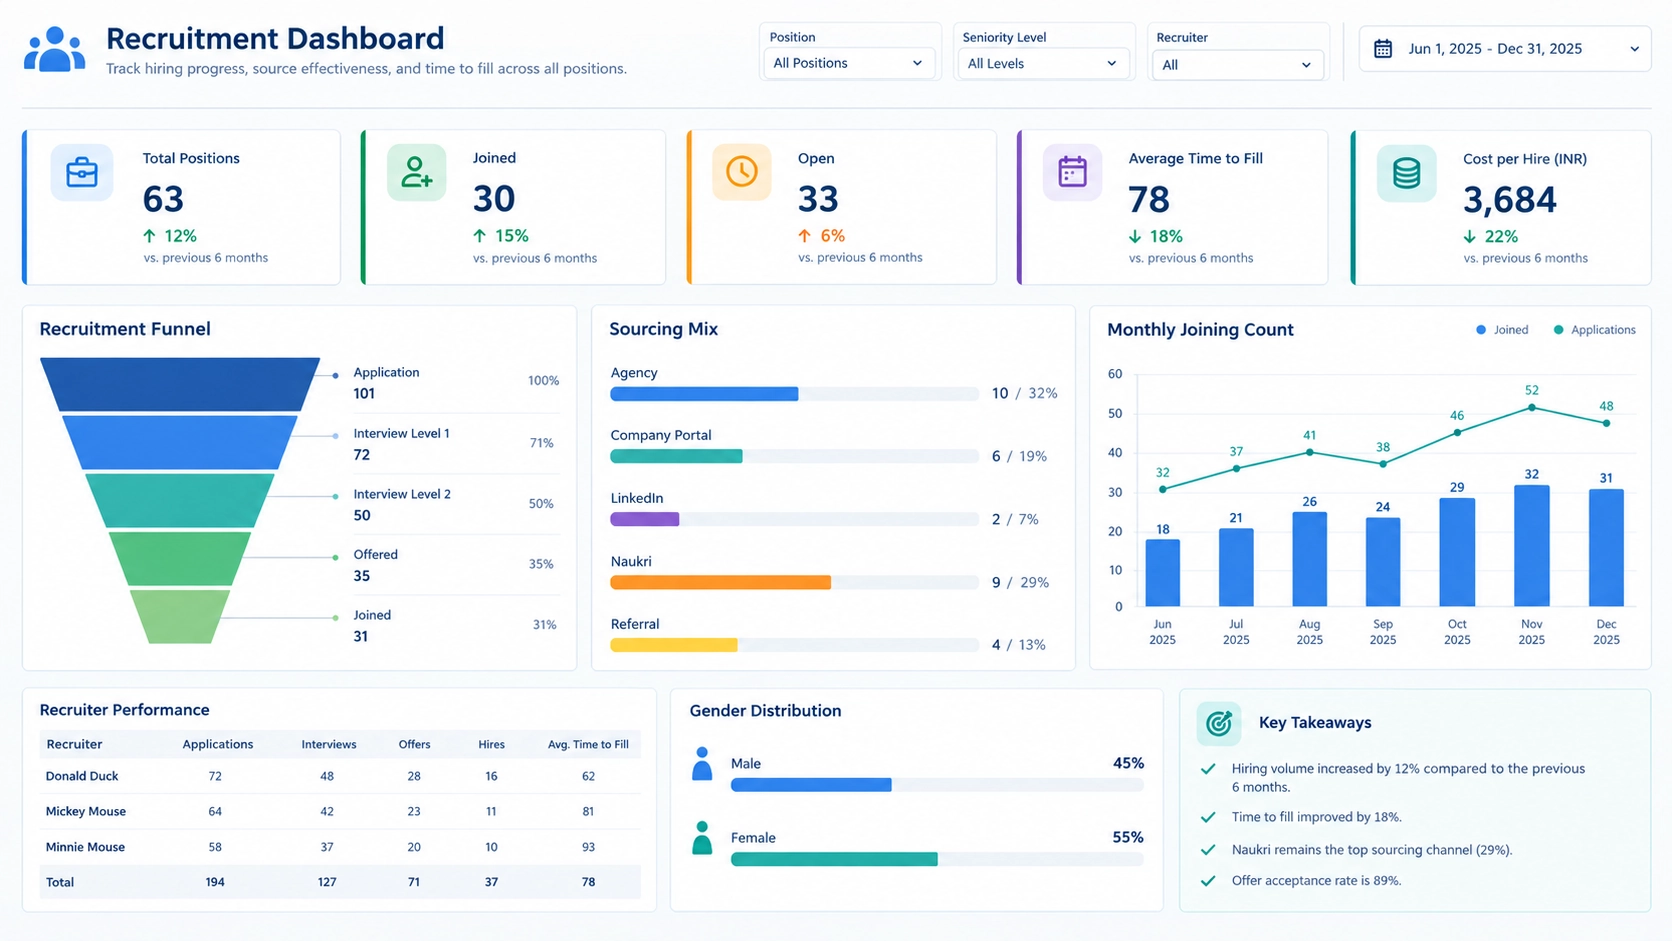
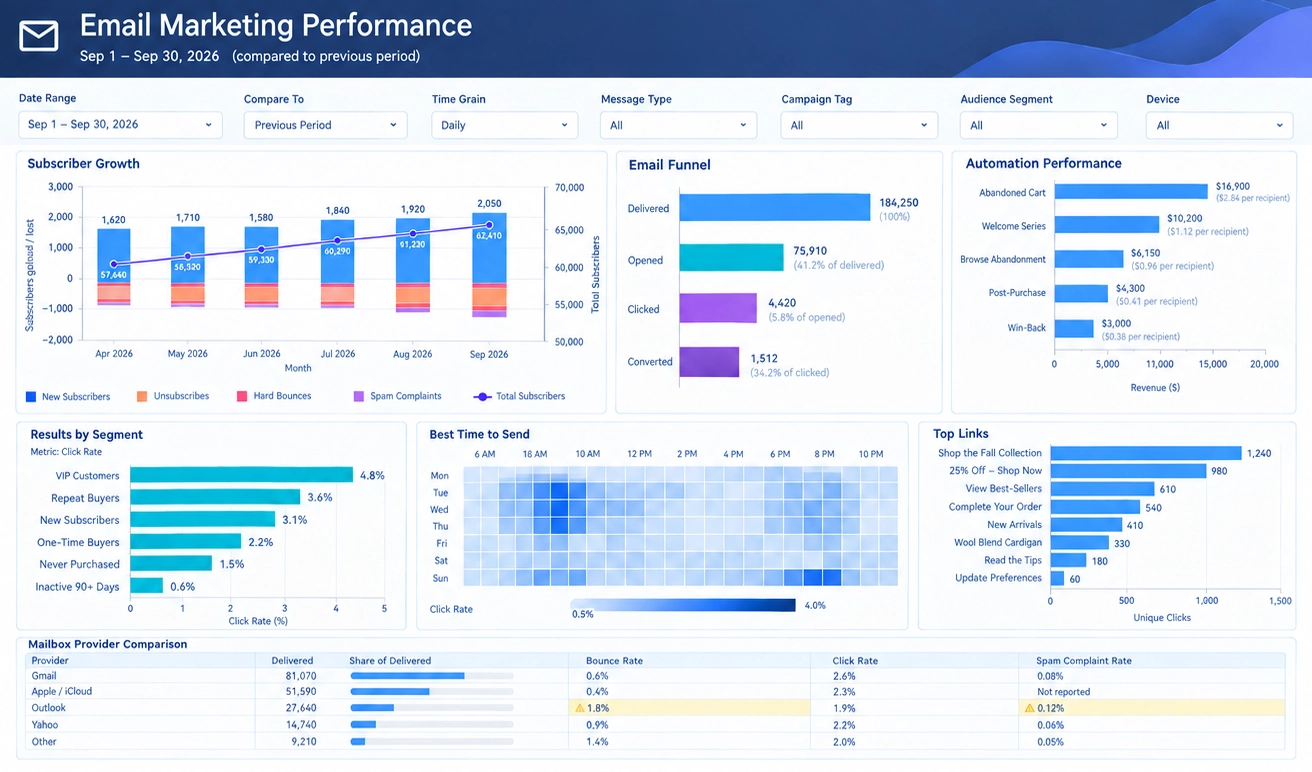
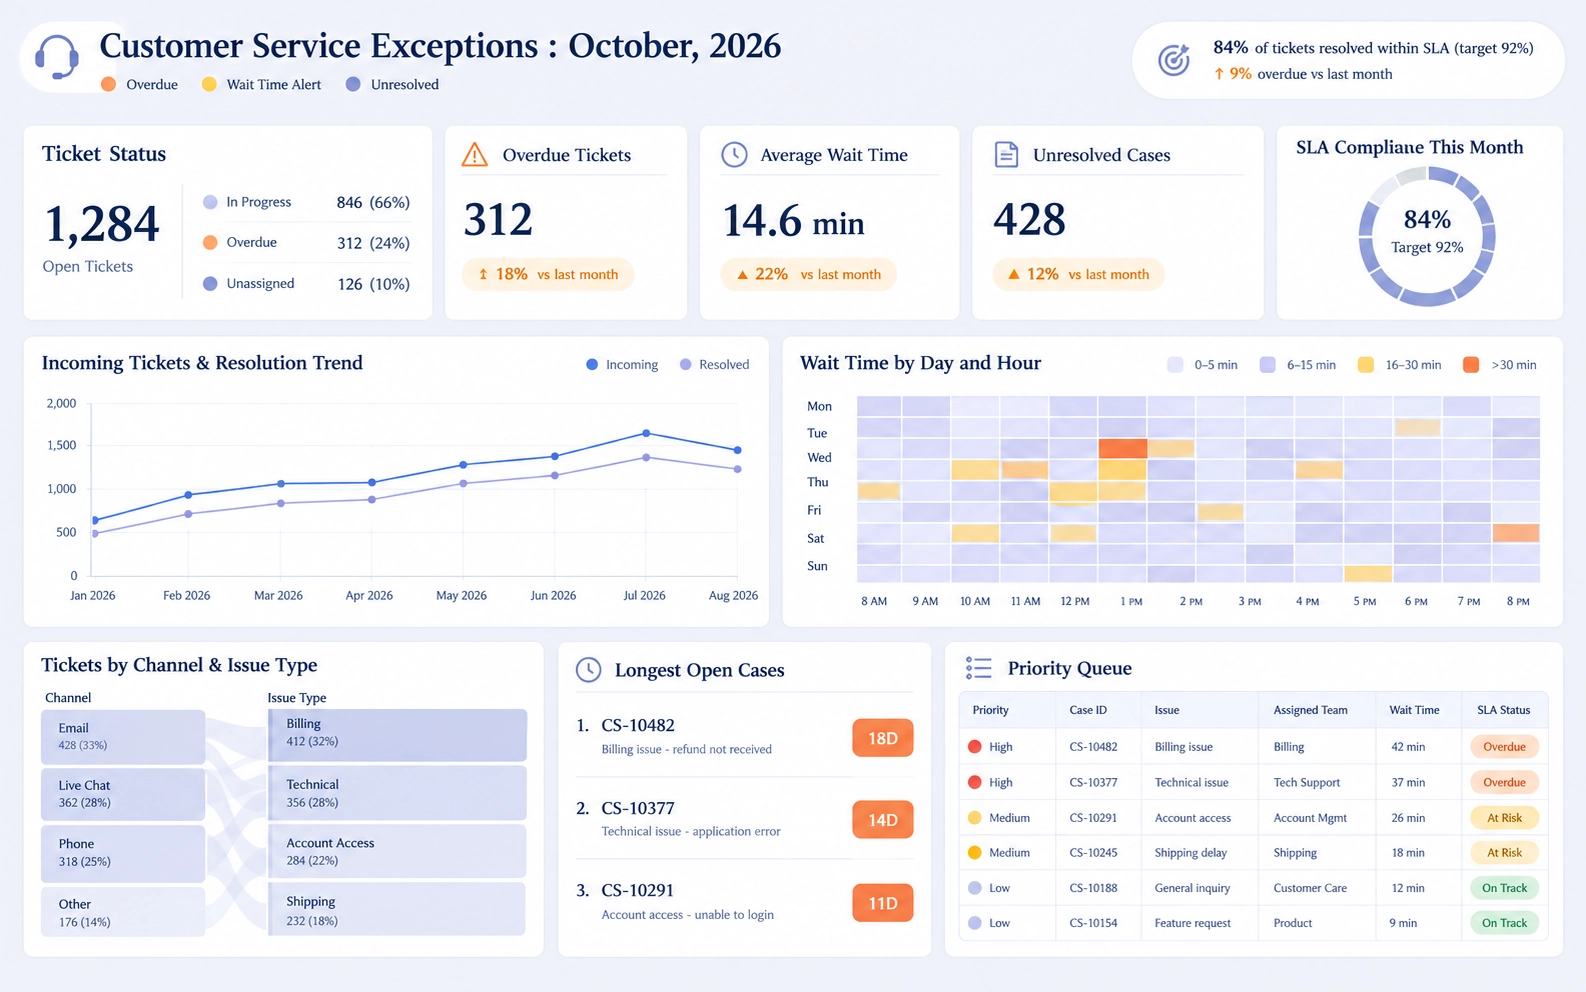
Modern analytics and dashboard platforms can display KPI Dependency Trees using interactive visualizations.
Users can click on high-level KPIs and drill down into the contributing metrics that drive performance.
Dashboard software may incorporate:
- Hierarchical metric maps.
- Drill-down navigation.
- Impact analysis indicators.
- Threshold alerts.
- Root-cause investigation workflows.
- Cross-functional KPI relationships.
These capabilities transform KPI management from passive monitoring into proactive performance optimization.
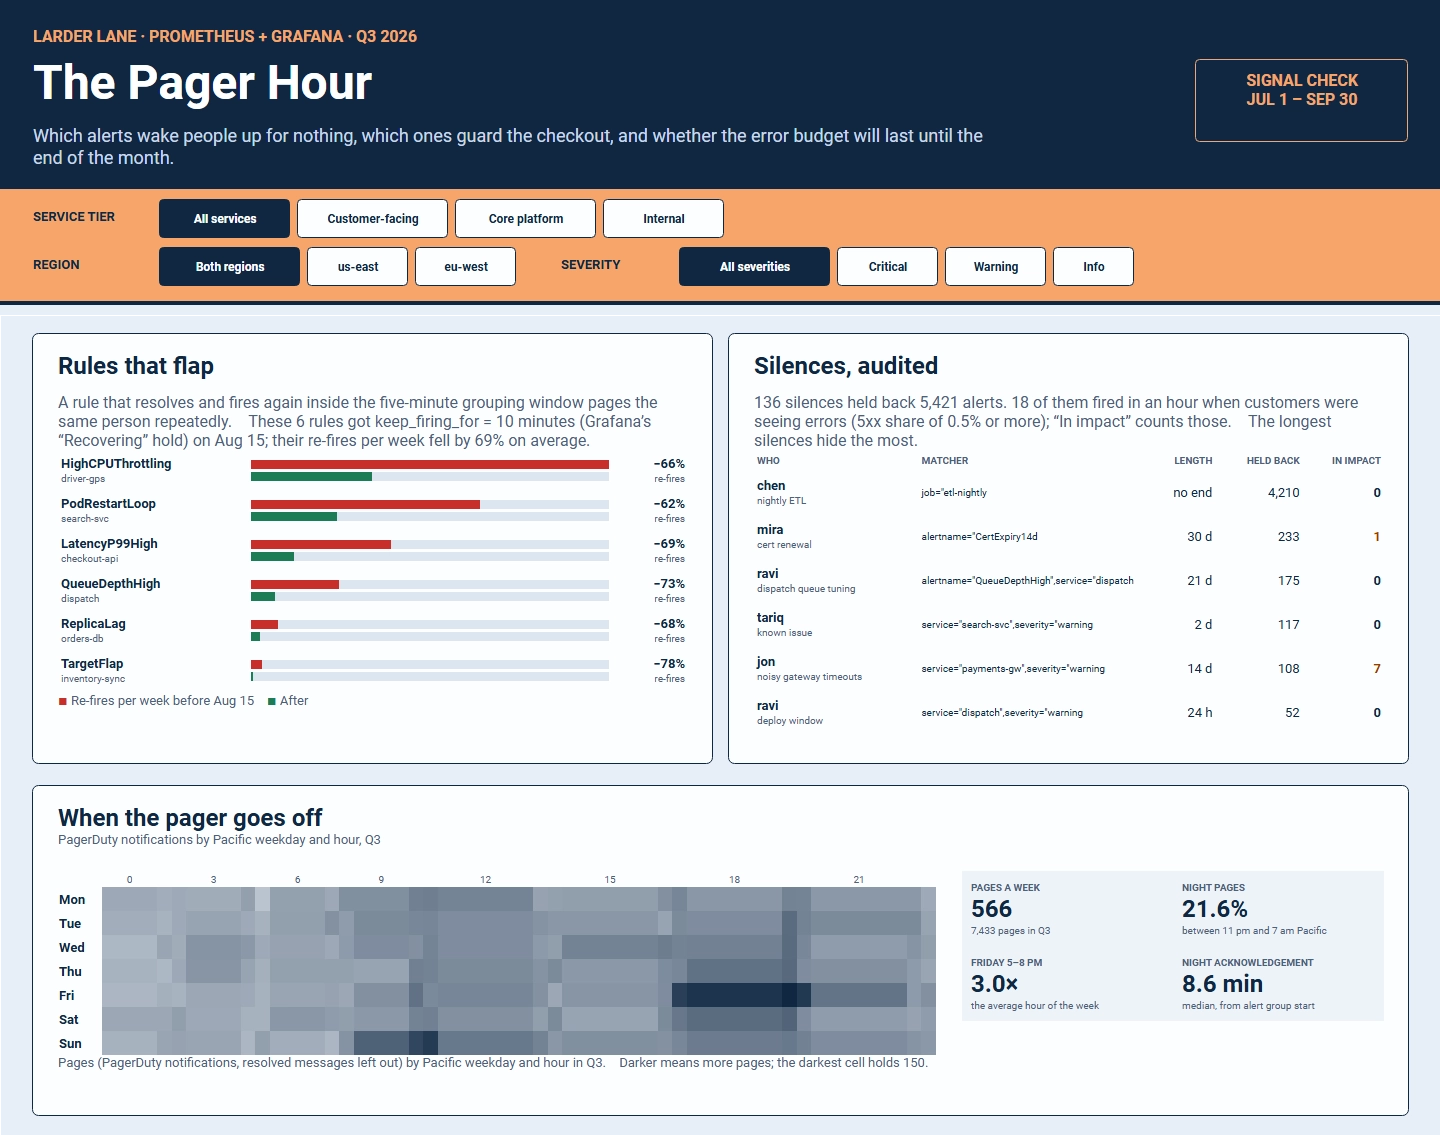
Building KPI Dependency Trees with StyleBI
StyleBI enables organizations to integrate data from multiple operational systems and present KPI
relationships through interactive dashboards. Business users can visualize strategic objectives, monitor
performance drivers, and identify bottlenecks affecting enterprise outcomes.
Through drill-down analytics, scorecards, and real-time performance monitoring, teams can explore the
dependencies between metrics and focus improvement efforts where they will produce the greatest business
impact.
Best Practices for Creating a KPI Dependency Tree
- Start with a clearly defined strategic objective.
- Identify measurable drivers of success.
- Limit complexity by focusing on significant dependencies.
- Validate relationships using historical performance data.
- Review and update the tree regularly.
- Ensure ownership exists for every KPI.
- Use dashboards to make relationships visible to stakeholders.
A Powerful Framework for
Understanding Organizational Performance
A KPI Dependency Tree is a structured view of how business metrics influence one another. It helps
organizations move beyond isolated report KPI tracking by exposing the underlying drivers of performance. By
connecting operational activities to strategic outcomes, dependency trees improve alignment, accountability,
and decision-making. When combined with modern dashboard software, they provide a powerful framework for
understanding and improving organizational performance.