LinkedIn Page Intelligence Dashboard
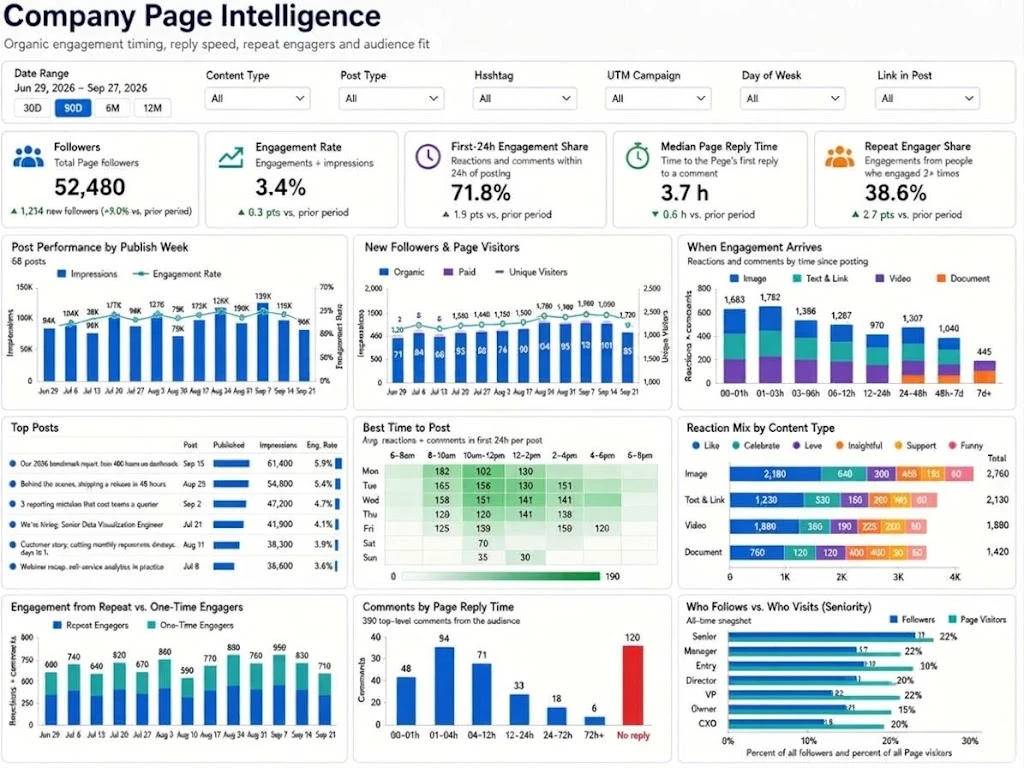
A LinkedIn Page Intelligence Dashboard provides marketing teams, social media managers, recruiters, and business leaders with a comprehensive view of company page performance. The dashboard combines audience growth, content engagement, posting effectiveness, visitor demographics, and community interaction metrics into a single reporting environment. By transforming LinkedIn activity into actionable business intelligence, organizations can optimize their content strategy, improve audience engagement, and strengthen brand visibility.
As LinkedIn continues to serve as one of the most important professional networking platforms, understanding how audiences interact with company content is critical. A LinkedIn Page Intelligence Dashboard enables organizations to measure which posts generate the most engagement, identify audience preferences, monitor follower growth, and evaluate how effectively the company page supports marketing and business development goals.

Flexible Analysis Controls
The dashboard includes multiple filters that allow users to analyze page performance from different perspectives. Common filters include date range, content type, post type, hashtag, UTM campaign, day of week, and link presence. These controls help users isolate specific campaigns, content categories, or publishing strategies.
Instead of reviewing individual post reports one at a time, organizations can compare months of social media activity and identify patterns that influence overall page performance. This flexibility makes the dashboard useful for both executive reporting and day-to-day social media management.
Key Performance Indicators
At the top of the dashboard are several performance indicators that summarize overall page health. Metrics typically include total followers, engagement rate, first-day engagement share, median reply time, and repeat engager percentage.
Follower count measures audience size and serves as an indicator of brand reach. Engagement rate measures interactions relative to impressions and helps determine how effectively content resonates with viewers. First-day engagement share reveals how much engagement occurs within the first 24 hours of posting, providing insight into content visibility and platform algorithms.
Median reply time measures how quickly administrators respond to comments and interactions. Faster responses often improve audience satisfaction and strengthen community engagement. The repeat engager metric identifies how much engagement comes from returning users, helping organizations understand audience loyalty and content relevance.
Post Performance by Week
The Post Performance by Publish Week chart combines impressions and engagement rates to evaluate publishing success over time. This visualization helps marketing teams understand whether content performance is improving, remaining stable, or declining.
Weekly analysis can reveal seasonal patterns, promotional impacts, and emerging audience interests. Significant increases in impressions may indicate successful topics or strong audience engagement, while declining performance may suggest that content strategies need adjustment.
By comparing publishing periods, marketers can determine which tactics consistently generate visibility and interaction.
Follower and Visitor Growth
The New Followers and Page Visitors section tracks both audience expansion and page traffic. The dashboard distinguishes between organic and paid follower acquisition while comparing these metrics against visitor activity.
Follower growth is important because it represents the expansion of a company's professional audience. Visitor metrics help determine how effectively content, advertising campaigns, and corporate branding efforts drive interest in the organization.
Monitoring follower and visitor trends together provides a more complete picture of audience development and brand awareness.

When Engagement Arrives
Understanding how quickly audiences react to content is critical for optimizing LinkedIn marketing strategies. The When Engagement Arrives chart shows reactions, comments, and interactions based on the amount of time that has passed since publication.
Many organizations discover that a significant portion of engagement occurs within the first few hours after posting. This insight can influence content promotion strategies, employee advocacy efforts, and publishing schedules.
The dashboard may also separate engagement by content format, such as text and link posts, videos, or documents, providing additional insights into audience behavior.
Top Performing Posts
The Top Posts section identifies the content that generated the highest levels of visibility and interaction. Metrics such as impressions, engagement rate, and publication date allow marketers to compare the effectiveness of different content themes.
High-performing posts often reveal valuable insights about audience interests. Topics related to industry trends, company achievements, product innovations, customer success stories, and thought leadership frequently generate stronger engagement.
Organizations can use these findings to improve future content planning and focus resources on topics that consistently resonate with their audience.

Best Time to Post
The Best Time to Post heat map helps social media managers identify the most effective publishing windows throughout the week. By measuring average reactions and comments across different times and days, the dashboard highlights periods of peak audience activity.
Publishing during high-engagement periods can improve visibility and increase the likelihood of attracting comments, reactions, and shares. Rather than relying on assumptions, organizations can use performance data to optimize publishing schedules.
This data-driven approach helps maximize the impact of every LinkedIn post.
Reaction Analysis by Content Type
Not all engagement is the same. The Reaction Mix by Content Type section breaks down audience reactions across various types of content. Metrics may include likes, celebrations, support reactions, insightful responses, and other forms of interaction.
Understanding reaction patterns helps organizations evaluate audience sentiment toward different content categories. For example, educational content may generate more insightful reactions, while company culture posts may attract greater supportive engagement.
These insights help marketers refine content strategies and better align messaging with audience expectations.

Repeat Versus One-Time Engagement
The Engagement from Repeat versus One-Time Engagers analysis compares loyal followers with occasional participants. Repeat engagers often represent a company's most valuable audience because they consistently interact with content and help amplify brand visibility.
Monitoring the balance between repeat and one-time engagement helps organizations evaluate audience loyalty and community strength. Strong repeat engagement often indicates that content provides ongoing value to followers.
Comment Response Performance
The Comments by Page Reply Time chart measures how quickly page administrators respond to audience comments. Fast response times can improve community relationships and demonstrate active participation in conversations.
Organizations that actively engage with followers often create stronger professional communities and encourage additional discussion around their content. Response monitoring also helps ensure service-level expectations are met.

Audience Demographics and Seniority
The dashboard includes demographic insights comparing followers and page visitors by seniority level. Categories may include executives, owners, directors, managers, and individual contributors.
Understanding who engages with a LinkedIn page allows organizations to tailor messaging to decision-makers and target audiences. If a company is attempting to reach senior executives, demographic reporting can reveal whether content is attracting the intended audience.
These insights support marketing strategy, recruitment efforts, brand positioning, and account-based marketing initiatives.
Business Value of a LinkedIn Page Intelligence Dashboard
A LinkedIn Page Intelligence Dashboard transforms social media activity into strategic business intelligence. By combining follower growth, engagement metrics, content analysis, audience demographics, posting efficiency, and response performance in a single environment, organizations gain a complete understanding of their LinkedIn presence.
Marketing teams can use these insights to improve content planning, optimize publishing schedules, strengthen audience engagement, and increase brand awareness. The dashboard supports data-driven decision making that leads to more effective social media strategies, stronger professional communities, and greater business impact from LinkedIn marketing efforts.