Information About Making Service Dashboards
What Are the Types of Service Dashboards?
Service dashboards are visual tools that help organizations monitor and improve the performance of their service operations. They consolidate key metrics, trends, and alerts into a single view, enabling teams to quickly understand what is happening and where action is needed. Because service environments vary widely—from IT support to field maintenance to customer service—different types of dashboards have evolved to address specific operational needs. Below is a structured overview of the major types of service dashboards and what each one is designed to accomplish.
1. Customer Service Dashboards
Customer service dashboards focus on the performance of support teams that handle inquiries, complaints, and requests. These dashboards help leaders understand workload, responsiveness, and customer satisfaction.
- Ticket Volume Dashboards: Track incoming, open, and resolved tickets across channels such as phone, email, chat, and social media.
- Agent Performance Dashboards: Monitor average handle time, first contact resolution, agent utilization, and queue performance.
- Customer Satisfaction Dashboards: Display CSAT scores, survey results, sentiment trends, and service quality indicators.
- SLA Compliance Dashboards: Show response and resolution times compared to service-level agreements.
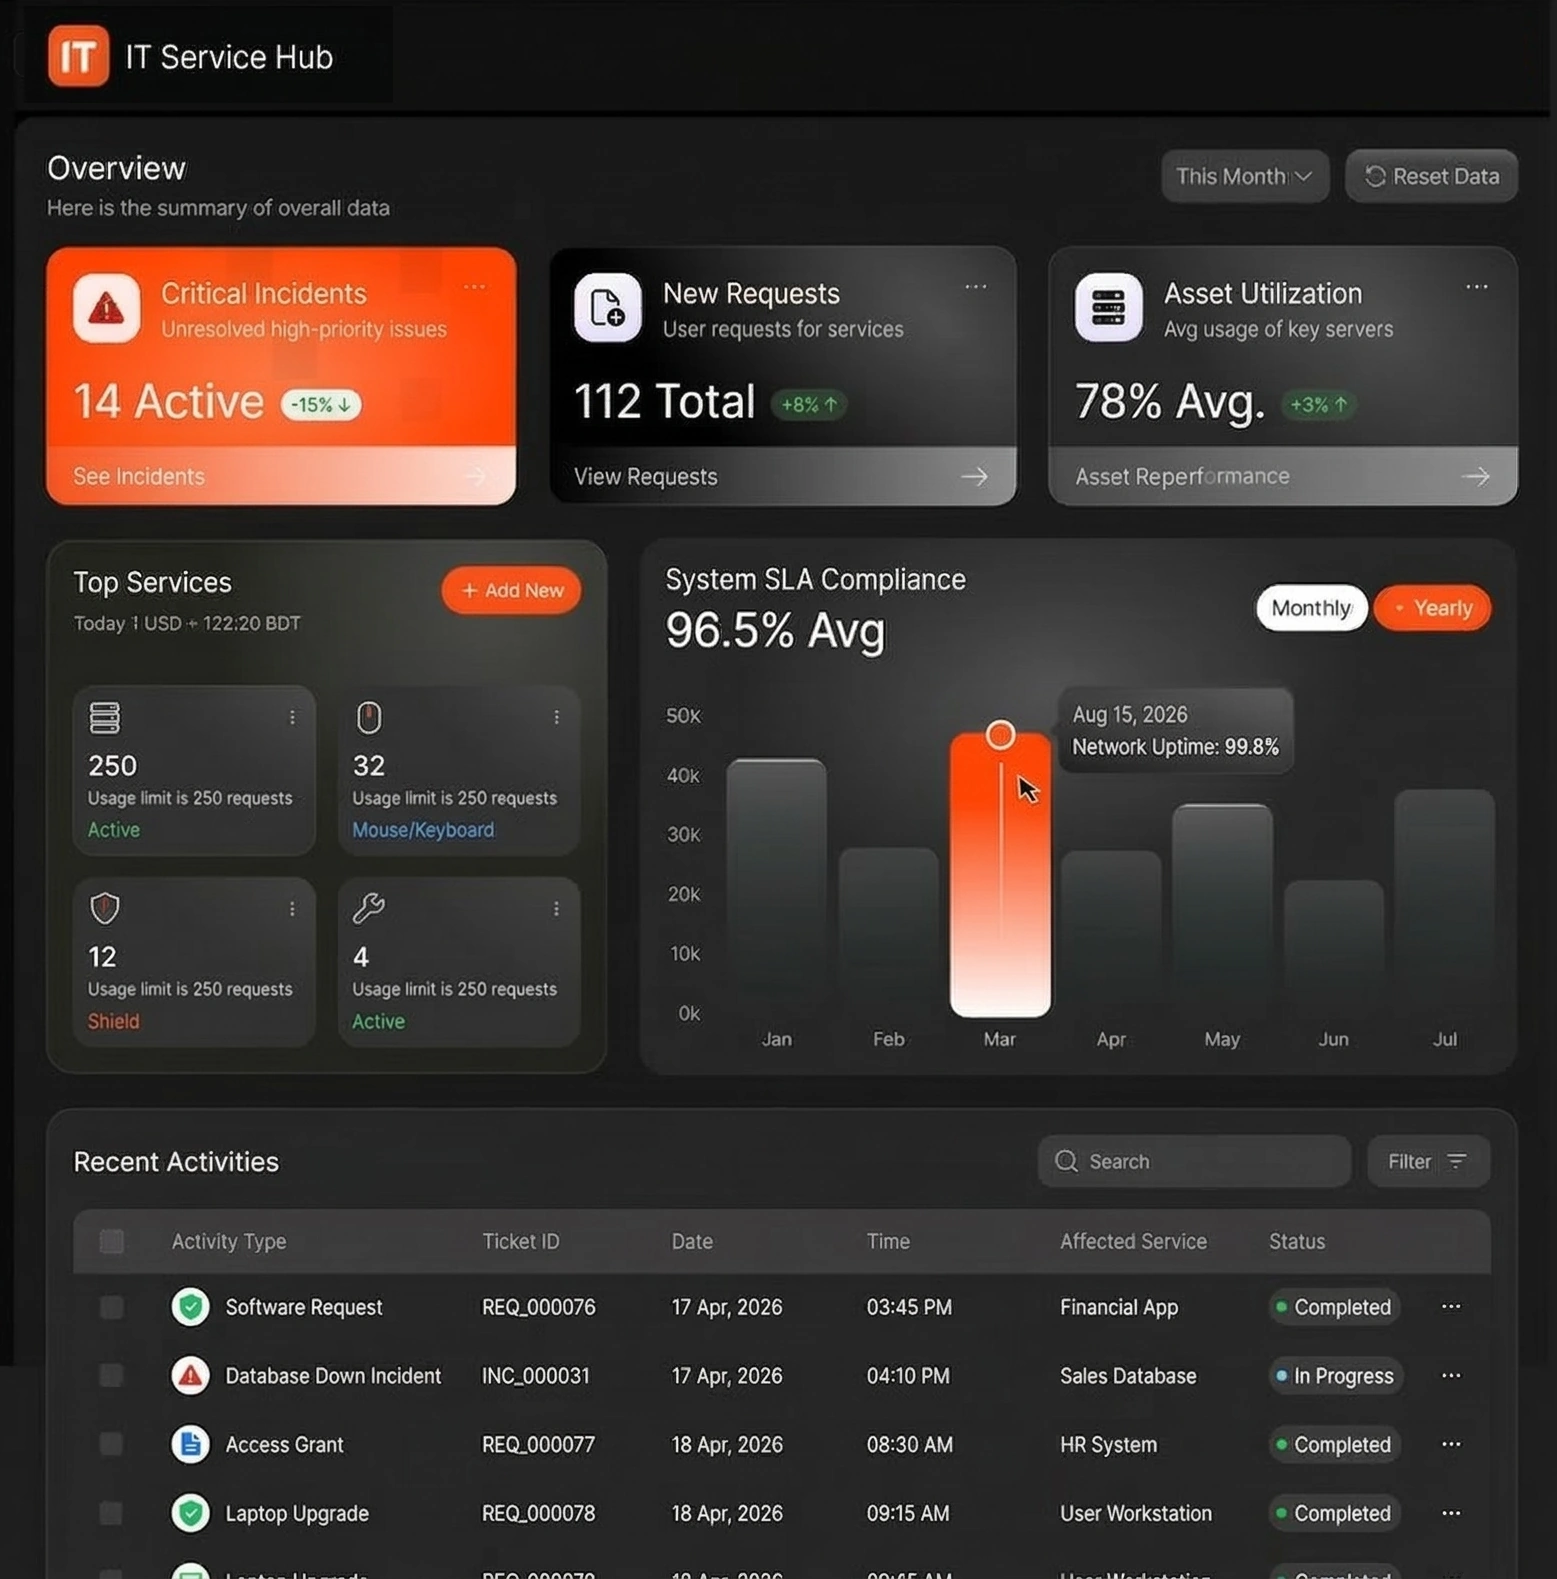
2. IT Service Management (ITSM) Dashboards
ITSM dashboards support teams responsible for managing incidents, problems, changes, and IT service delivery. They help maintain system stability and ensure that IT services meet business expectations.
- Incident Management Dashboards: Track incident counts, severity levels, resolution times, and trends.
- Problem Management Dashboards: Highlight recurring issues, root cause analysis progress, and long-term remediation efforts.
- Change Management Dashboards: Display planned changes, change success rates, and the impact of failed changes.
- Service Availability Dashboards: Monitor uptime, outages, and performance of critical IT services.
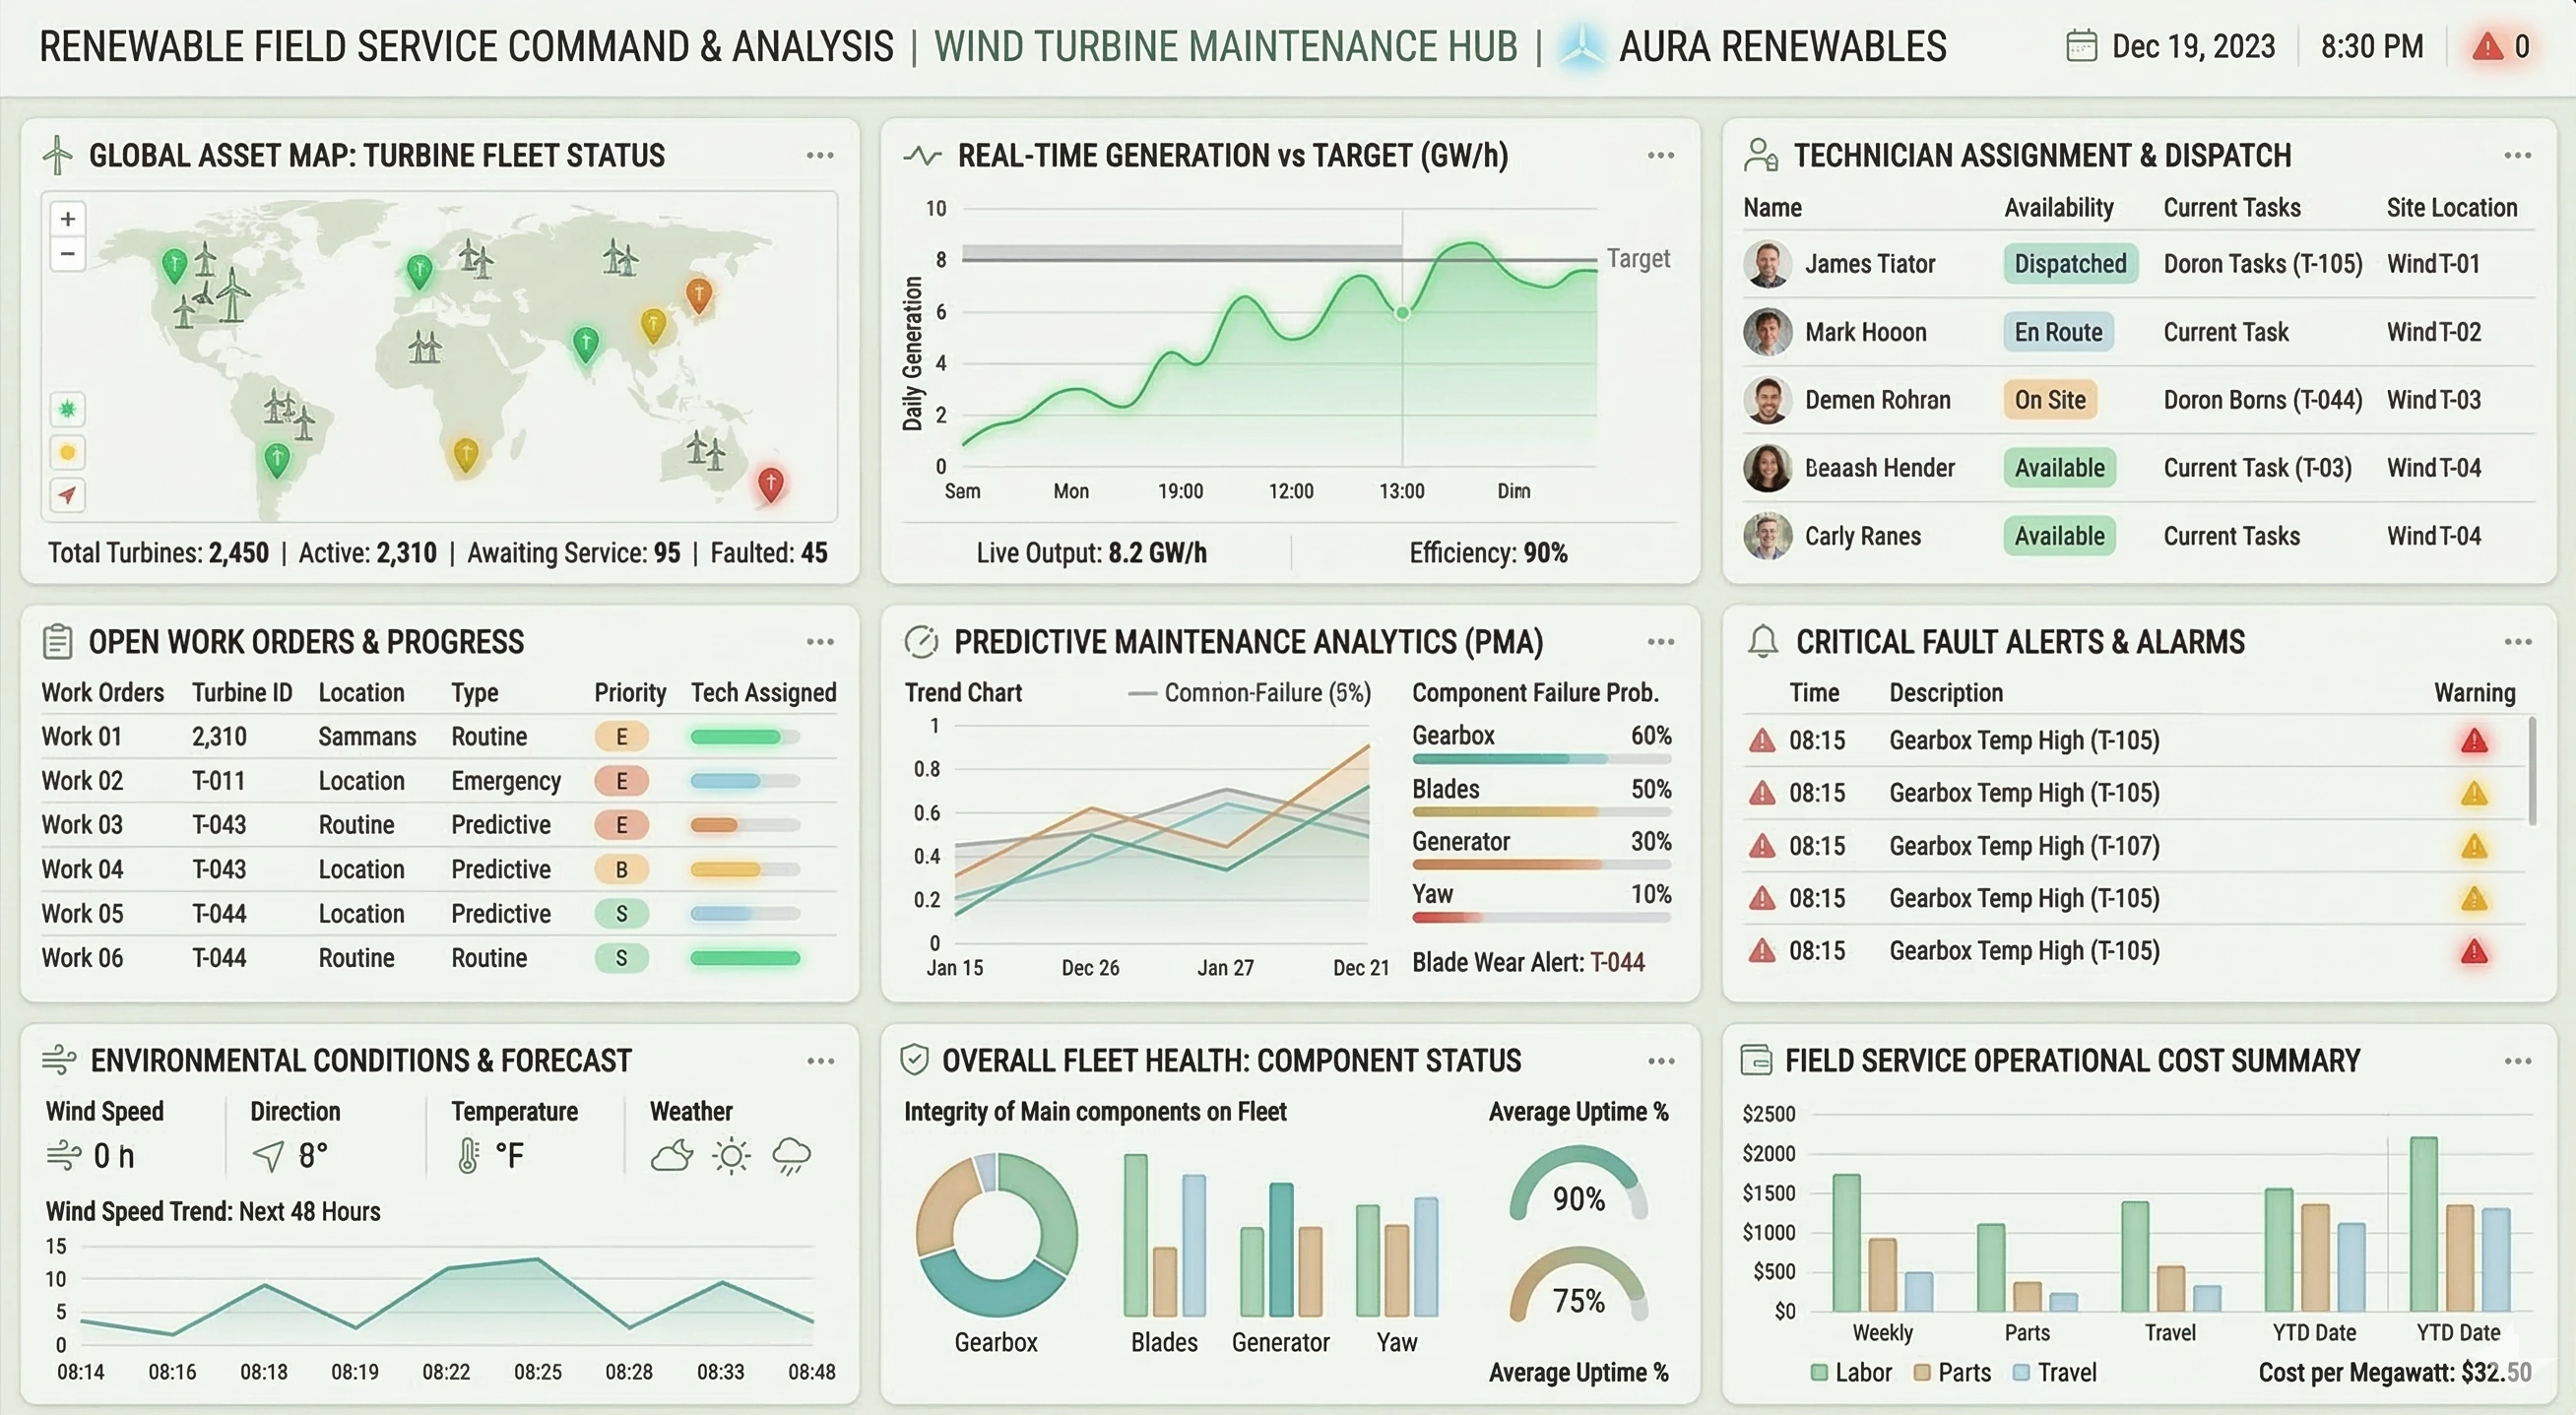
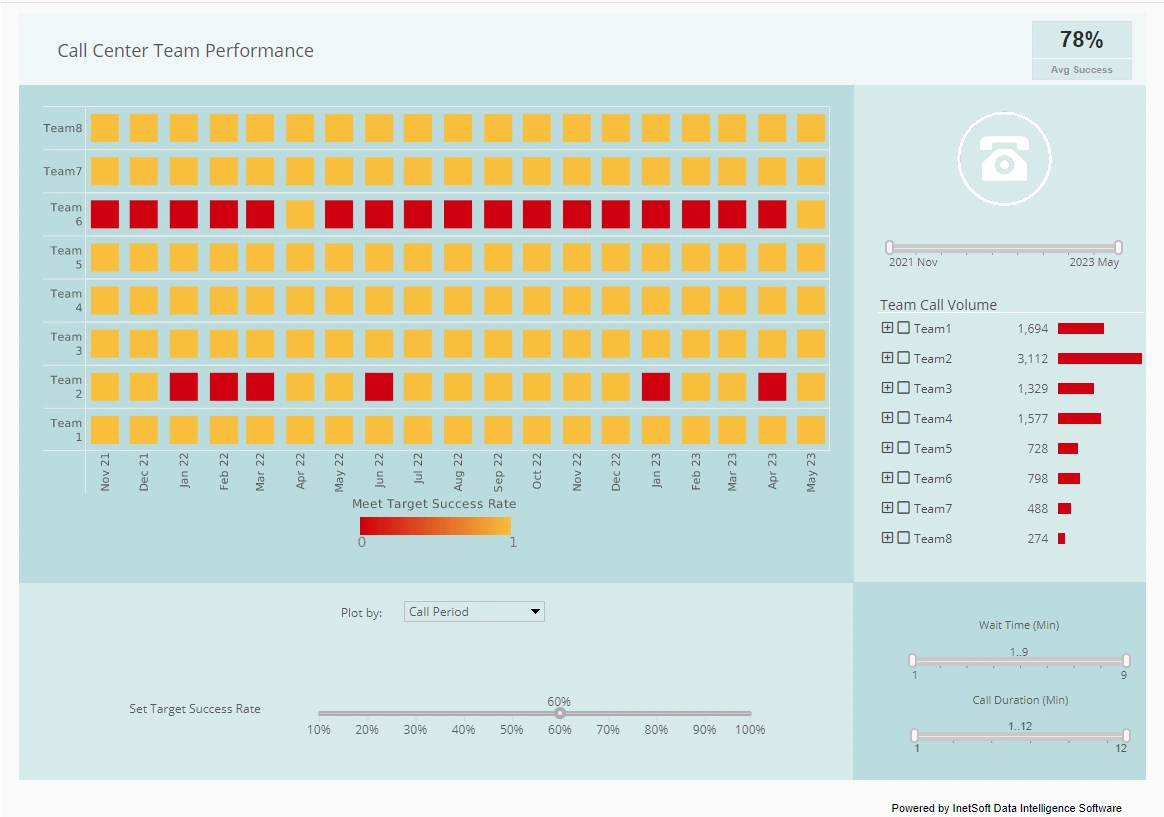
3. Field Service Dashboards
Field service dashboards support organizations that dispatch technicians to customer sites for repairs, installations, inspections, or maintenance. They emphasize logistics, workforce efficiency, and service quality.
- Work Order Dashboards: Track open, scheduled, and completed work orders, along with priority levels.
- Technician Performance Dashboards: Show productivity, first-time fix rates, travel time, and job duration.
- Dispatch and Routing Dashboards: Visualize technician locations, route efficiency, and real-time job assignments.
- Asset Service Dashboards: Monitor service history, failure rates, and maintenance schedules for customer assets.
4. Service Operations Dashboards
Service operations dashboards provide a high-level view of overall service performance across teams, processes, and channels. They are often used by executives and operations managers.
- Operational Efficiency Dashboards: Track throughput, cycle times, bottlenecks, and resource utilization.
- Capacity and Forecasting Dashboards: Show demand trends, staffing needs, and future workload projections.
- Quality and Compliance Dashboards: Monitor adherence to standards, audit results, and error rates.
- Financial Performance Dashboards: Highlight service costs, revenue from service contracts, and profitability.
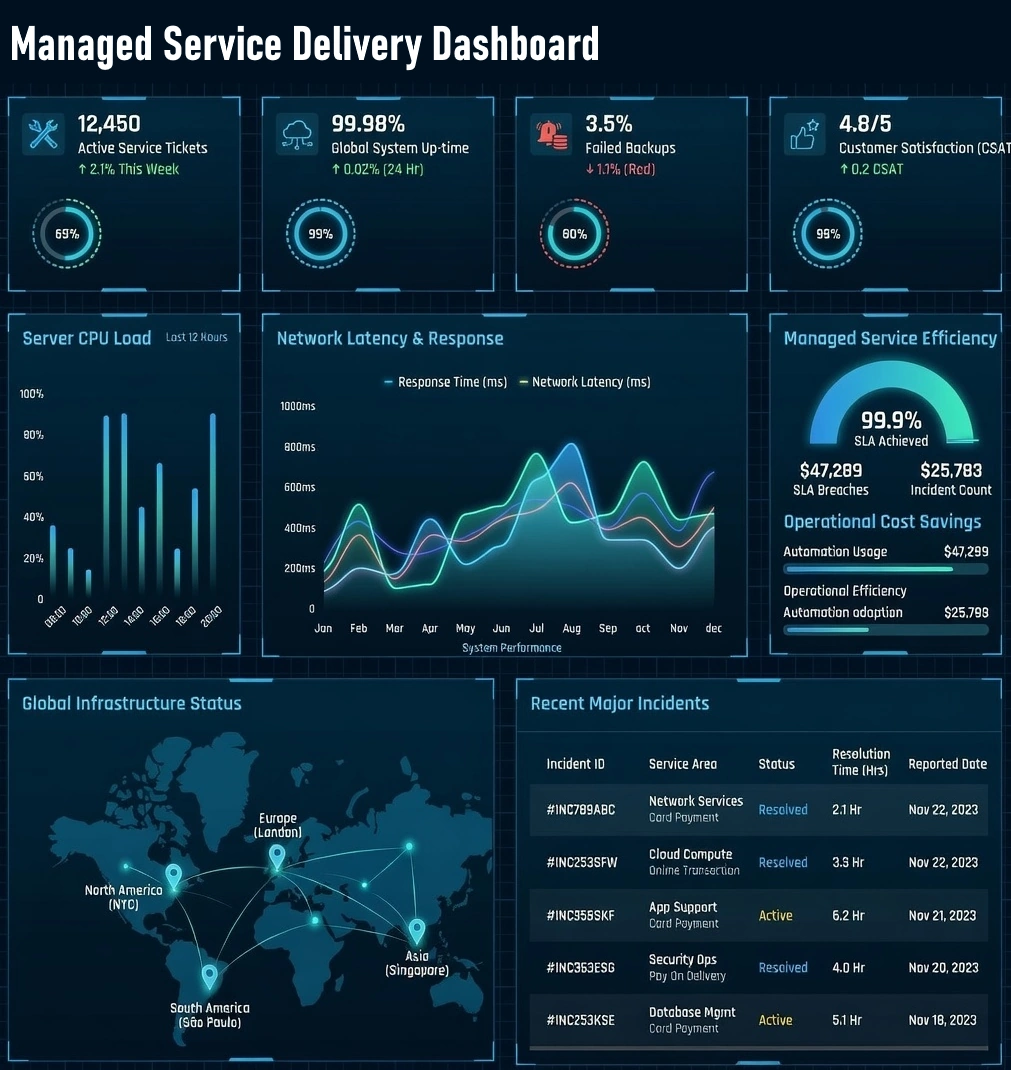
5. Service Delivery Dashboards
Service delivery dashboards focus on the end-to-end delivery of services, especially in managed services, consulting, and subscription-based businesses. They emphasize commitments, outcomes, and customer value.
- Contract Performance Dashboards: Track SLA compliance, contract utilization, and service credits.
- Project-Based Service Dashboards: Show progress, risks, and deliverables for service engagements.
- Customer Health Dashboards: Highlight adoption, usage, satisfaction, and renewal risk.
- Outcome Delivery Dashboards: Measure whether promised results or KPIs are being achieved.
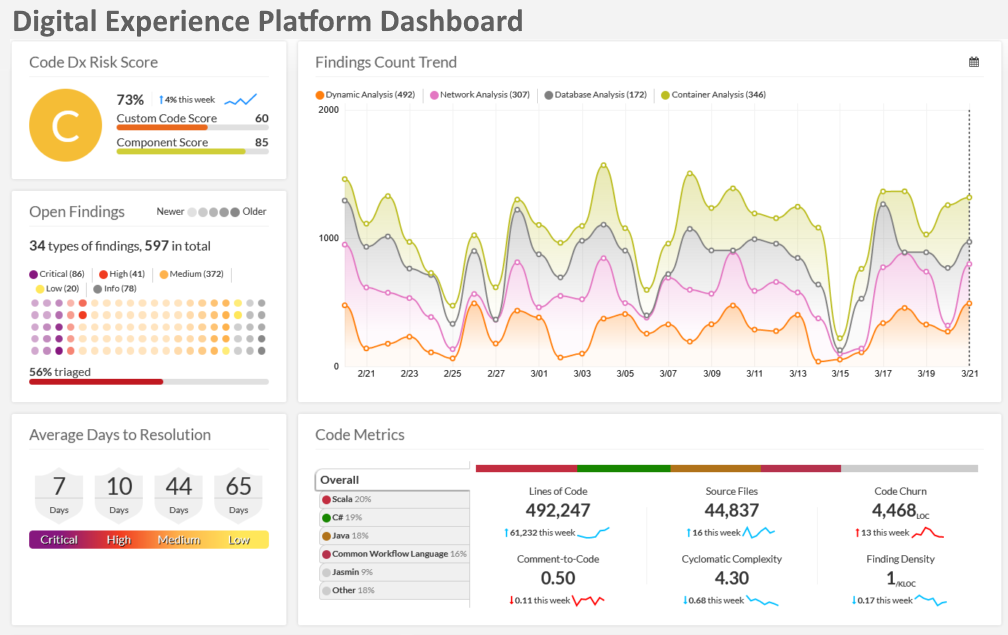
6. Self-Service and Digital Experience Dashboards
As more organizations adopt digital self-service, dashboards are needed to track how customers interact with portals, knowledge bases, and automated tools.
- Self-Service Adoption Dashboards: Measure portal usage, search behavior, and deflection rates.
- Knowledge Base Performance Dashboards: Track article views, helpfulness ratings, and content gaps.
- Chatbot and Automation Dashboards: Show automation success rates, escalation rates, and user satisfaction.
- Digital Experience Dashboards: Monitor page load times, error rates, and user journey friction points.
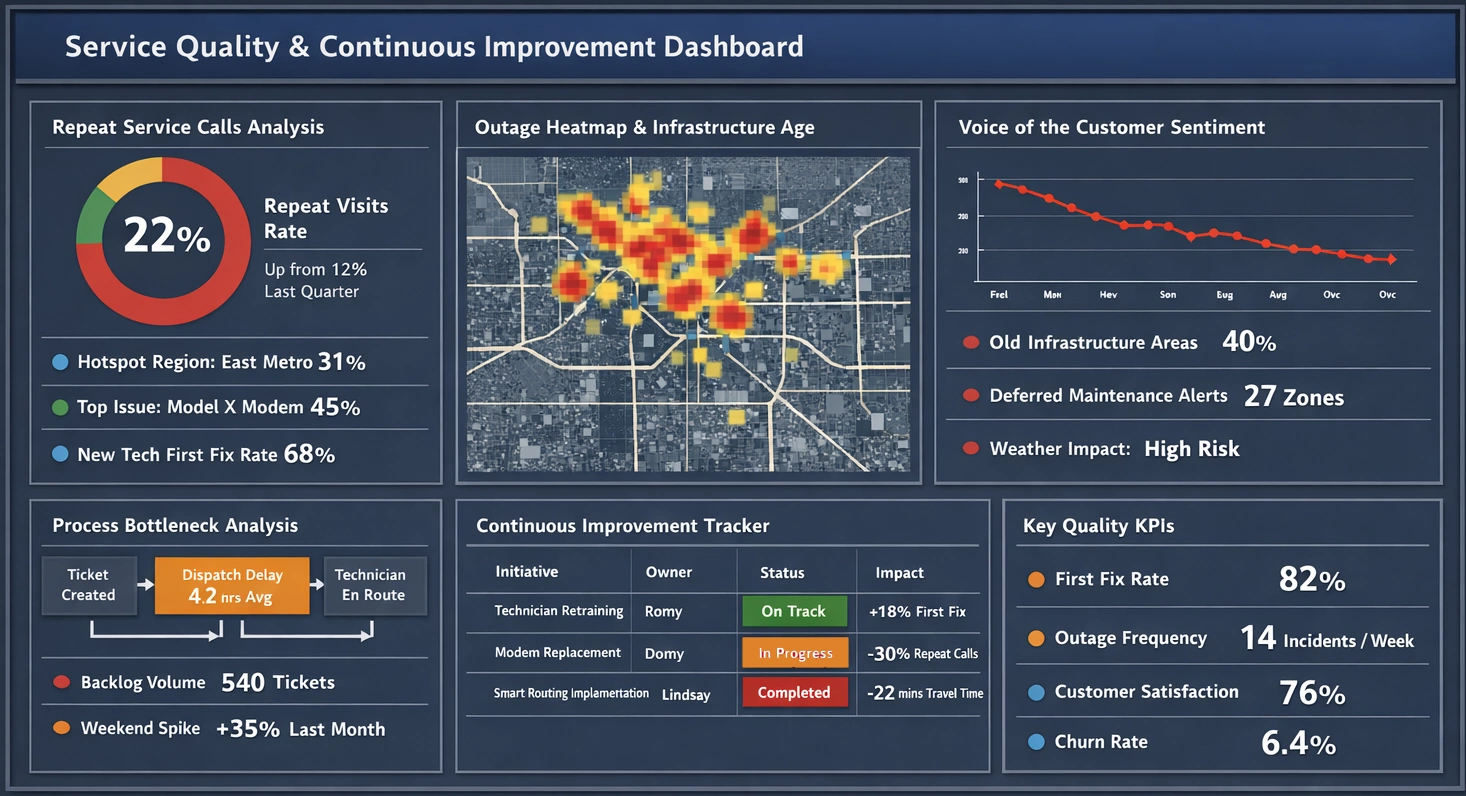
7. Service Quality and Continuous Improvement Dashboards
These dashboards focus on long-term improvement rather than daily operations. They help teams identify systemic issues and track progress on improvement initiatives.
- Root Cause Dashboards: Categorize issues by cause, frequency, and impact.
- Process Improvement Dashboards: Track improvement projects, KPIs, and before/after comparisons.
- Voice of the Customer Dashboards: Aggregate feedback, surveys, complaints, and sentiment trends.
- Quality Scorecard Dashboards: Summarize quality KPIs across teams and processes.
Together, these types of service dashboards give organizations a comprehensive toolkit for managing service performance. Whether the goal is operational efficiency, customer satisfaction, regulatory compliance, or strategic alignment, the right dashboard provides clarity and focus in complex service environments.
BI Dashboard - Information for those researching BI dashboard solutions, why to evaluate InetSoft's flexibly-priced BI software for dashboards, reports & analytics. StyleBI is business intelligence software for dashboards, reporting, and analysis. It blends enterprise strength with a small, 100% Java footprint. Unlike traditional BI platforms, Style Intelligence does not require specialized BI skills or consultants to implement or use. Patent pending Data Block technology is the foundation for StyleBI’s flexible and high performance data access. Technologists as well as end users can dynamically assemble, transform, and mash up data in a Lego-like fashion. Compressed, in-memory data representation ensures efficient and rapid responses to user data requests. Two applications are built on top of this Data Block technology: visualization and publishing. * Visualization provides interactive information access that enables exploration,for example,interactive dashboards. * Publishing allows for codification and distribution of information to a wide audience through publishing technologies, exemplified by pixel-perfect reports...
Additional Resources


BI Dashboard Examples- StyleBI does not require a desktop based server. It is web based and compatible with popular internet search providers, it can work with or without flash plugins and is accessible on mobile devices. Take a look at the versatility of BI implentation with our dashboard software. Click on the dashboard images to get a better look:..
BI Dashboarding Examples - BI dashboards allow businesses to examine intricate business data efficiently and effectively. The unique dashboard designs allow for easy use across a wide range of different visual graphs. BI dashboards can be easily manipulated as to allow different levels of data to appear on the same screen. The ease of use and streamlined functionality of BI dashboards make them a key element in running an effective business...

BI Dashboard Reporting for Microsoft SQL Server Analysis Services - Looking for a BI dashboard reporting solution to access Microsoft SQL Server Analysis Services? InetSoft's StyleBI integrates easily with MSSAS for dashboard reporting and data mashups. StyleBI's versatile data mashup engine pulls data from many disparate sources for reporting and analysis functions. In addition to MSSAS, Style Intellience can integrate other operational databases such as Hyperion Essbase, Oracle OLAP, and SAP NetWeaver. Microsoft SQL Server Analysis Services is a comprehensive BI reporting tool. However, used alone, it lacks visual simplicity, making analysis cumbersome. With StyleBI on top of your OLAP Server, you can easily make eye-popping charts, graphs, and dashboards that clearly communicate business conditions and needs. The simple, java-based application can be learned easily by any employee, regardless of IT background...
BI Dashboard Software - Researching BI dashboard solutions for your organization's internal use or to embed in a commercial application? Deploy a small-footprint, easy-to-use Flash-based dashboard application from InetSoft. As an innovator in reporting software since 1996, InetSoft has pioneered the evolution from static reporting towards interactive visualization of data via dashboards...
BI Dashboard Solution for Progress DataDirect - With any business intelligence solution, it is important to have full access to all relevant data and information within a company. These data sets are stored in databases where dashboard reporting software can retrieve and compile information in order to build data visualizations and/or analytical reports. InetSoft offers users flexibility through secure connections, such as Progress DataDirect. StyleBI can access multiple, disparate databases, databases via a JDBC connector, as well...

BI Executive Dashboard Solution - Looking for a good BI executive dashboard solution? InetSoft is a pioneer in self-service dashboard reporting software with an easy-to-use dashboard designer. View a demo and try interactive examples...
Big Data Dashboard Tool - Looking for good big data dashboard tools? InetSoft's pioneering dashboard reporting application makes producing great-looking web-based reports and dashboards easy with a drag-and-drop designer and the ability to connect to all types of big data sources. View a demo and try interactive examples...
Black Friday Deals - A free interactive shopping dashboard that lets your sort through thousands of Black Friday sales to find what you want. Compared to poring over dozens of newspaper circulars or clicking through all those pages at places like bfads.net, this visual analysis tool will save you a great deal of time and effort. What Can You Do With This Interactive Dashboard? Filter by price, coupon, or rebate. Search by product categories, brands, or stores. Click on the product link to see the item directly on the seller’s page Click on the store link to locate the nearest one. Select Sale Date: Pre Black Friday, Thanksgiving Day, Doorbusters, Black Friday, Saturday, or Sunday. Export your results to Excel or PDF, print them out and take them to the store with you...

Budget Monitoring Dashboard - StyleBI™ can pull your financial data from your operational financial systems and combine it with almost any other data source found in your enterprise including: relational databases (JDBC), multidimensional databases, XML, SOAP, Java beans (POJO), EJB beans, flat files, Excel spreadsheets, OLAP cubes, and the proprietary data stores from JDE, SAP, PeopleSoft, and Siebel CRM. In addition, InetSoft has innovated unique capabilities for budgetary mashups. You do not have to be a BI analyst to create your own mashups. You can combine disparate tables and fields that were not previously mapped in a data model. Moreover, you can also bring in your own data sets such as those in personal spreadsheets or those generated by vendors or partners. Whatever dashboards or reports you make from them are now shareable inside the financial BI space...
Build a Performance Dashboard - Building a performance dashboard? First and foremost, any performance dashboard should work for you and with you on your specific needs. A dashboard will be your business' GPS system that will help drive your organization to meet and go beyond goals and objectives. InetSoft delivers such a dashboard, one that is easy to use, sophisticated, and fully customizable through a self-service environment. Best Practices for Dashboard Building: Keep your eye on the prize: Define and keep your goals and objectives in mind, so that you can convert these to 'key metrics' or key performance indicators (KPI's) on your dashboards. It is recommended that organizations should start with a top-down approach, work with senior management to find out what they think the key performance indicators are. KPI's should be chosen because they reflect “Performance,” and they are the ones that employees can affect with their actions and decisions. Diversity: InetSoft's dashboarding software is intuitive so that it presents the data in the best way possible. It also has a diverse library of charts and graphs so that users can select the way they want to view the data thus, making vital information even more comprehensible to decision makers...
Build a Real Time Dashboard Using InetSoft - Are you looking for a good tool to build real time dashboards? InetSoft's pioneering BI application produces great-looking web-based dashboards with an easy-to-use drag-and-drop designer. Get cloud-flexibility for your deployment. Minimize costs with a small-footprint solution. Maximize self-service for all types of users. No dedicated BI developer required. View a demo and try interactive examples...
Builder of HTML5 Dashboards - Looking for a good HTML5 dashboard builder? InetSoft's pioneering dashboard reporting application produces great-looking web-based reports and dashboards with an easy-to-use drag-and-drop designer. View a demo and try interactive examples...
Building a Dashboard - In this chapter, we will walk through the creation of a simple viewsheet. Every viewsheet is based on a worksheet, and for this example we will use a preinstalled data worksheet called ‘ProductSales’. The ‘ProductSales’ data worksheet returns customer and order information. It is based on the sample ‘Orders’ database. Our viewsheet will incorporate output and selection components to provide for quick analysis of this sales data. 1. Launch the User Portal by clicking Start → All Programs → StyleBI → StyleBI Examples. 2. Select the User Portal. Under the Design tab, click the ‘Visual Composer’ link. The Visual Composer opens in a new window. The left-side panels in the Visual Composer are labeled ‘Asset’ and ‘Component’. The ‘Asset’ panel lists all data worksheets and viewsheets. The ‘Component’ panel lists all of the components available to a viewsheet. 3. Click the ‘New Viewsheet’ button. This opens the ‘New Viewsheet’ window. 4. Expand the ‘Global Worksheet’ node and the ‘Tutorial’ folder. Select the ‘ProductSales’ data worksheet and click ‘OK’. 5. In the ‘Component’ pane, expand the ‘ProductSales’ node, then drag the ‘SalesByDate’ data block from the left pane into the grid. This creates a table component and adds the data block’s columns...

Building a Great Dashboard - Dashboards are quintessential to study the key performance indicators (KPIs) of a project's progress. With the help of these panels, you can get a quick look at the vital information regarding your company's growth. Graphs, data tables, and balanced scorecards sum up the main points of the process. But for a dashboard to be efficient, it needs to have clear, concise, and coherent information. Additionally, the design and aesthetic features should help your data be visually pleasing and easy to read. In this article, you'll learn, step-by-step, how to design and build a great dashboard...
Building Dashboards without BI Expertise - And so if we move on to next slide, it gives you the idea of how we have looked at those traditional BI challenges and how we turn them around into product development of the features and the benefits that you can get from our BI software. We have aimed for our software to be as easy as possible to both deploy and install and get set up. You can expect implementation times that are more measured in weeks, it can be as low as two weeks, if you are focused on getting the software up and running. You can have a very usable interactive dashboard built in that kind of timeframe as well. Our software is easy for end-users, whether they be the analysts, who might be specialized in information access, but even typical business users find the software easy to use, especially if you give them a pre-built dashboard, they can then personalize and customize and explore the data a lot. Even those business users who have Excel level skills can build their own dashboard or report from scratch as you will see in a few minutes...
Building a Local Government Dashboard - The building of a local government dashboard is currently becoming one of the civic management priorities. Many students are now also interested in this topic and began to use it as topics in academic papers, but some lack knowledge in this area, so as an option they can turn to InetSoft for help...

Built-in Interactivity for Dashboards & Reports - The Designer provides the embedded Script implementation of all the methods discussed in this section. It is better to use the Designer to specify links and interactions, only using the API described below if the desired feature cannot be implemented from the visual interface. The BasicReplet API defines a number of methods for adding common user interactions to a replet. Each call to these methods causes some default event handlers to be registered in order to support that interaction. They serve as convenience functions as well as high-level encapsulations of the functionality. For most replets, the high-level methods are enough to handle most user interaction needs and programmers do not need to work with the lower level event handling API. There are three varieties of this method for adding a link to another element or report: 1. addLink(String eid, String replet) Add a hyperlink from the specified element (element ID) to a replet. When the element is clicked, the target replet is opened in a new window. 2. addLink(String eid, EventPoint item, String replet, RepletRequest req) Add a hyperlink from a data item in the specified element to a replet. The data item is identified by the element ID (String eid), and by the location of the item in an EventPoint object. The point can identify either a table cell or a chart data point. In the case of table cells, EventPoint.x is the column number and EventPoint.y is the row number. Row and column numbers can also be obtained by...
Business Analytics Dashboard - Don't rely on outmoded user-centric models that make you constantly rely on IT intervention. StyleBI™ is a BI platform that creates beautiful dashboard mashups allowing nontechnical users to quickly access, integrate, and display BI data. It functions from a variety of operational data sources, including those that are not integrated into the existing data warehouse. StyleBI™ is comprehensive without being complex; no need to understand the intricacies of the underlying data schemas like a technical genius. Anyone in your business can use it...
Business Dashboard Advantages - A bulleted list of advantages of choosing InetSoft for your business dashboard needs. Whether you're a medium-sized business or a global enterprise, InetSoft is an affordable option that scales up for all sizes...
Business Dashboard Demo - Looking for a good demo of a business dashboard application? Since 1996 InetSoft has been making dashboard software that is easy to deploy and easy to use. Build self-service oriented dashboards quickly . View a demo and download a free version...
Business Dashboard Download - Looking to download a good business dashboard application? Since 1996 InetSoft has been making dashboard software that is easy to deploy and easy to use. Build self-service oriented dashboards quickly . View a demo and download a free version...

Business Dashboard Examples - Dashboards built with InetSoft's Flex-based Web dashboard software are effective and easy. View some examples of analytic, sales, and executive dashboards that are meant to be both appealing and help improve your business performance and decisions...
Business Dashboard Tool - Looking for the best business dashboard tool? Since 1996 InetSoft has been making dashboard software that is easy to deploy and easy to use. Build self-service oriented dashboards quickly . View a demo and read customer reviews...