Traffic Management Dashboards: Improving Flow, Safety, and Urban Mobility
Traffic congestion is one of the most visible and costly challenges facing modern cities.
As urban populations grow and transportation networks become more complex, municipalities and transportation agencies must rely on real-time data to manage roadways efficiently. Traffic management dashboards have emerged as critical tools in this effort.
These dashboards provide a centralized, visual interface that aggregates data from multiple systems, enabling operators to monitor conditions, respond to incidents, and optimize traffic flow across entire regions.
A traffic management dashboard is a data visualization platform designed to monitor, analyze, and manage road network performance. It integrates information from traffic sensors, cameras, GPS devices, weather systems, public transit feeds, and incident reporting platforms. By transforming raw data into intuitive charts, maps, and performance indicators, these dashboards allow decision-makers to move from reactive problem-solving to proactive traffic optimization.


The Purpose of Traffic Management Dashboards
The primary objective of a traffic management dashboard is situational awareness. Operators need to understand what is happening on the roads at any given moment. Without a unified view, traffic managers would need to consult multiple disconnected systems, which slows response times and increases the risk of oversight.
Dashboards provide a single pane of glass that consolidates network-wide performance metrics. This real-time visibility enables traffic control centers to detect congestion hotspots, identify accidents quickly, coordinate emergency response, and adjust traffic signals dynamically. Beyond operational control, dashboards also support strategic planning by analyzing historical data trends, evaluating infrastructure investments, and measuring policy effectiveness.
Core Data Sources
Effective traffic dashboards rely on diverse and continuous data streams. Common sources include:
- Traffic sensors: Inductive loops, radar sensors, and magnetometers that measure vehicle count, speed, and occupancy.
- CCTV and video analytics: Cameras equipped with AI models to detect incidents, vehicle types, and pedestrian activity.
- GPS and mobile data: Aggregated vehicle location data from fleet systems, navigation apps, and connected vehicles.
- Weather systems: Real-time weather conditions that influence road safety and congestion patterns.
- Public transit feeds: Bus and train tracking systems to monitor multimodal coordination.
- Incident management systems: Police, fire, and emergency dispatch data that report accidents and road closures.
By combining these inputs, traffic management dashboards offer both micro-level and macro-level insights into transportation networks.
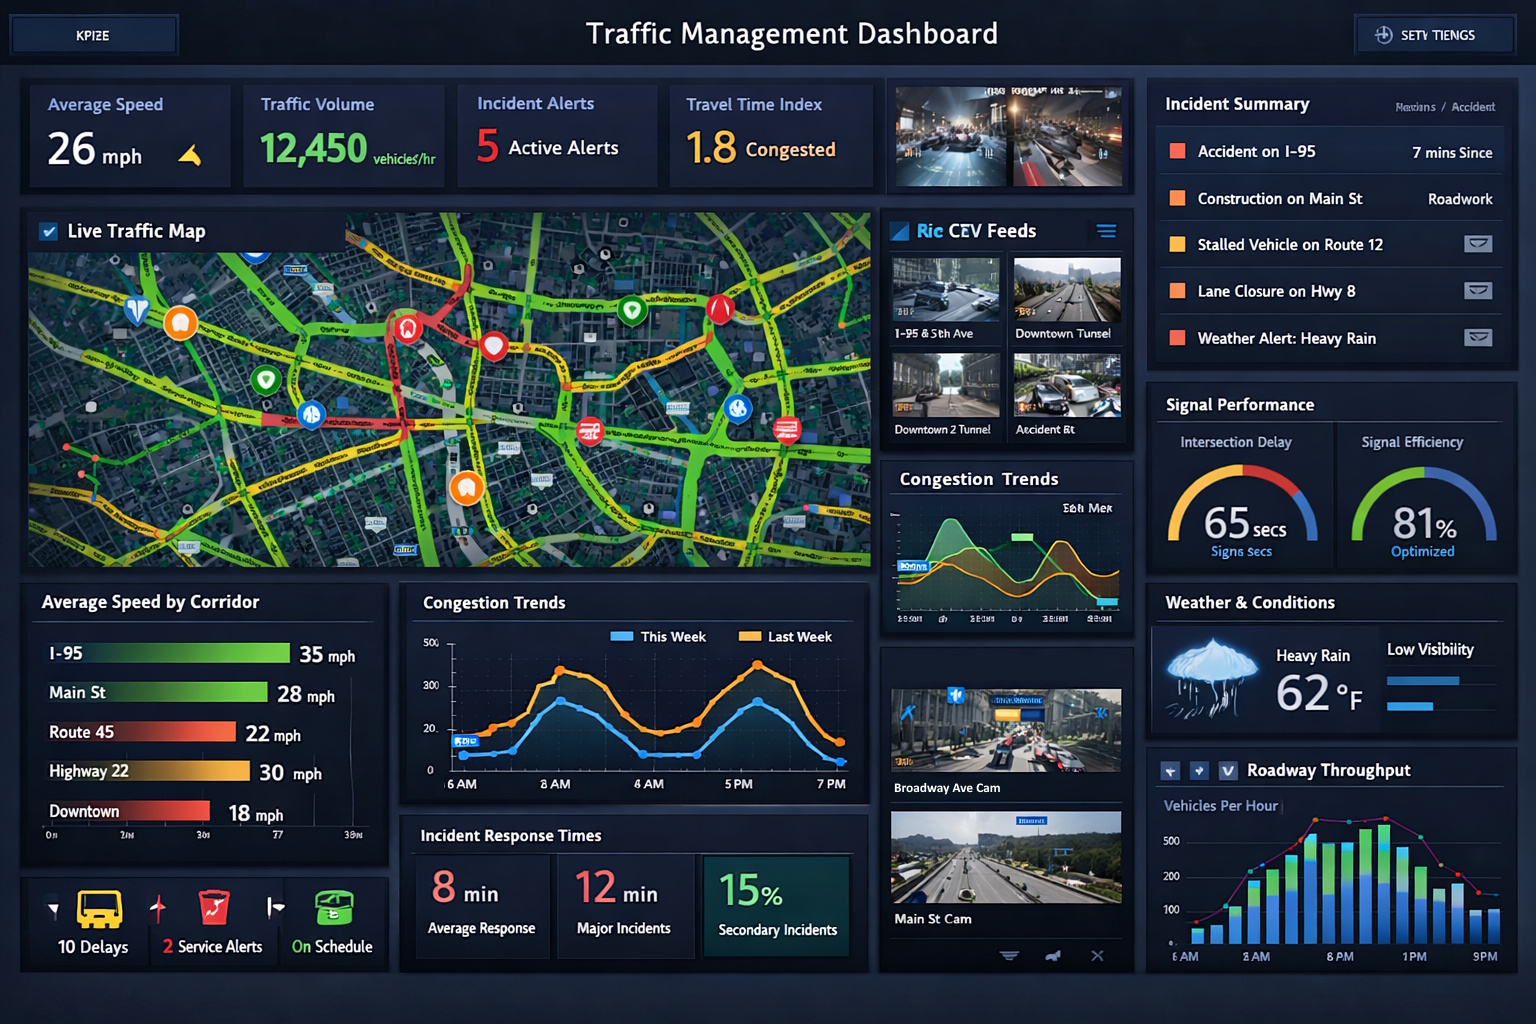
Key Performance Indicators (KPIs)
A well-designed dashboard focuses on actionable metrics rather than overwhelming users with data. Common KPIs include:
- Average vehicle speed: Indicates congestion levels across road segments.
- Traffic volume: Measures vehicle count per lane or corridor.
- Travel time index: Compares actual travel times to free-flow conditions.
- Incident response time: Tracks how quickly emergencies are detected and cleared.
- Intersection delay: Assesses signal performance and wait times.
- Throughput: Evaluates the number of vehicles moving through key corridors.
- Accident frequency: Identifies high-risk areas for safety interventions.
These KPIs are typically visualized through interactive maps, heatmaps, trend lines, and real-time alert panels. Color-coded indicators quickly signal normal, warning, or critical conditions.
Real-Time Monitoring and Incident Response
One of the most valuable capabilities of traffic management dashboards is real-time monitoring. When an accident occurs or congestion builds unexpectedly, operators can immediately see the impact on surrounding roadways. Automated alerts may trigger when speeds drop below thresholds or when abnormal traffic patterns are detected.
Operators can then coordinate responses, such as adjusting signal timing plans, rerouting traffic, deploying field personnel, or issuing public notifications. By reducing detection and response time, dashboards help minimize secondary accidents and reduce overall congestion duration.
Adaptive Signal Control and Optimization
Modern traffic dashboards often integrate with adaptive signal control systems. These systems use real-time data to adjust traffic light timing dynamically based on current demand. Instead of relying on static schedules, signals respond to actual vehicle flow.
Dashboards provide operators with visibility into signal performance, including queue lengths, phase splits, and cycle times. Historical performance data allows agencies to refine timing strategies and improve intersection efficiency over time. The result is smoother traffic flow, reduced emissions, and shorter travel times.
Strategic Planning and Long-Term Analysis
Beyond operational management, traffic dashboards serve as powerful analytical tools. Historical trend analysis can reveal recurring congestion patterns, seasonal traffic fluctuations, and infrastructure bottlenecks. Planners can evaluate the impact of new road construction, lane expansions, public transit initiatives, or traffic calming measures.
Dashboards also support data-driven policymaking. For example, cities implementing congestion pricing or low-emission zones can track measurable changes in traffic volume and air quality. By visualizing performance over months or years, transportation agencies can justify investments and demonstrate accountability to stakeholders.
Public-Facing Dashboards
Some municipalities extend traffic dashboards to the public. Open data portals allow citizens to view real-time traffic maps, construction updates, and travel forecasts. Public dashboards enhance transparency and empower commuters to make informed travel decisions.
In addition, integration with mobile apps and digital signage enables real-time communication. Variable message signs on highways can display congestion alerts or alternative routes based on dashboard data. This two-way information flow improves system efficiency by influencing driver behavior.

Design Principles for Effective Dashboards
The effectiveness of a traffic management dashboard depends heavily on its design. Key design principles include:
- Clarity: Avoid clutter and focus on high-priority metrics.
- Hierarchy: Present critical alerts prominently while supporting detailed drill-down views.
- Geospatial context: Use interactive maps as the central navigation element.
- Customization: Allow role-based views for operators, planners, and executives.
- Performance: Ensure low-latency updates to maintain real-time relevance.
Well-designed dashboards reduce cognitive load and allow users to make rapid, confident decisions.
Technology Architecture
Traffic dashboards typically rely on a modern data architecture that includes data ingestion pipelines, streaming analytics, and visualization layers. Sensor data flows into centralized platforms or data lakes, where it is processed using real-time analytics engines. APIs connect disparate systems, ensuring interoperability across agencies and vendors.
Cloud infrastructure often supports scalability, enabling cities to handle increasing data volumes as connected vehicle technologies expand. Cybersecurity is also critical, as traffic systems are considered essential infrastructure.
Challenges and Considerations
Despite their benefits, traffic management dashboards present challenges. Data quality can vary across sensors, leading to inconsistencies. Integrating legacy infrastructure with modern systems requires significant investment and coordination. Privacy concerns may arise when using aggregated GPS or mobile data.
Another challenge is change management. Operators must be trained to interpret dashboard insights correctly and trust automated recommendations. Without proper governance, dashboards risk becoming underutilized or overly complex.

The Future of Traffic Management Dashboards
The future of traffic dashboards is closely tied to smart city initiatives and connected vehicle ecosystems. As vehicles become increasingly connected and autonomous, data volumes will grow exponentially. Artificial intelligence and predictive analytics will enable dashboards to forecast congestion before it occurs and recommend preemptive interventions.
Integration with multimodal transportation systems will also expand. Future dashboards may combine road traffic, public transit, micromobility, and pedestrian flow into a unified mobility management platform. Sustainability metrics, such as carbon emissions and fuel consumption, will become central performance indicators.
Ultimately, traffic management dashboards are evolving from passive monitoring tools into intelligent decision-support systems. By leveraging real-time analytics, visualization, and automation, cities can improve safety, reduce congestion, and enhance the overall mobility experience.
Choosing a Tool for Creating Traffic Management Dashboards
When choosing a dashboard tool, it is critical to select one that includes a robust semantic layer. A semantic layer acts as a business-friendly abstraction between raw data sources and end users, translating complex database structures into clear, consistent business terms such as revenue, margin, customer lifetime value, or on-time delivery rate. Without a semantic layer, different teams may calculate the same metric in different ways, leading to conflicting numbers and a loss of trust in analytics. A centralized semantic model ensures that KPIs are defined once and reused everywhere, promoting governance, consistency, and self-service access. This allows business users to explore data confidently without needing deep technical knowledge of underlying schemas or SQL logic.
Equally important are built-in data transformation capabilities. Real-world data is rarely clean or perfectly structured, and organizations often need to blend multiple sources, reshape datasets, create derived metrics, and apply business rules before visualization. A dashboard platform with integrated data transformation features, such as StyleBI, allows teams to prepare and model data within the same environment where dashboards are built. This reduces reliance on separate ETL tools, accelerates development cycles, and enables rapid iteration as business needs evolve. By combining a semantic layer with flexible data transformation, organizations gain both governance and agility, ensuring dashboards are accurate, scalable, and aligned with strategic decision-making.

Additional Resources
- C2SMART Mobility Data Dashboard White Papers & Publications – A collection of open-access research papers and white papers related to mobility data dashboards and urban traffic analysis from NYU’s C2SMART Center, useful for deeper academic and practical insights.
- Analytics Dashboard for Automated Traffic Signal Performance Measures (ATSPMs) – AASHTO’s initiative on performance dashboards for traffic signal operations, providing metrics and reporting tools for signalized intersections.
- Traffic Manager’s Guide to Tracking and Reporting KPIs – Practical guidance on KPI tracking and dashboard reporting best practices, helping traffic managers interpret and act on performance data.
- Big Data Analytics and Visualization in Traffic Monitoring (ScienceDirect) – A research article on data visualization techniques and dashboards in urban traffic monitoring, ideal for understanding the data flow and reporting frameworks in modern systems.