HTML5 BI Dashboard Software
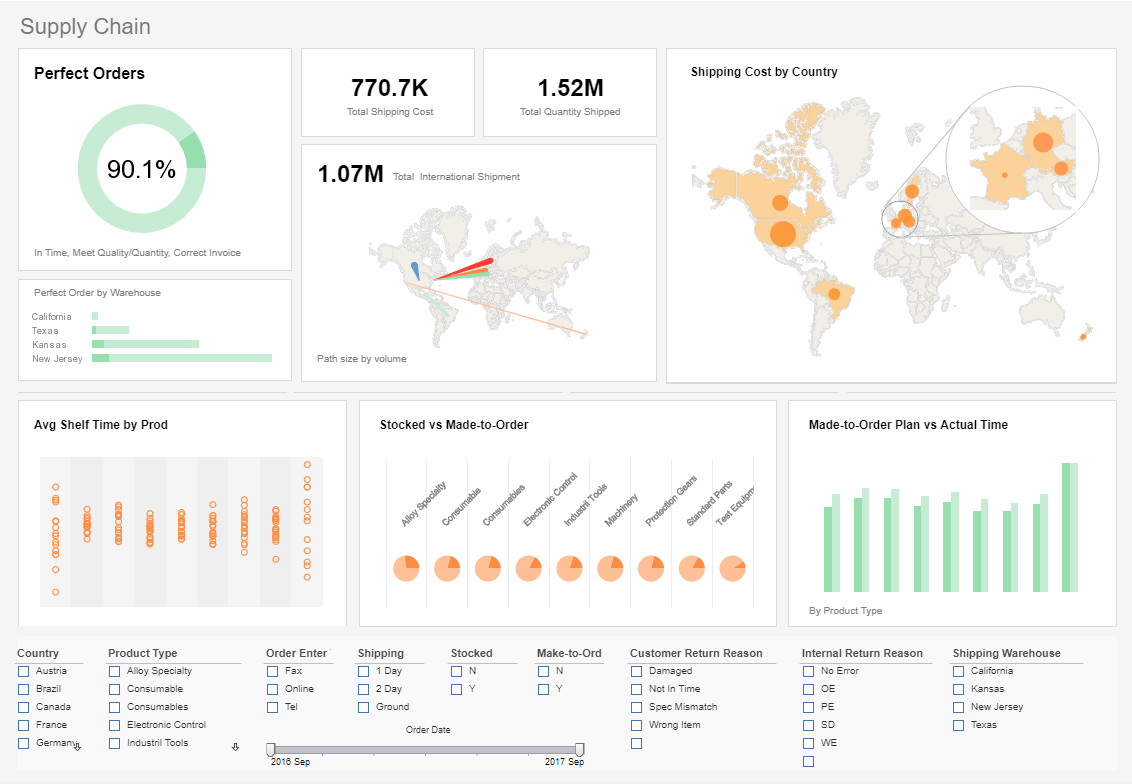
HTML5 is the replacement for Flash for interactive web-based applications. InetSoft offers an HTML5-based BI solution that is ideal for both desktop and mobile usage powered by a server-based application that can be hosted anywhere: on premises, in a private or public cloud, or by InetSoft at AWS.


Register for more information and a personalized demo
About InetSoft
Since 1996 InetSoft has been delivering easy, agile, and robust business intelligence software that makes it possible for organizations and solution providers of all sizes to deploy or embed full-featured business intelligence solutions. Application highlights include visually-compelling and interactive dashboards that ensure greater end-user adoption plus pixel-perfect report generation, scheduling, and bursting. InetSoft's patent pending Data Block™ technology enables productive reuse of queries and a unique capability for end-user defined data mashup.
This capability combined with efficient information access enabled by InetSoft's visual analysis technologies allows maximum self-service that benefits the average business user, the IT administrator, and the developer. InetSoft was rated #1 in Butler Analytics Business Analytics Yearbook, and InetSoft's BI solutions have been deployed at over 5,000 organizations worldwide, including 25% of Fortune 500 companies, spanning all types of industries.

What Would the Developer of Out of Specification Software Put on an HTML5 Dashboard?
The dashboard for Out of Specification (OOS) Software serves as a central interface for users to monitor, analyze, and manage instances where products or processes deviate from predefined specifications or quality standards. It provides real-time visibility into OOS incidents, their status, root causes, and resolution progress. Here are several key components and metrics that the developer might include on the dashboard:
- OOS Incident Overview:
- A summary of total OOS incidents logged within a specified time period.
- Breakdown of incidents by product, process, or testing method.
- Incident Severity and Impact:
- Categorization of OOS incidents by severity level (e.g., critical, major, minor).
- Analysis of the potential impact of OOS incidents on product quality, compliance, and customer satisfaction.
- Root Cause Analysis:
- Breakdown of OOS incidents by root cause (e.g., equipment malfunction, human error, raw material variability).
- Trends in root causes to identify recurring issues and areas for improvement.
- Investigation and Resolution Progress:
- Status of investigations and corrective actions associated with OOS incidents.
- Timeline or Gantt chart showing the progress of investigation, analysis, and resolution activities.
- Responsibility Assignment:
- Allocation of OOS incidents to responsible individuals or departments.
- Performance metrics tracking response times and completion rates for assigned tasks.
- Compliance and Regulatory Reporting:
- Adherence to regulatory requirements, quality standards, and internal protocols.
- Alerts for OOS incidents that pose compliance risks or require escalation.
- Trend Analysis and Benchmarking:
- Comparative analysis of OOS incidents across different products, batches, or production lines.
- Benchmarking against industry standards or historical data to assess performance and identify improvement opportunities.
- Documentation and Audit Trail:
- Access to detailed incident reports, investigation findings, and documentation of corrective actions taken.
- Audit trail functionality to track changes, approvals, and revisions throughout the investigation process.
- User Engagement and Collaboration:
- Collaboration tools for cross-functional teams to collaborate on investigation activities, share findings, and communicate progress.
- Feedback mechanisms for users to provide comments, suggestions, or lessons learned from OOS incidents.
- Customization and Personalization:
- Customizable dashboards, reports, and filters to tailor the interface to specific user roles, preferences, or organizational needs.
- Role-based access control to ensure data confidentiality and security.
More Resources and Articles about InetSoft's HTML5 Dashboarding Tool
Best Performance Dashboard Example - A performance dashboard is to a business what a windshield is to a driver: How would we know where we are, where we are going, and how to get there without one? At InetSoft, we understand that a good performance dashboard is the GPS for a healthy enterprise...
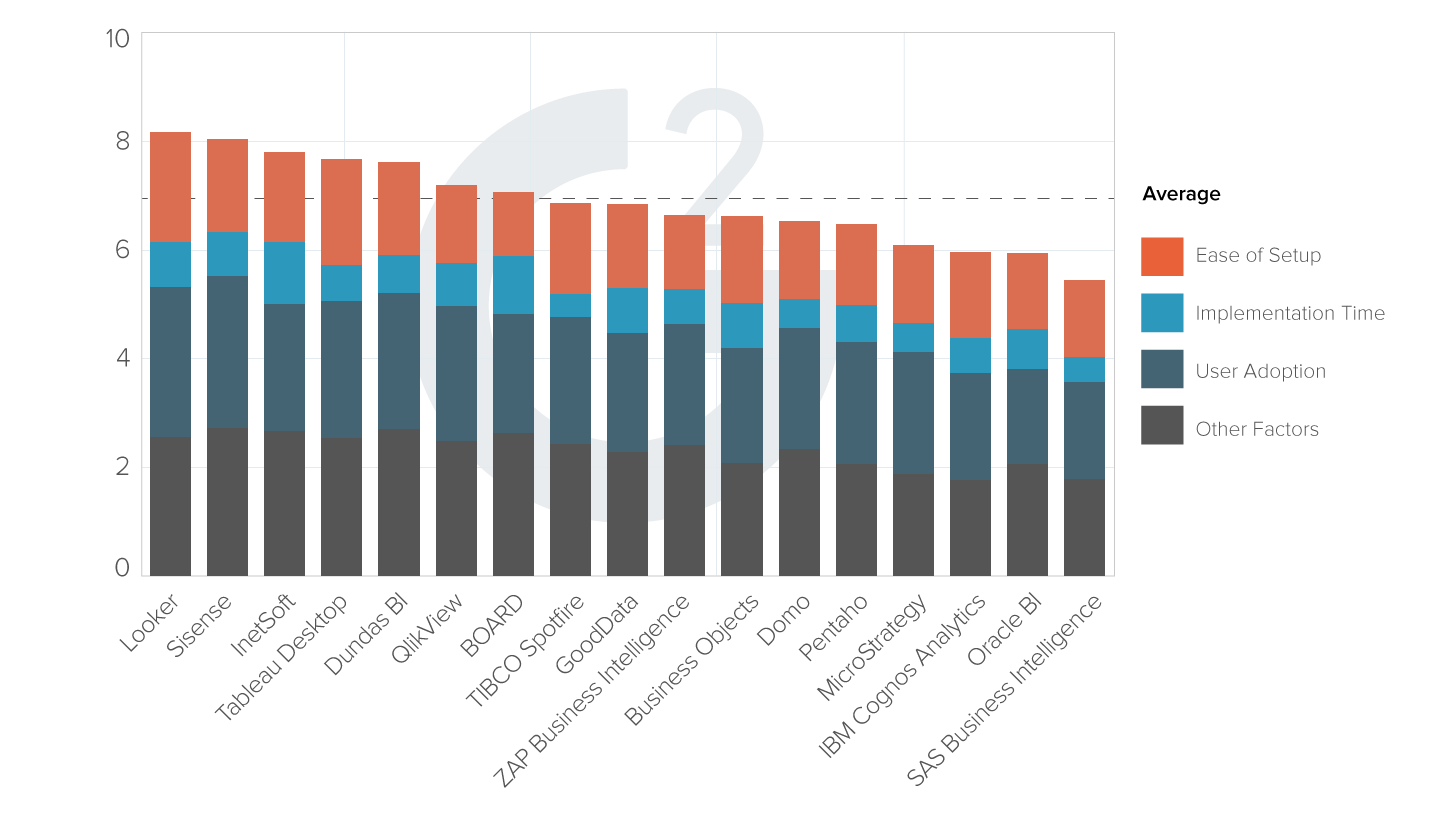
| #1 Ranking: Read how InetSoft was rated #1 for user adoption in G2's user survey-based index | Read More |
Content Collaboration Dashboard Tool for Box - Looking for a good solution for Box reporting? InetSoft's pioneering BI application produces great-looking dashboards that mashup content collaboration data with other enterprise data in your organization. View a demo and try interactive examples...
Data Dashboard Design Ideas - Searching for the best dashboard designs? InetSoft provides many examples to learn from, demonstrating consistency across chart elements and pleasing color palettes...
How-To: Creating a Dashboard - The Visual Composer is a web-based tool for creating Data Worksheets, Viewsheets, and other assets. You will use the Visual Composer to link graphical components of a Viewsheet to the data assets constructed within a Worksheet. For example, you will link a Range Slider to a date field, or link a gauge to the aggregate of a numeric column...
InetSoft's Solution for Procurement Dashboards - When trying to monitor key performance measures for procurement, such as the percentage of non-contract purchases to total purchases, you need the right BI tools to properly value your future acquisitions. A robust BI solution is one that can analyze and collate massive amounts of data, providing actionable insights for a competitive price. And in order for your organization to get the full benefit from your data, all departments need to be able to access and explore data relationships, enabling better business decision-making...
 |
Read the top 10 reasons for selecting InetSoft as your BI partner. |
Learn About Analytical and Operations Dashboards - There are two main varieties of dashboards: analytical dashboards and operational dashboards. Analytics dashboards are just that, analytical. They are created for the sole purpose of gaining knowledge and insight from data. Users of these dashboards seek insight into the past and the future, wondering what happened and what's to come...
Real Time Business Activity Monitoring - InetSoft's visualization dashboards can be easily made to auto-refresh with real-time data. This BAM call center status dashboard updates in real time so managers can see how the overall calling queue compares to its set threshold. Moreover, each agent's call progress can be seen at a glance. Where attention may be needed, a big red face will indicate this to the manager...
Social Media Dashboard Software for Buffer - Social media reporting software is crucial for analyzing the results of your various organic channels. Buffer is a software application designed to manage accounts in social networks, scheduling posts as well as analyzing their results...
Talking About Different Performance Management Software Packages - There are over 100 different performance tracking software packages. So avoid this trap. Just because balanced scorecard is in the title doesn't mean you are going to have a balanced scorecard, does it? A piece of software is not going to give you a balanced scorecard. Avoid this one, too. Just give it to the planning shop. It's their job. Let them do it. Let them show us what they can build on their own, wrong answer...
Read what InetSoft customers and partners have said about their selection of Style Scope for their solution for dashboard reporting. |
Tracking Business Intelligence Metrics - Searching for a way to track business intelligence metrics? InetSoft offers an easier to use, easier to deploy BI platform that is also more cost-effective. Read about using InetSoft's BI software...
Tracking Key Finance Metrics - Researching finance dashboards for tracking key metrics? Since 1996 InetSoft has been making dashboard software that is easy to deploy and easy to use. Its unique data mashup capabilities enable unified views of corporate performance and maximum self-service...
Using Data Mashups in the Enterprise - Learning about data mashup applications? InetSoft is a pioneer in data mashups, and its BI software makes mashups from disparate data sources possible with a drag and drop mashup tool. Read articles below for more information, or view the enterprise data mashup solutions page...
Various Departmental Business Intelligence Examples - Looking for departmental business intelligence examples? InetSoft's industry pioneering BI platform can support any department's dashboard needs. Interact with examples in the library, read articles about its capabilities below, and request a personalized demo...


