InetSoft's Campaign Dashboard Reporting Software
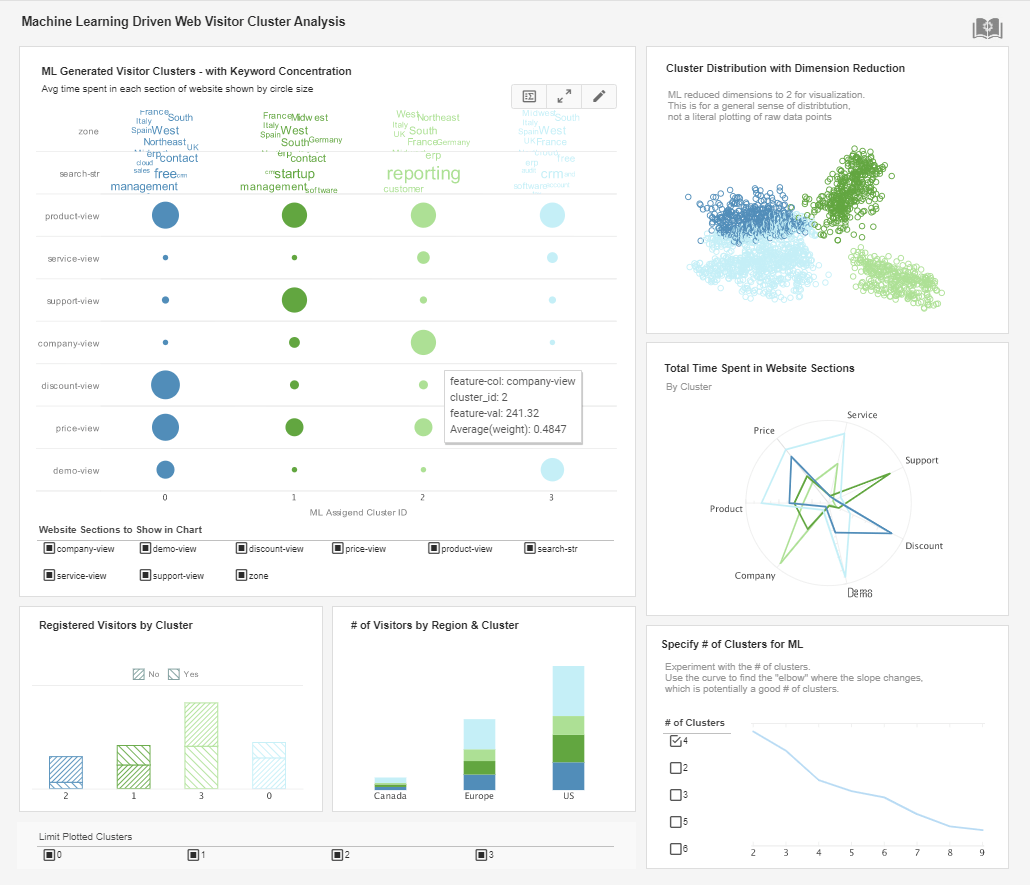
InetSoft’s unique dashboard software, StyleBI, allows users to easily create Web-based dashboards that are operational and effective in creating analytical reports.
The interactive features of InetSoft's design allow you to shift from a high-level view of marketing performance to an in-depth view of detailed metrics and statistical analytics.
StyleBI's interface makes the dashboarding tool easy to deploy and easy to utilize, reaching the maximum level of self-service and efficient business.
| #1 Ranking: Read how InetSoft was rated #1 for user adoption in G2's user survey-based index | Read More |

Track Leads and Analyze Marketing Campaigns
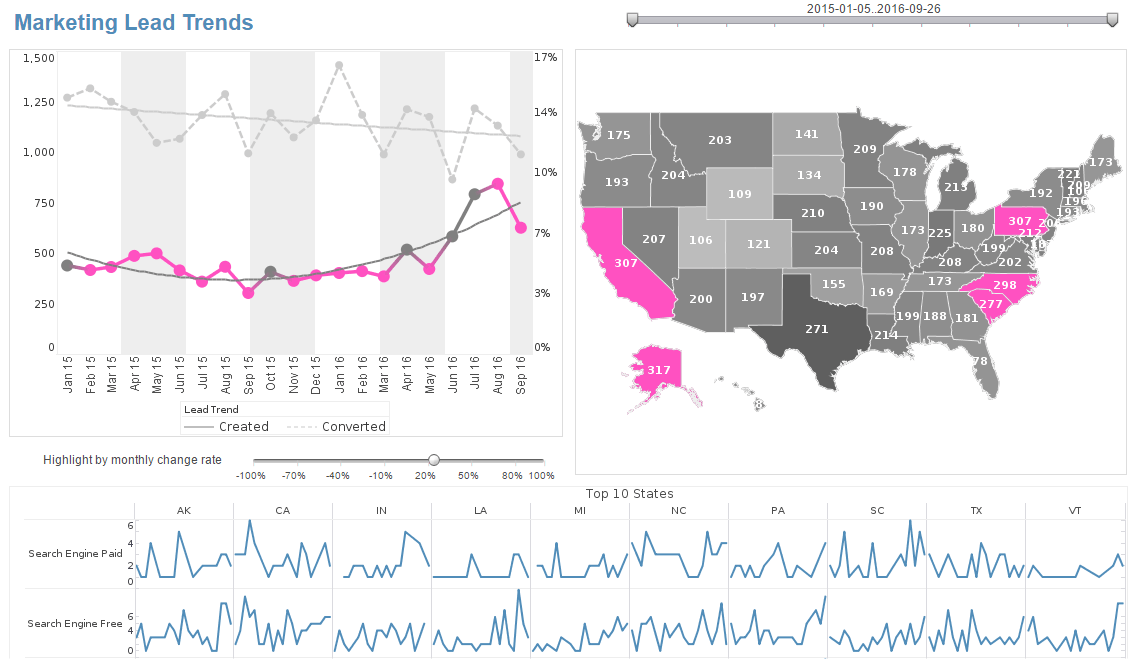
InetSoft’s StyleBI is an operational business intelligence platform that features a powerful data mashup engine for the creation of dashboards, visual analyses, and reporting. Marketing dashboards enable managers to analyze campaign performance such as cost vs. budget, and revenue impact. With the flexible features offered by StyleBI, users are able to filter out different aspects of a report based on the type of lead and sales stage of the opportunities created.
Conveniently, InetSoft's tool allows reports to be seen from any mobile device with a browser, including the iPhone and iPad. As an innovator in the BI space, InetSoft's mission is to provide users with the most beneficial and efficient methods of reaching their goals.
 |
View the gallery of examples of dashboards and visualizations. |
What Are Different Types of Campaigns That Could Be Tracked?
-
Digital Marketing Campaigns:
- Paid Advertising Campaigns: These encompass PPC (Pay-Per-Click) campaigns on platforms like Google Ads, social media advertising on platforms like Facebook or Instagram, display ads, and sponsored content.
- Email Marketing Campaigns: Tracking metrics like open rates, click-through rates (CTR), conversion rates, and unsubscribe rates helps gauge the effectiveness of email campaigns.
- Content Marketing Campaigns: This involves tracking engagement metrics for blog posts, videos, infographics, etc. Metrics include page views, time on page, social shares, and conversion rates.
- Search Engine Optimization (SEO) Campaigns: Monitoring keyword rankings, organic traffic, bounce rates, and backlink acquisition helps measure the success of SEO efforts.
In the digital age, tracking these campaigns is essential for optimizing marketing budgets and ensuring resources are allocated to the most effective channels.
-
Social Media Campaigns:
- Awareness Campaigns: These focus on increasing brand visibility and reach. Metrics to track include impressions, reach, and engagement (likes, comments, shares).
- Lead Generation Campaigns: Measuring click-through rates to landing pages, form submissions, and conversion rates are critical for evaluating the success of lead generation efforts.
Social media campaigns play a vital role in brand building and customer engagement. Tracking these campaigns helps refine content and targeting strategies.
-
Content Promotion Campaigns:
- Influencer Marketing Campaigns: Tracking metrics such as engagement rate, reach, and conversions attributed to influencer posts provides insights into the impact of influencer collaborations.
Influencer marketing can be highly effective in reaching niche audiences. It's important to track to ensure a return on investment.
-
Product Launch Campaigns:
- Pre-Launch Teasers: Monitoring engagement on teasers, sign-ups for early access, and social shares helps gauge interest and anticipation.
- Post-Launch Sales: Tracking conversion rates, revenue, and customer feedback provides insights into the product's market reception.
Product launches are critical moments for a business. Tracking these campaigns is fundamental for understanding market acceptance and identifying areas for improvement.
-
Event Promotion Campaigns:
- Registrations and Attendance: Tracking the number of registrations, attendance rates, and post-event feedback provides valuable insights into the event's success.
Events are powerful tools for networking and brand exposure. Proper tracking allows for the refinement of event strategies for future success.
-
Advocacy and Loyalty Campaigns:
- Referral Programs: Tracking the number of referrals, conversion rates, and rewards distribution helps measure the effectiveness of advocacy programs.
Advocacy campaigns can significantly impact customer retention and acquisition. It's important to track to understand the ROI.
 |
Read the top 10 reasons for selecting InetSoft as your BI partner. |
About InetSoft
InetSoft is a pioneer inInetSoft is a pioneer in delivering easy, agile, and robust business intelligence software that makes it possible for organizations and solution providers of all sizes to deploy or embed full-featured business intelligence solutions. Application highlights include visually-compelling and interactive dashboards that ensure greater end-user adoption plus pixel-perfect report generation, scheduling, and bursting.
InetSoft's patent pending Data Block technology enables productive reuse of queries and a unique capability for end-user defined data mashup. This capability combined with efficient information access enabled by InetSoft's visual analysis technologies allows maximum self-service that benefits the average business user, the IT administrator, and the developer. InetSoft solutions have been deployed at over 5,000 organizations worldwide, including 25% of Fortune 500 companies, spanning all types of industries.
 |
View a 2-minute demonstration of InetSoft's easy, agile, and robust BI software. |
More Articles About Campaign Reporting
Bed Management Dashboards - A bed management dashboard typically displays real-time information about bed availability, occupancy, and patient flow within a hospital or healthcare facility. Some of the key metrics that may be included in a bed management dashboard are: Bed availability: The number of available beds in each department or unit of the hospital, including the total number of beds and the number of occupied and unoccupied beds...
Cloud-Flexible Solution for Marketing Dashboards - Do you need the flexibility to run your marketing dashboards in a cloud environment that is closer to your data source? Many competitive options force you to host your dashboards in their own cloud infrastructure which can lead to delays and higher costs in querying your marketing database(s)...
Evaluate InetSoft's Campaign Monitor Reporting Tool - Are you looking for a good solution for Campaign Monitor dashboard reporting? InetSoft's pioneering BI application produces great-looking cloud-based dashboards with an easy-to-use drag-and-drop designer. Mash up your email campaign data with other enterprise sources for a unified view of marketing performance. View a demo and try interactive examples...
Example of a Facebook Ads Manager Visual Analysis - This example above illustrates the analysis of Facebook Ads performance. With Facebook's built-in reporting interface you can filter on all of the PPC metrics, but you can only sort on one at a time, which quickly frustrates you when you are trying to simultaneously maximize or minimize two of them, such as conversion rate and click through rate...
Key Performance Indicators Display Examples - Below are key performance indicators examples displayed in dashboards designed using InetSoft's drag and drop dashboard solution, some of which can be tested with the free downloadable evaluation copy of Style Intelligence, while others can be seen in the free visualization tool, Visualize Free...
Measure Customer Satisfaction - Even at that level, it's very important to be measuring customer satisfaction, their experience, the upsell opportunities, how to retain those customers once won, and how well are you doing growing those customers' business. And of course, when you lose business is it important for you to measure your recapture capabilities and to diagnose why you lost them...
Media Coverage Analysis - Dashboards for coverage analysis are essential for determining how well a company's tactics are connecting with the target market. They provide a thorough review of key performance indicators (KPIs) that assess the success of advertising campaigns, marketing initiatives, and communication plans...
 |
View live interactive examples in InetSoft's dashboard and visualization gallery. |
Pretty Basic Dashboard - Here's a pretty basic dashboard, pretty straightforward about sales by customer location. It's also got sales by product category, and sales by customer segment. You can see that it has further capability for me to filter. In fact I got this one live where I can show you, I can actually scroll right through different quarters and see activity. I can fix certain categories. I can choose furniture, for example, if I really want to focus on furniture and see what's happening in terms of sales and profitability...
Using a Highlight to Track Percent Change in Lead Volume - Tracking the percent change in lead count helps businesses measure their growth over time. By comparing the current lead count to the previous period, businesses can determine if they are growing or if they need to adjust their marketing strategies to attract more leads. Tracking the percent change in lead count helps businesses identify trends in their lead generation efforts. For example, if lead count...
What Metrics to Put in a Marketing Dashboard - So, broadly a marketing dashboard should contain all the necessary features for a successful campaign. Some of these features are: A conversion funnel for each campaign in order to track how many visitors convert into customers Data visualization tools that allow you to see trends and patterns in your data Key performance indicators (KPIs) such as conversion rates, cost per acquisition, average customer lifetime value. For example, bounce rates will tell...
 |
Read how InetSoft was rated as a top BI vendor in G2 Crowd's user survey-based index. |
Why Is Data Mashup Interesting? - Some of the reasons people find data mashup interesting is for when they want to make sure to include all these different data sources that are out there now. It really comes from the imperative to have that unified view of corporate performance in an executive monitoring dashboard or balanced scorecard. There are different ways people want to be able to see data and performance in many different functions...

