Dashboard Table Filtering Operators
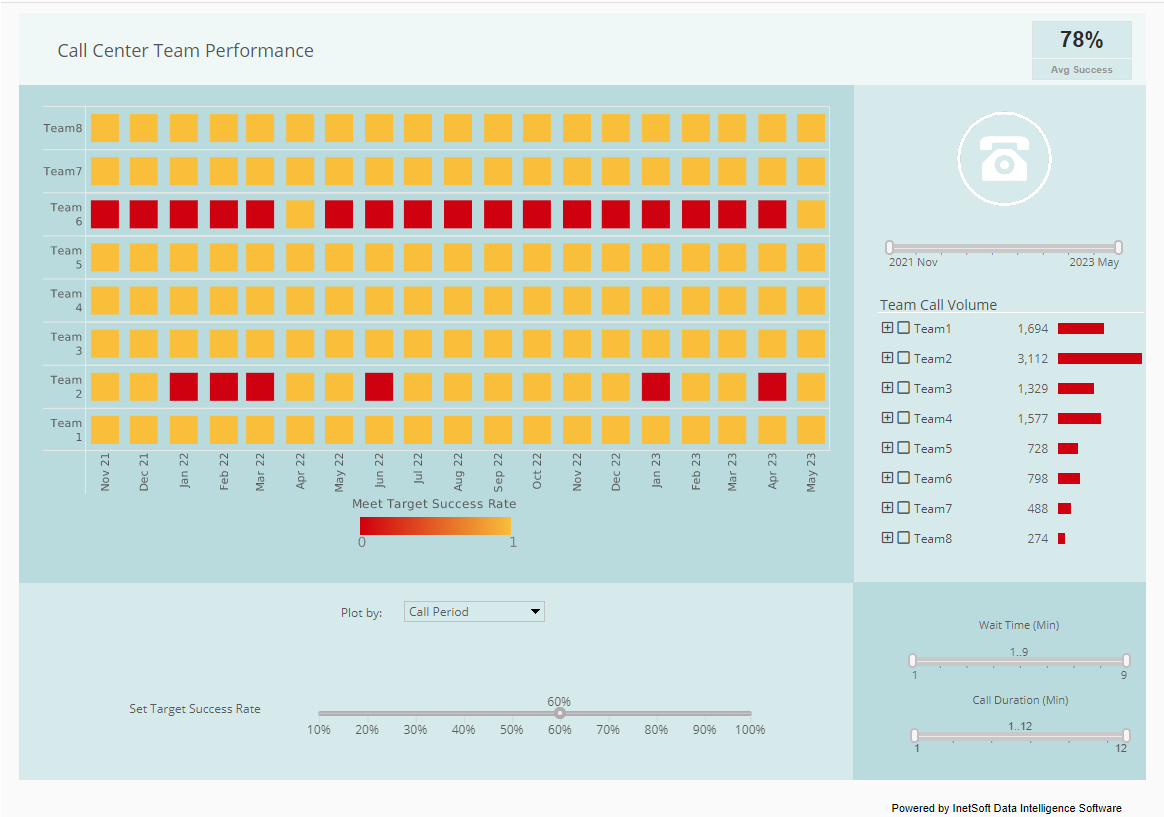
Using InetSoft's cloud-flexible dashboard software, developers can sort and filter complex dashboard data in custom ways and create compelling visual reports. View the example below to learn more about the Style Intelligence solution.
You can filter the data in a table by applying conditions to any of the table columns. For example, you may want to display only products that have a 'product price' greater than $100, or that have an 'order date' within the past year.
When you specify conditions, the table will only display the data records that satisfy those
conditions.
Simple conditions are conditions defined on the pre-aggregate data, that is, before any grouping or
summarization. Simple conditions are always joined together using the 'AND' operator. To gain greater
flexibility, you can use advanced conditions.
Note: Filtering conditions are only applied to data that is retrieved from the database. The amount of data (number of rows) retrieved is determined by the 'Max Rows' setting and the global 'Design mode sample data size' setting.
| #1 Ranking: Read how InetSoft was rated #1 for user adoption in G2's user survey-based index | Read More |
To define a simple condition, follow these steps:
1. Click the 'Condition' button on the title bar of a Data Table. This opens the 'Condition' dialog box.
2. Click the 'More' button to specify a new condition.
3. Use the menus in the 'Edit' pane to define the condition.
4. Click 'OK' to save the condition and close the dialog box. Click 'Modify' to update the condition without closing the dialog box.
5. To delete a condition, select the condition in the list and click the 'Fewer' button. If the condition you specify references data model attributes that do not already exist in the table, these attributes are automatically added to the table as invisible columns.
More Articles About Dashboards
Analytics of Credit Card Approvals -
The credit card issuing industry is expected to experience a strong rise in revenue as macroeconomic conditions begin to improve as concerns surrounding the spread of COVID-19 dissipate. Understanding who is applying for credit cards and what factors are affecting credit card approvals become increasingly crucial for many financial players in the industry.
To this end, InetSoft has created a dashboard that investigates several factors associated with credit card approvals, including income, debt, age, ethnicity, credit score, marriage status...
Church Database Reporting Tools - A Church Administrator can utilize a database reporting tool in various ways to streamline operations, enhance communication, and make informed decisions. Here's a detailed overview of how a Church Administrator can use a database reporting tool: Membership Management: Member Profiles: The database tool can store detailed information about church members, including names, contact details, family connections, and participation in various church activities...
Evaluate InetSoft's Dashboard Software - Looking to evaluate a dashboard solution? InetSoft offers Web-based dashboard reporting software that enterprises can deploy quickly, and ISV's can embed easily into their own applications. Free eval download. View a demo. Read additional resources below.
Enterprise Asset Management Solution Provider Offers InetSoft's Analytics and Dashboard Software, a leading provider of Enterprise Maintenance Management software and industry best practices consulting...
 |
View the gallery of examples of dashboards and visualizations. |
Examples of Monitoring and Management Dashboards - This page contains monitoring and management dashboard examples from industry pioneer InetSoft's dashboard showcase. InetSoft is top-rated by users on G2 Crowd. Read reviews and register for a personalized demo. What are monitoring dashboards? A monitoring dashboard contains various charts...
Example of a Retail Superstore Dashboard - In this dashboard, we focus on the operational data from a superstore that has many branches all over the United States. Superstore is a small retail business. They produce Technology products, Furniture, and office supplies. Their customers are mass consumers like corporations and home offices. The data set consists of sales detail, customer detail, and store detail, it contains over 9000 rows of data. This dashboard can help the business with decision-making and answering some of the following questions...
How to: Advanced Dashboard Filtering - Users can unite complex and disparate data formats into one cohesive report by performing advanced dashboard data filtering. View the example below to learn more about adding filters to dashboards with the Style Intelligence solution. To specify conditions on both pre-aggregate and post-aggregate data, as well as group rankings, use the 'Advanced Conditions' dialog box. Advanced conditions can additionally be joined using both 'AND' and 'OR' operations...
Setting Dashboard Data Parameters - Dashboard software allows users to set specific dashboard data parameters that will filter or set complex dynamic data sets autonomously. View the example below to learn more about the Style Intelligence solution. You can use a variable or parameter as the test value in a filter condition. The user of the Worksheet (including users of linked Viewsheets and reports) will be prompted at runtime to enter the value of the parameter...
Strong KPI Dashboard Best Practices - The first step is to understand why dashboard reporting is useful. Choosing the appropriate KPIs to make your dashboard effective is the next step. Although this may differ depending on the department and the general objectives of your business or customer, there are certain universal trends. Quality is preferred than quantity for dashboard reporting that is effective. You only have one screen to use as a canvas when using a dashboard. Anyone looking at the screen...
| Previous: Sorting Dashboard Data Columns |

