How to Create a Cluster Analysis Dashboard
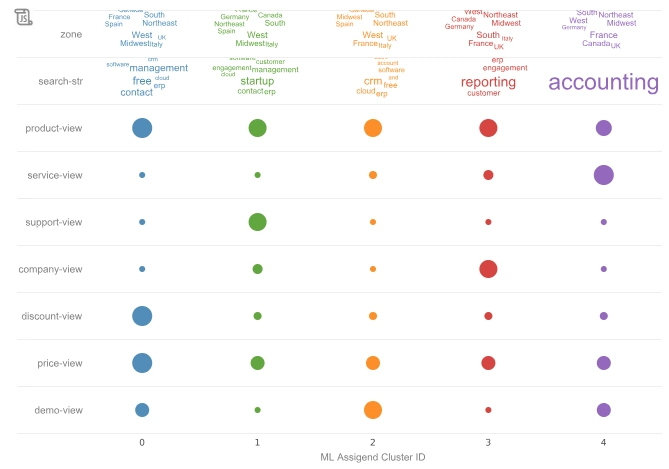
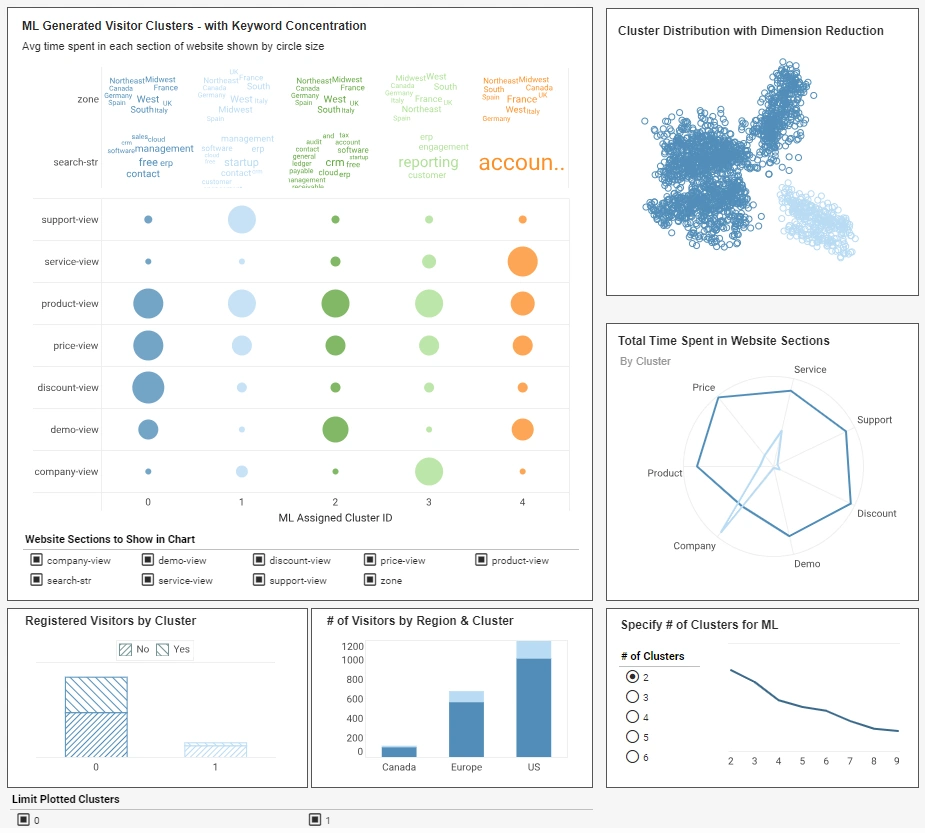
This document will explain how to create a cluster analysis dashboard such as the one below using dashboard creation software from InetSoft. A working version of this dashboard can be found on the InetSoft Gallery. This dashboard is composed primarily of simple charts that display cluster data that has been produced by machine learning techniques. (Note that this document does not cover the use of machine learning software, but focuses on the creation of the dashboard from processed data.)
Contents
What is a Cluster Analysis Dashboard?
Add a Word Cloud Chart
Add a Point Chart
Add a Website Section Filter
Add Labeling
Add Group Backgrounds
Add a Scatter Plot
Add a Radar Chart
Add Bar Charts
Add a Line Chart
Add Cluster Filters
Summary

What is a Cluster Analysis Dashboard?
A cluster analysis dashboard is a data visualization tool used to analyze and present the results of cluster analysis. Cluster analysis is a statistical technique that groups similar data points or objects into clusters based on their characteristics or similarities. It is commonly used in various fields such as data mining, pattern recognition, customer segmentation, and market research.
A cluster analysis dashboard typically provides an interactive interface that allows users to explore and understand the clustering results visually. It may include various charts, graphs, and summary statistics to present the clusters and their characteristics. Some common components of a cluster analysis dashboard include:
- >Cluster Visualization: The dashboard may display a visual representation of the clusters, such as scatter plots, dendrograms, or heatmaps. These visualizations help users understand the relationships and distances between the clusters.
- >Cluster Statistics: The dashboard may present summary statistics for each cluster, such as the number of data points in each cluster, the centroid or representative data point for each cluster, and the overall quality of the clustering (e.g., the within-cluster sum of squares).
- >Cluster Profiles: The dashboard may provide detailed profiles or summaries for each cluster, including key features or variables that distinguish one cluster from another. This information helps users understand the characteristics and behaviors of each cluster.
- >Interactive Filtering: Users can often interact with the dashboard by selecting specific clusters or data points of interest. This allows them to filter and drill down into specific subsets of the data for further analysis.
- >Additional Visualizations: Depending on the complexity of the data and the goals of the analysis, the dashboard may include additional visualizations, such as histograms, bar charts, or box plots, to explore the distribution and differences of variables within each cluster.
The main purpose of a cluster analysis dashboard is to provide an intuitive and user-friendly interface for users to explore and gain insights from the clustering results. It helps analysts and decision-makers understand the underlying structure in their data and make informed decisions based on the identified clusters.
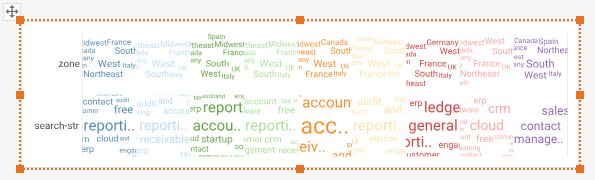
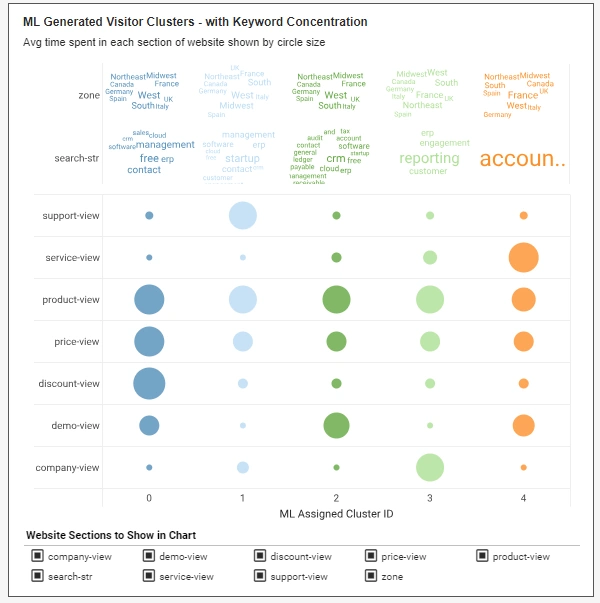
First we will create a chart that shows the time spent by users in different sections of the website, broken out by cluster.
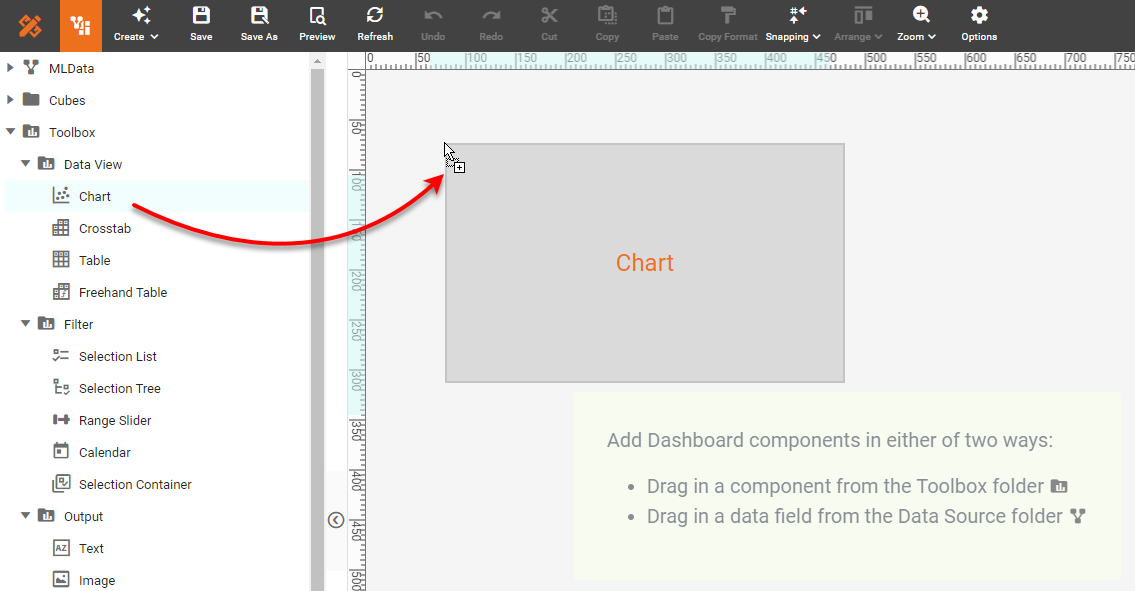
The Gallery example above uses advanced scripting to create this result using a single Chart, but we can achieve the same result without scripting by using two Charts and some filtering. To begin, drag a Chart component from the Visual Composer Toolbox into the dashboard.
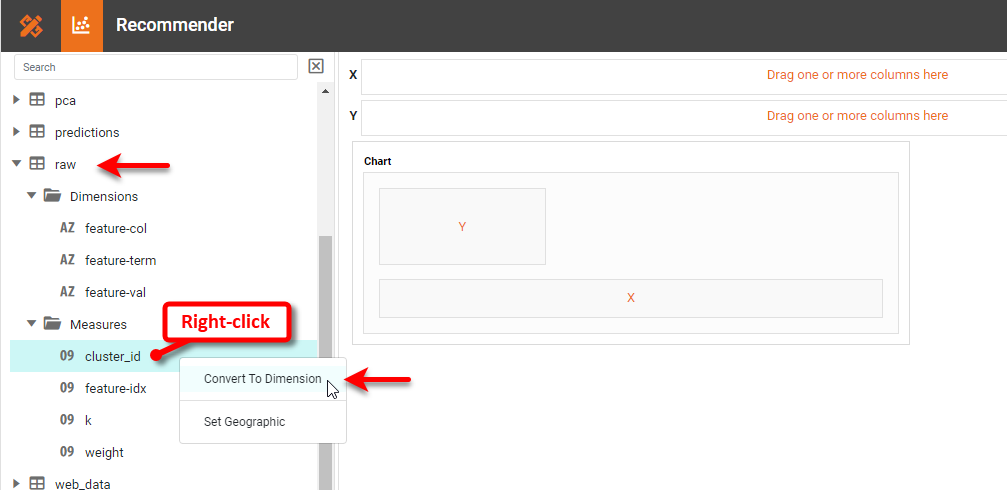
Press the Edit button on the Chart to open the Chart Editor. Expand the 'raw' data block. Right-click the 'cluser_id' field and select Convert to Dimension.
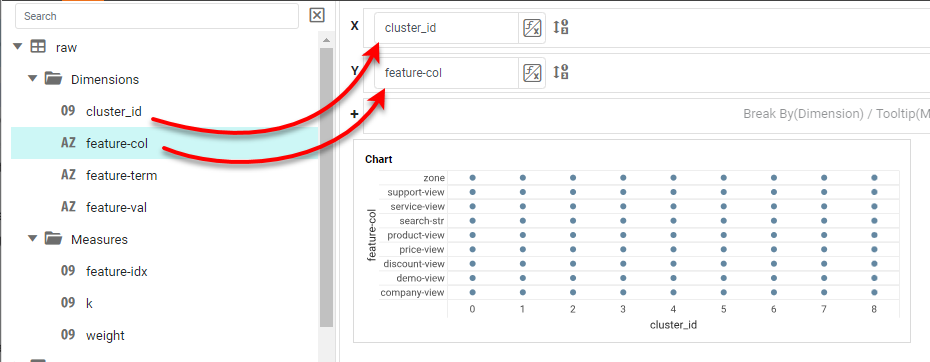
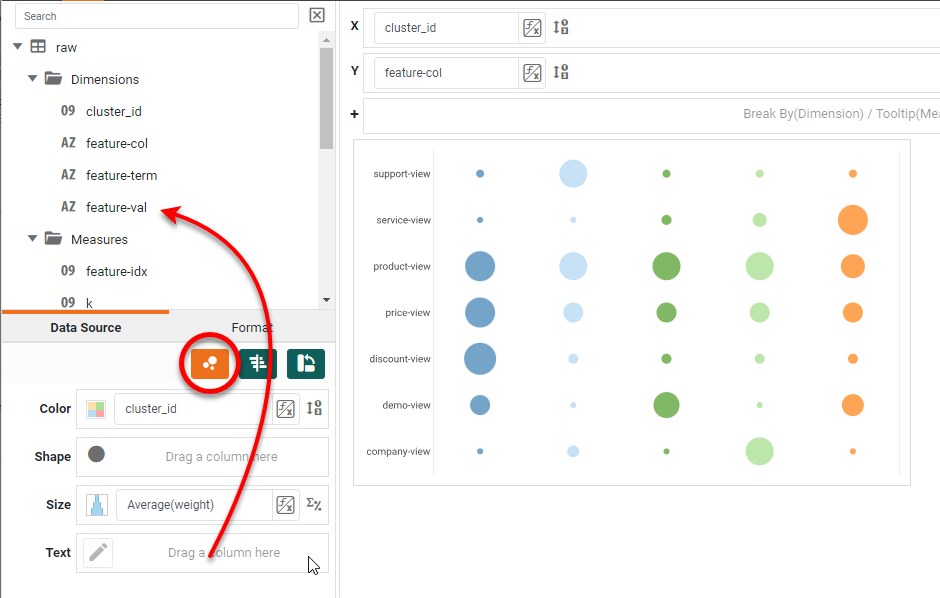
Then drag the 'cluster_id' field from the Dimension folder to the X region. Drag the 'feature-col' field to the Y region.
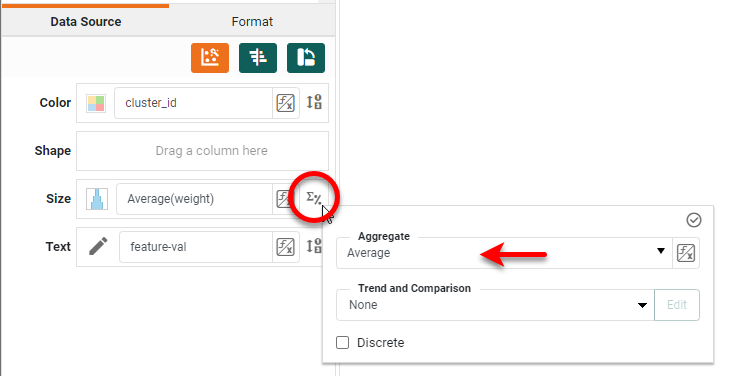
Drag the 'cluster_id' field (again) to the Color region. Drag the 'feature-val' field to the Text region. Drag the 'weight' field to the Size region. Press the Edit Measure button next to the Size region, and set the 'Aggregate' to Average.
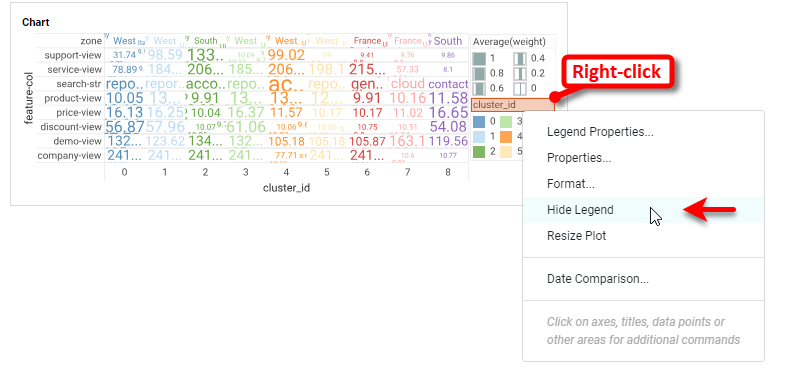
Hide the legends and the axis labeling. To do this, right-click each legend and select Hide Legend. Do the same for each axis title (right-click -> Hide Title), and for the X-axis labels (right-click -> Hide Axis).
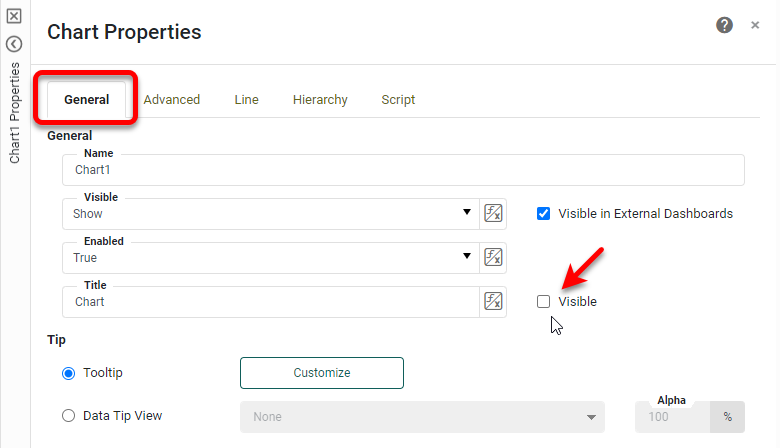
Right-click on the Chart and select Properties. In the 'Chart Properties' dialog box, turn off the Visible option for the 'Title', and press OK.
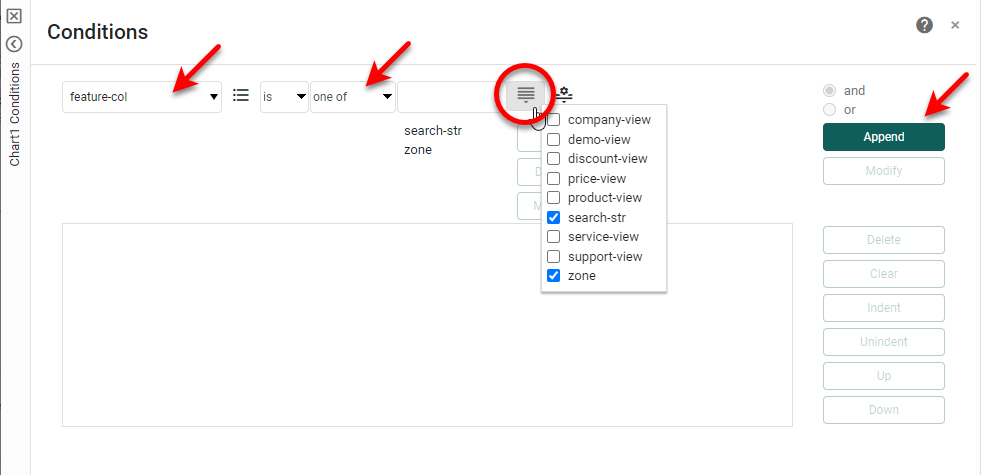
Press Finish to exist the Chart Editor. We now want to limit this Chart to display only the data for 'zone' and 'search-str'. Right-click the Chart and select Conditions.
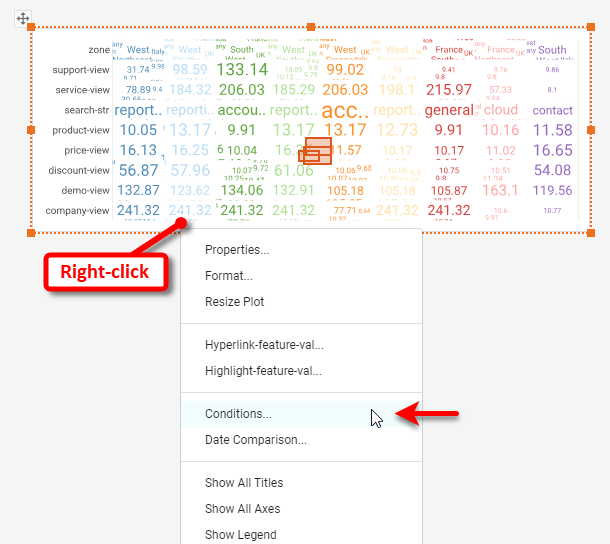
From the first menu select 'feature-col', from the third menu select one of, and then press the Browse Data button and select 'zone' and 'search-str'. Press Append and then OK.
Reduce the height of the Chart as desired.
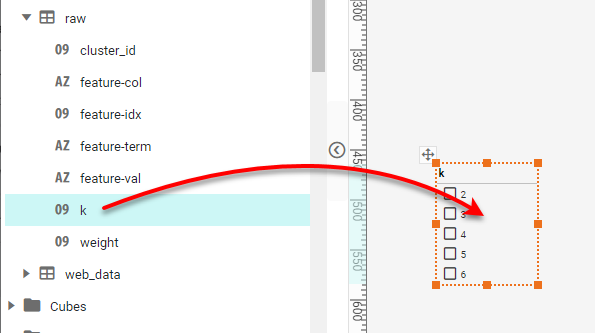
Now, add a filter to reduce the number of clusters displayed. Drag a Selection List component from the Toolbox into the dashboard. From the 'raw' data block, drag the 'k' field into the Selection List.
Right-click the Selection List and select Properties. Under the General tab, enable Single Selection and set the 'Visible' property to Hide. This Selection List will not be seen by users at this time.

Press OK, and then choose "5" as the number of clusters.

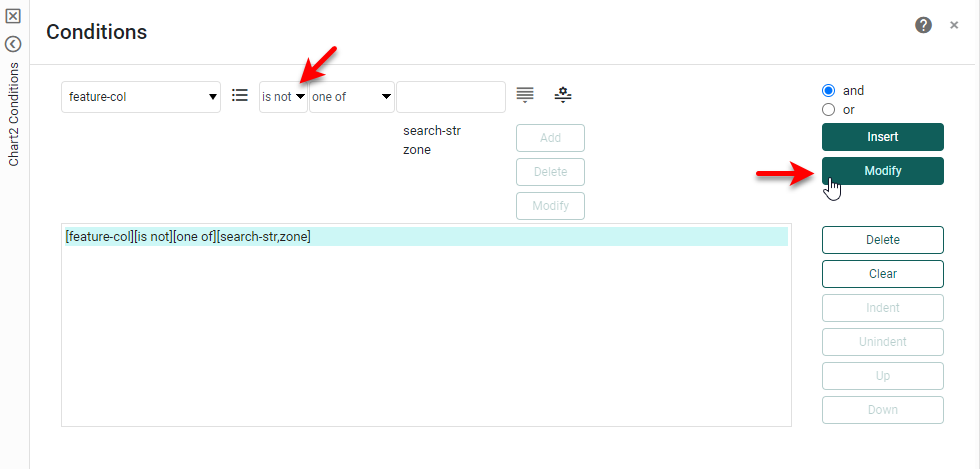
Let's now add the bottom part of the Chart, showing the time spent on different sections of the website. Copy and paste the Chart below itself. (You can use the right-click menus to do this, or simply Ctrl-drag on the Chart.) Right-click on the Chart again, and select Conditions. Change is in the condition to is not. Press Modify and then OK.
Open the Chart Editor for the second Chart. Drag the 'feature-val' field out of the Text region and back to the data source. Press the Select Chart Style button and choose Point.
Right-click the Chart and select Show All Axes and also Show All Titles. Then right-click the Y-axis title, and select Hide Title. Right-click the X-axis title and select Title Properties. Change the 'Title' to "ML Assigned Cluster ID". Then exit the Chart Editor.
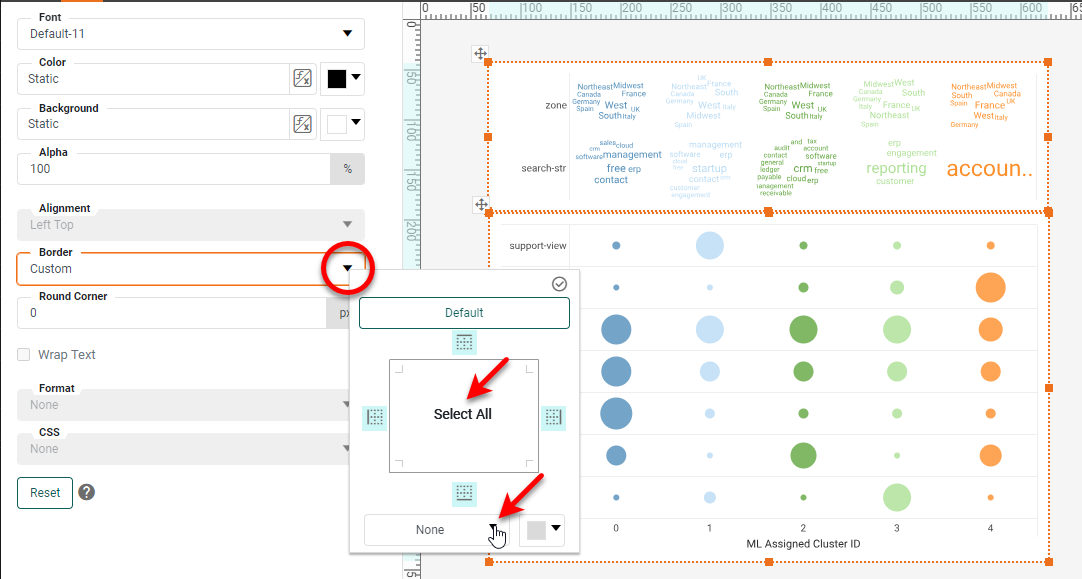
Select both Charts, and use the Format panel to set the borders of both to None. Make any other desired formatting choices, such as label fonts and colors.
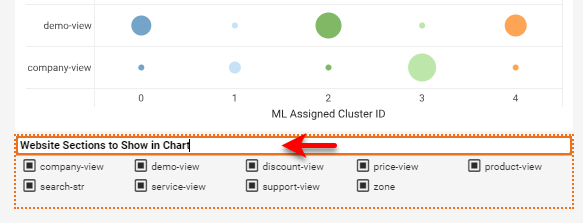
To allow the user to narrow down the data on the Chart, drag the 'feature-col' field below the Chart to create a Selection List. Resize the Selection List to the width of the Chart and to display two rows. Double-click the title bar, and enter the text "Website Sections to Show in Chart".
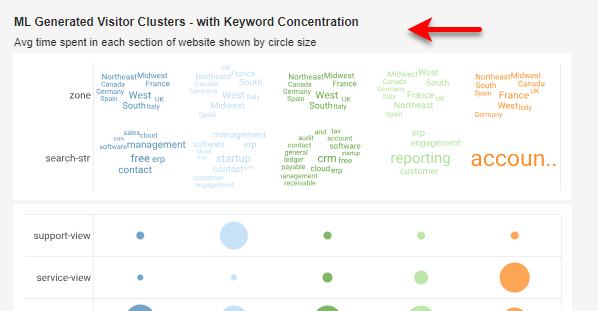
Add labeling above the Chart by dragging in two Text components, and changing the Text to match the image below:
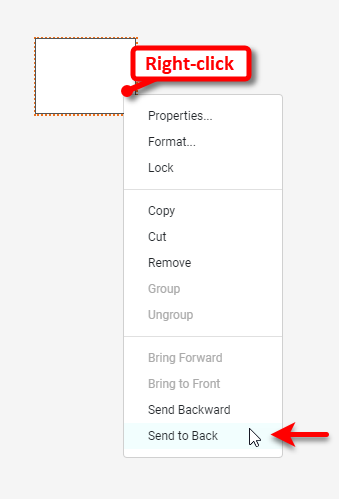
To lend cohesion to the Charts and the Selection List, add a white Rectangle as a background. To do this, drag a Rectangle component from the Toolbox into the dashboard. Right-click the Rectangle and select Send to Back.
Then resize the Rectangle to provide a background for all the components that you have created so far. Adjust any formatting and layout as desired.
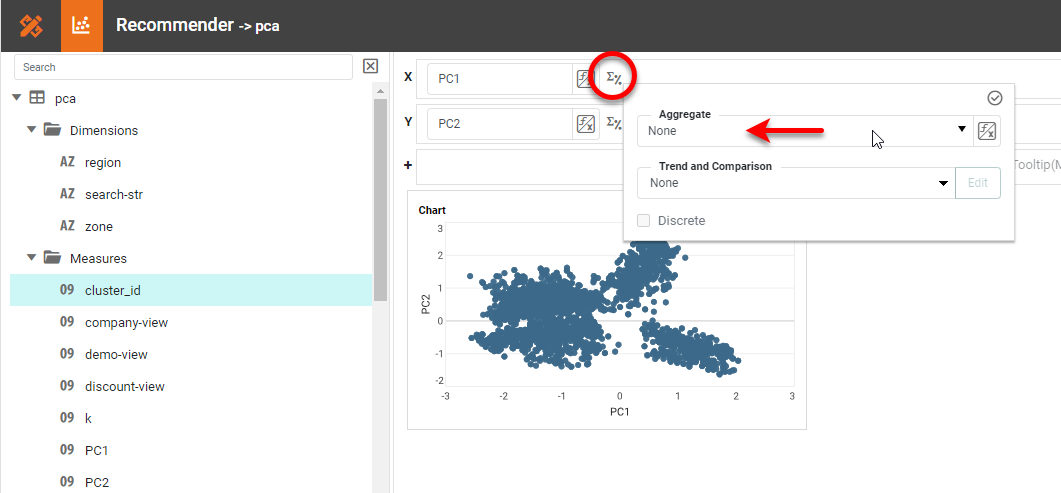
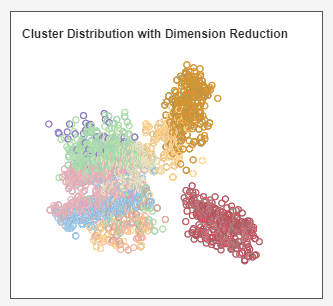
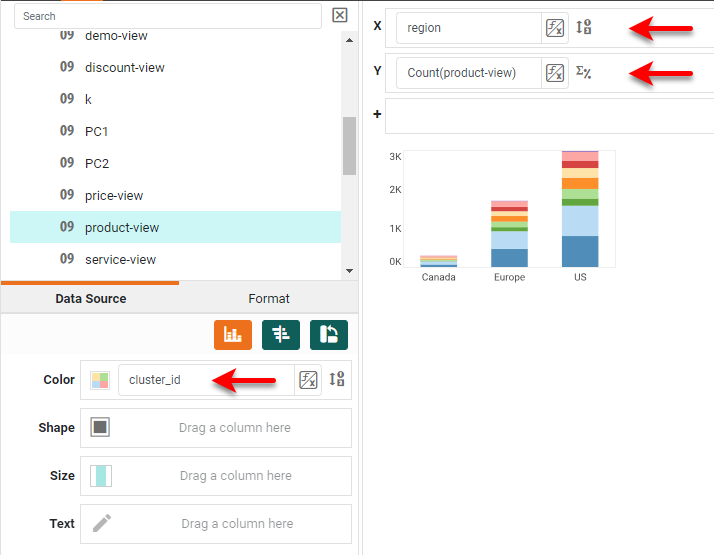
Next you will add a Chart that displays the different clusters determined by machine learning. Drag a Chart from the Toolbox into the dashboard, and open the Chart Editor. From the 'pca' data block, drag the 'PC1' field to the X region, and drag the 'PC2' field to the Y region. Press the Edit Measure button next to each of the fields and set 'Aggregate' to None.
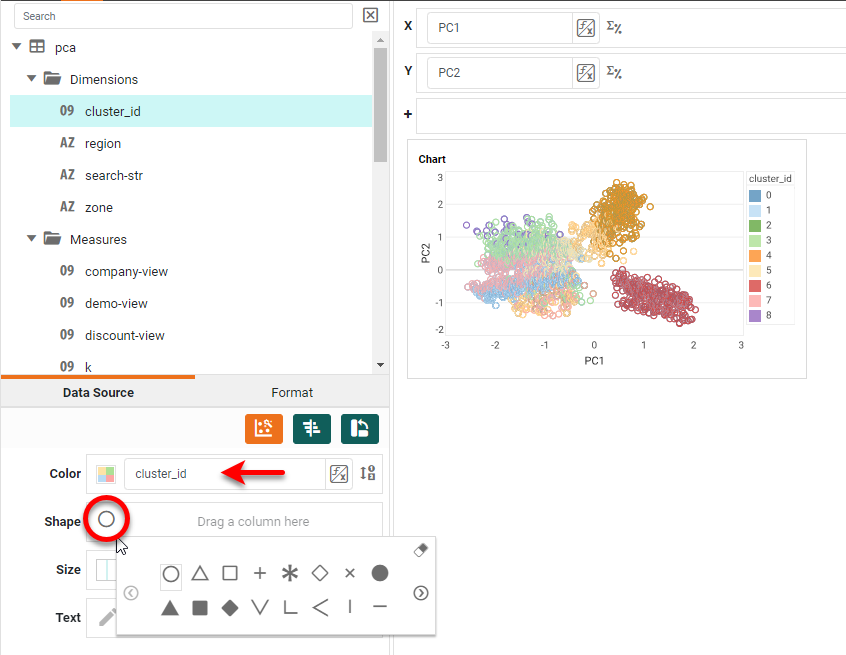
Right-click on the 'cluster_id' field and select Convert to Dimension. Then drag the 'cluster_id' field from the Dimension folder to the Color region. Press the Edit Shape button and change the shape to an unfilled circle.
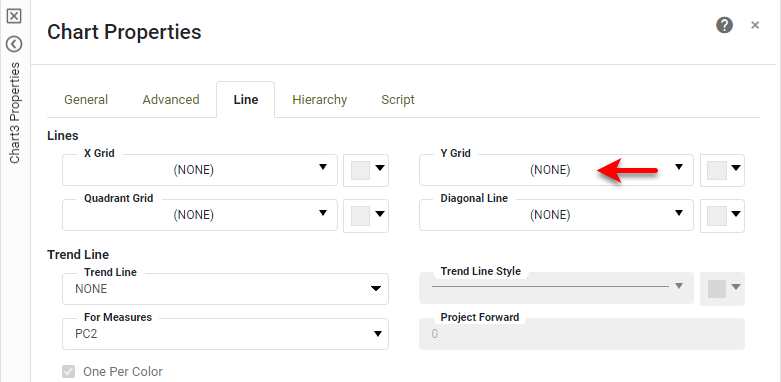
Right-click on each axis and select Hide Axis. Do the same for the axis titles (Hide Title) and legend (Hide Legend). Right-click the Chart and select Properties. Under the General tab, disable the Visible property for 'Title', and under the Line tab set the 'Y Grid' to None.
Press OK, and the exit the Chart Editor. As you did for the other Charts, turn off the Chart borders, add a Rectangle as a background, and add the desired Text above the Chart.
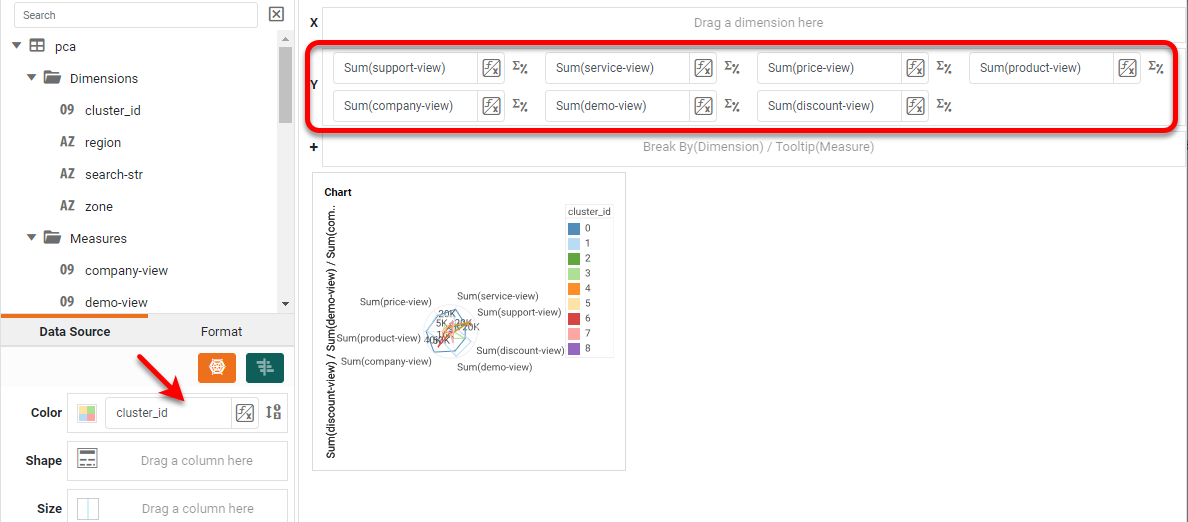
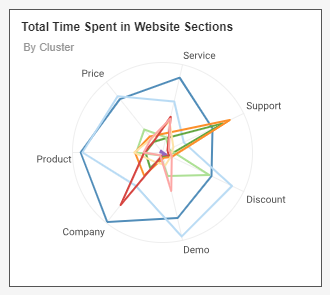
You will now add a Radar Chart to display the time spent in the different website sections. Drag a Chart component into the dashboard, and open the Chart Editor. Press the Select Chart Style button, and choose Radar. Then drag the following fields to the Y region from the 'pca' data block: 'support-view', 'service-view', 'price-view', 'product-view', 'company-view', 'demo-view', and 'discount-view'. Right-click 'cluster-id' as you did earlier and select Convert to Dimension. Then add it to the Color region.
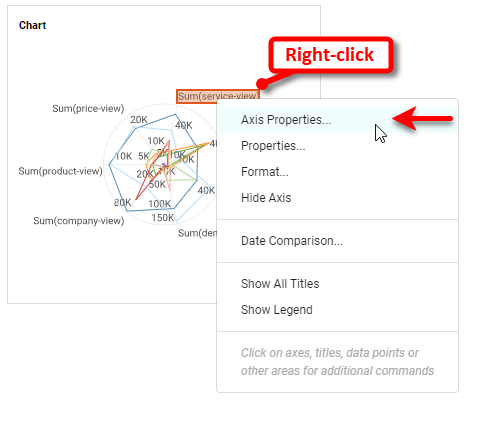
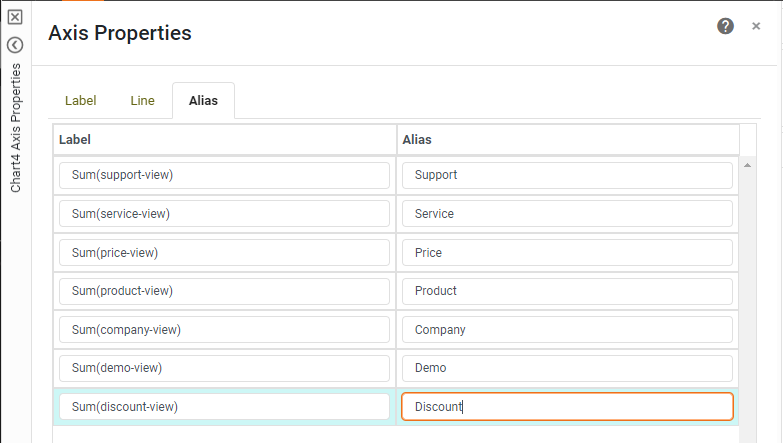
Hide the legend and the axis titles as you did earlier. Right-click on one of the labels, and select Axis Properties.
Under the Line tab, select Show Axis Line. Under the Alias tab, enter the following aliases to remove some clutter, and press OK. Then exit the Chart Editor.
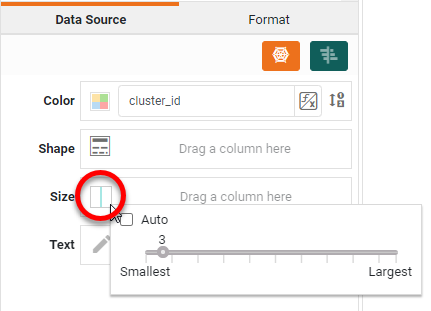
Press the Edit Size button and make the lines thicker.
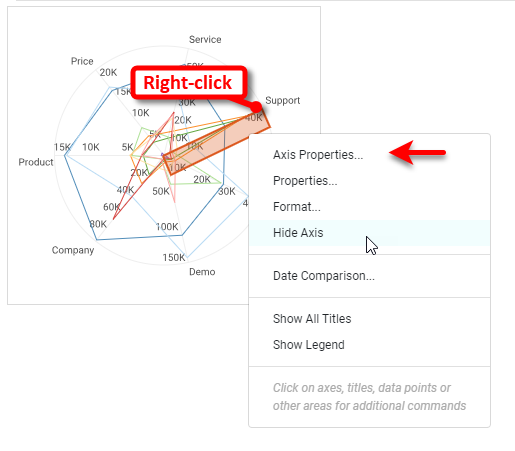
Right-click each spoke axis and select Axis Properties.
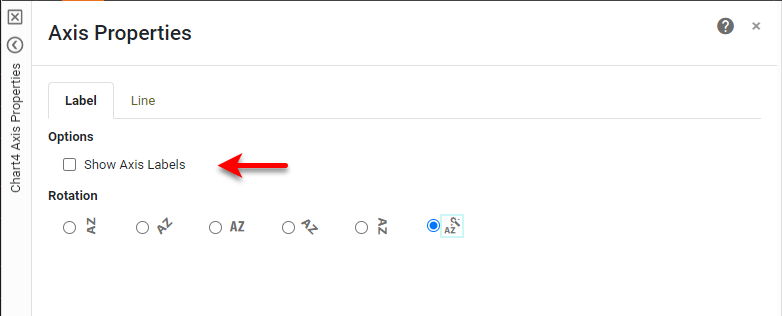
Under the Label tab, uncheck Show Axis Labels.
Right-click the Chart and select Properties. Hide the Chart title as you have done before (uncheck Visible). As you did earlier, hide the Chart borders, use a Rectangle to create a background, and add the text below:
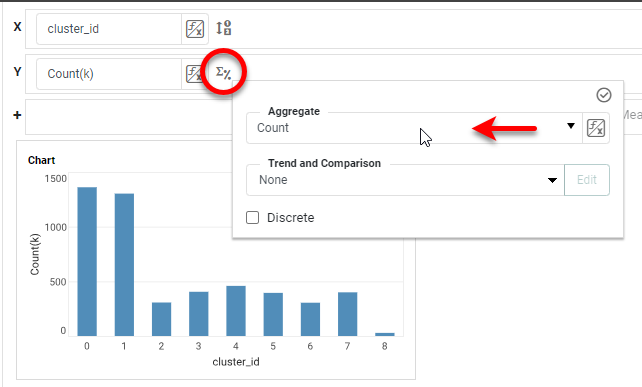
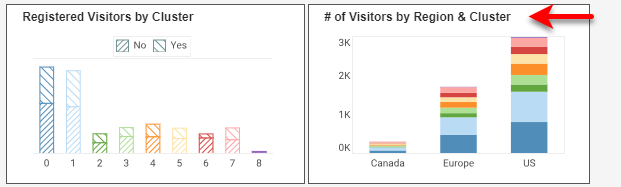
You will now add two Bar Charts. Drag a new Chart to the bottom of the dashboard and open the Chart Editor. In the 'pca' data block, right-click the 'cluster_id' field and select Convert to Dimension. Do the same for the 'registered' field. Drag the 'cluster_id' field from the Dimension folder to the X region. Drag the 'k' field to the Y region. Press the Edit Measure button and change the 'Aggregate' to Count.
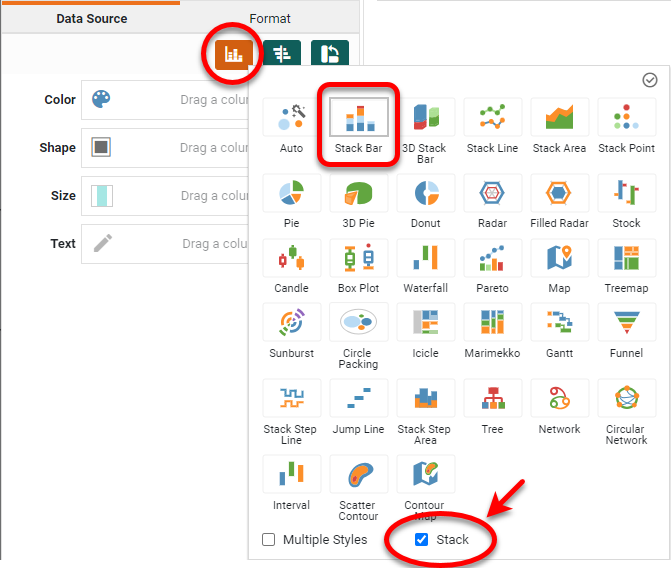
Press the Select Chart Style button and choose Bar. Enable the Stack option at the bottom of the panel, and press Apply.
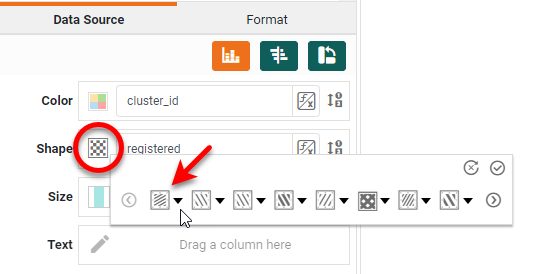
Drag the 'cluster_id' field from the Dimension folder to the Color region. Drag the 'registered' field from the Dimension folder to the Shape region. Press the Edit Shape button, and select the desired patterns.
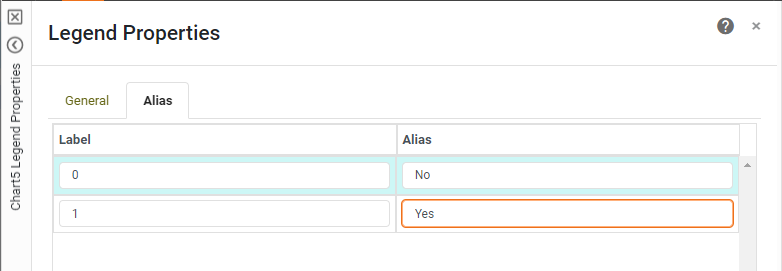
Hide the 'cluster_id' legend and drag the 'registered' legend to the top of the Chart. Hide all the titles and hide the Y-axis as well. Right-click the 'registered' legend, and select Legend Properties. Under the General tab, turn off the Visible option for 'Title', and under the Alias tab, set the label aliases as shown below:
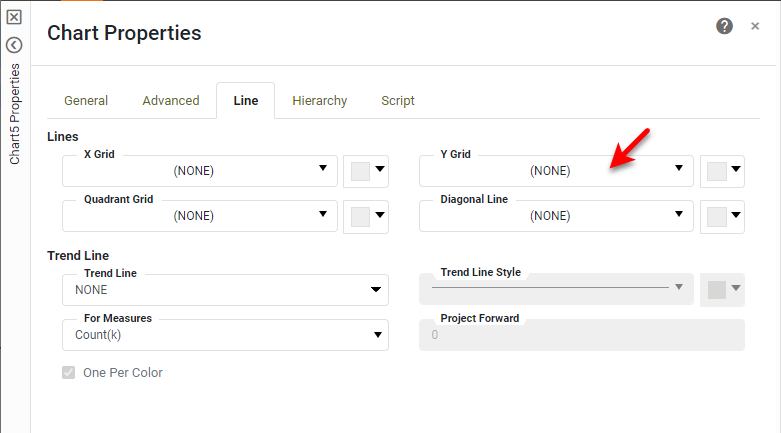
Exit the Chart Editor. Right-click the Chart, and select Properties. Under the General tab, turn off the Visible property for the 'Title', and under the Line tab, set the 'Y Grid' to NONE.
As you did earlier for the other Charts, turn off the Chart borders, and use a Rectangle and Text to create a background and title.
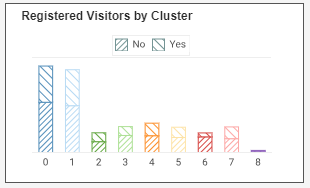
Copy this entire group (Rectangle, Text, Chart) and paste the copy to the right of the original. Open the Chart Editor for the copy and make the adjustments shown below:
Exit the Chart Editor, and change the title as shown below:
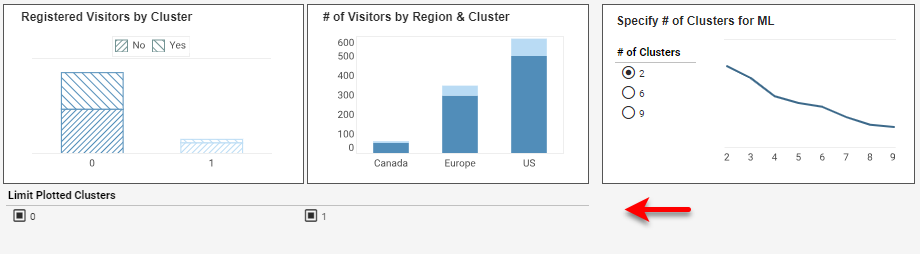
Next we will add a Line Chart to help select the number of clusters to consider. Drag a Chart into the dashboard and open the Chart Editor. Expand the 'metrics' data block, right-click the 'k' field, and select Convert to Dimension. Then configure the Chart binding as shown below, and press the Select Chart Style button to choose a Line type chart.
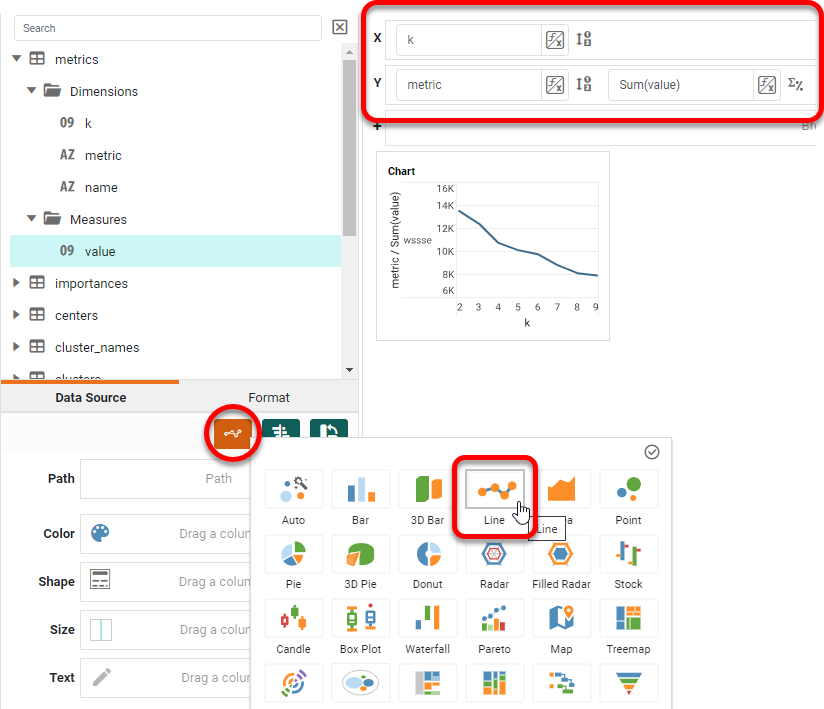
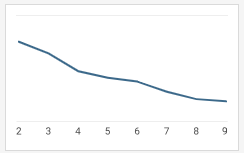
Hide all titles, labels, and axis lines except for the X axis labels.
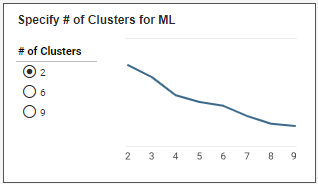
Finally, drag two Selection List components into the dashboard. From the 'pca' data block, drag the 'k' field into one Selection List, and drag the 'cluster_id' field into the other. Right-click the 'k' Selection List, and select Properties. On the General tab, select Single Selection, and press OK. Place the Selection List next to the Line Chart, and add a Rectangle background for both. Add titles as shown below:
Expand the width of the 'cluster_id' Selection List and place it at the bottom of the dashboard as shown below. Change the title to "Limit Plotted Clusters".
The dashboard is now complete.
Summary
This document has illustrated a few of the techniques used to create a dynamic and powerful machine learning clustering Dashboard. You saw how to create a variety of Charts, including Scatter Chart, Radar Chart, Word Cloud Chart, Line Chart, Bar Chart, and Point Chart. You also saw how you can easily add Filters (either single-selection or multi-selection) to the dashboard to facilitate interactivity. It should be clear that InetSoft makes it quick and easy to display charts and KPIs in a wide variety of different modalities for exploration and interaction of clustered data.
InetSoft additionally provides many other features to facilitate the creation of professional dashboards, such as embedding, hyperlinks, drill-downs, positioning and sizing aids, device-adaptive layout, advanced scripting, and much more. InetSoft provides a complete solution for modern, powerful, and effective dashboards.