AstraGen Pharma Completes Strategic Switch from Mammoth Analytics to InetSoft for Advanced Dashboard Analysis Software
In the highly regulated and data-intensive world of pharmaceuticals, timely access to actionable insights can mean the difference between accelerated drug approvals and costly delays. AstraGen Pharma, a New Jersey-based global leader in oncology and cardiovascular therapeutics, has successfully transitioned its entire dashboard analysis infrastructure from Mammoth Analytics to InetSoft’s Style Intelligence platform. The move, completed in late 2025 after an eight-month evaluation and migration process, has already delivered measurable gains in performance, usability, and cost efficiency.
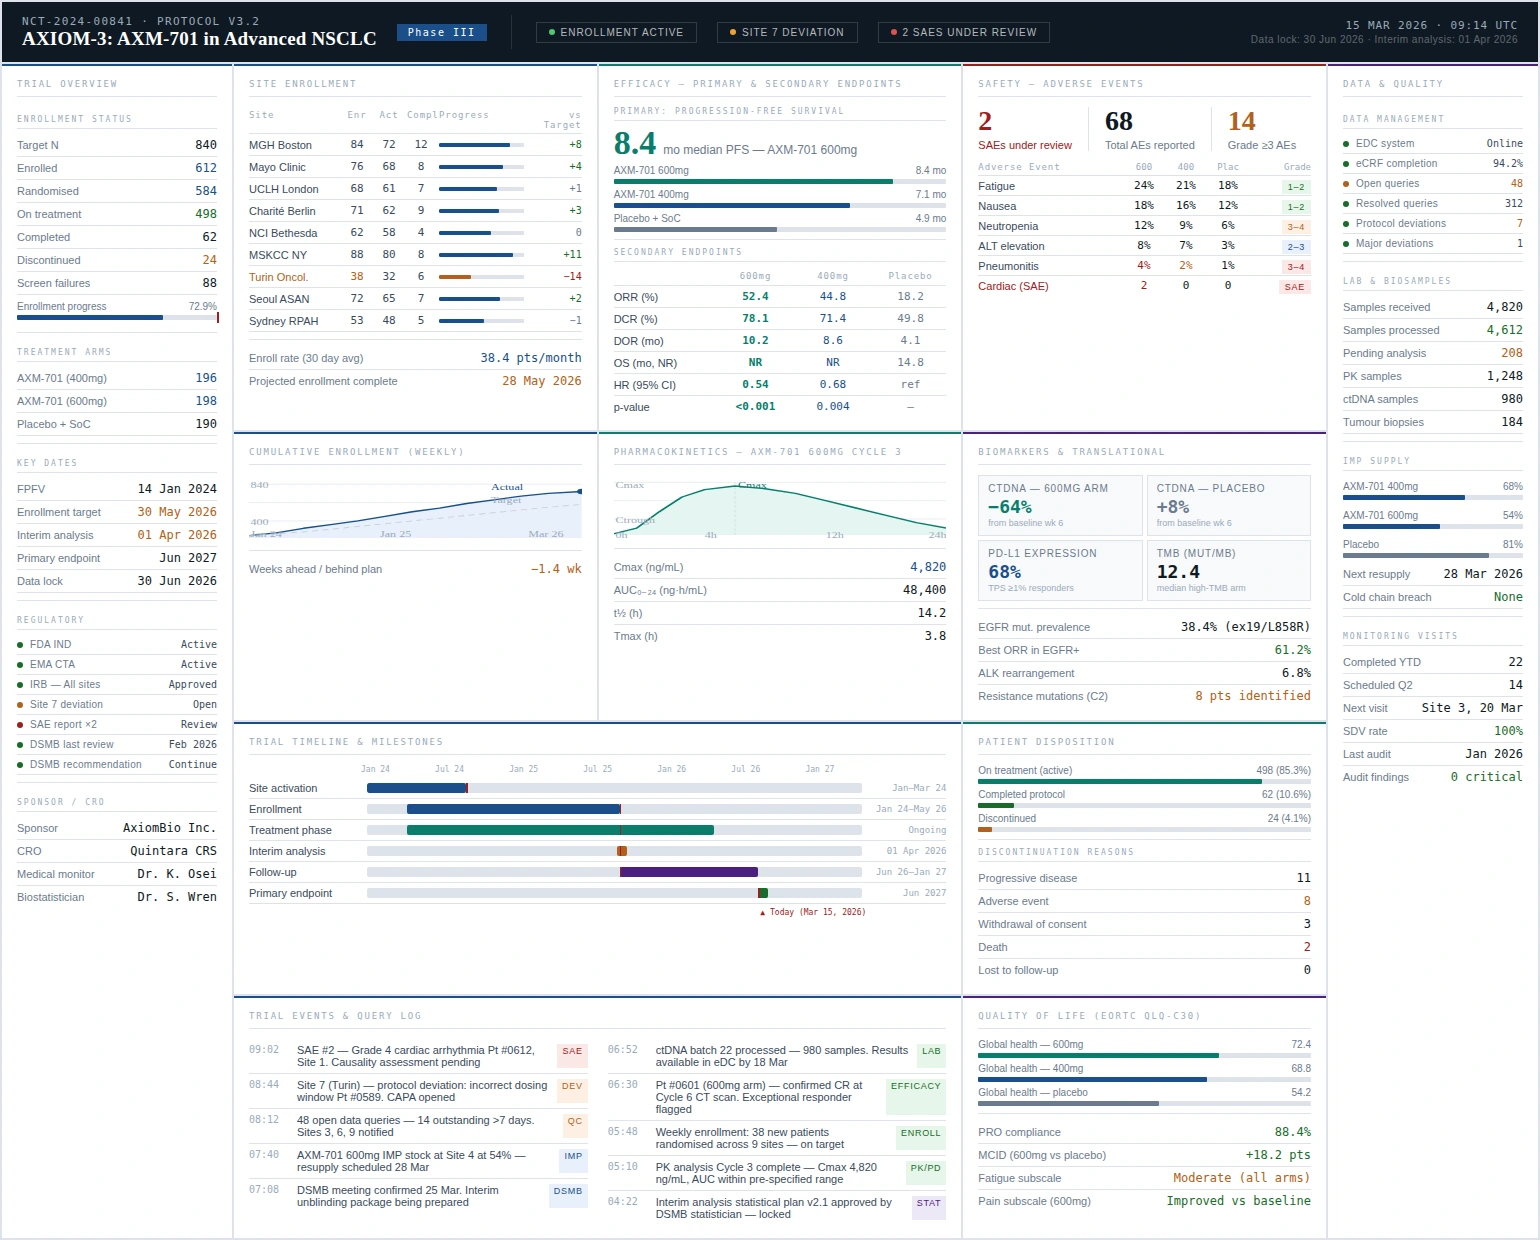
For seven years, Mammoth Analytics served as AstraGen’s primary business intelligence tool. It powered hundreds of dashboards tracking clinical trial enrollment, pharmacovigilance signals, manufacturing yield metrics, and global sales performance. In the early years, the platform’s OLAP capabilities and report scheduler met basic needs. However, as the company scaled operations across three continents and embraced next-generation sequencing, wearable patient data streams, and real-time IoT sensors in its manufacturing plants, Mammoth’s limitations became critical pain points.
Large-scale genomic datasets routinely caused query timeouts exceeding ten minutes. Integration with AstraGen’s SAP ERP and Salesforce CRM required constant custom scripting, consuming valuable IT resources. Non-technical users—research scientists, medical affairs teams, and regional sales directors—struggled with Mammoth’s steep learning curve, leading to heavy reliance on a small group of BI developers. Annual licensing and maintenance costs had also climbed 28 percent in the past three years, straining budgets amid rising R&D expenditures.
Regulatory pressures compounded these issues. Preparing 21 CFR Part 11-compliant audit reports for FDA submissions often took weeks of manual effort. Security features, while adequate, lacked the granular role-based controls and automated encryption validation demanded by today’s stringent global privacy standards.
Regulatory pressures compounded these issues. Preparing 21 CFR Part 11-compliant audit reports for FDA submissions often took weeks of manual effort. Security features, while adequate, lacked the granular role-based controls and automated encryption validation demanded by today's stringent global privacy standards.

A Thorough Vendor Evaluation Leads to InetSoft
In January 2025, Chief Information Officer Michael Torres assembled a cross-functional selection committee comprising representatives from IT, clinical research, manufacturing, finance, and compliance. After issuing a detailed RFP to twelve leading analytics vendors and conducting three-month proof-of-concept pilots, InetSoft emerged as the unanimous choice.
InetSoft’s dashboard software impressed evaluators with its drag-and-drop visual designer, lightning-fast in-memory analytics engine, and native support for hundreds of data connectors. Unlike Mammoth’s rigid architecture, InetSoft allowed seamless blending of structured trial data with unstructured adverse-event narratives and external real-world evidence sources. Interactive visualizations—heat maps of drug efficacy across demographics, predictive supply-chain gauges, and dynamic patient cohort explorers—rendered instantly even on terabyte-scale datasets.
Security and compliance were equally compelling. InetSoft delivers full encryption at rest and in transit, automated 21 CFR Part 11 audit trails, and granular permissions that let researchers view only de-identified datasets while compliance officers retain full access. The subscription licensing model also promised 38 percent lower total cost of ownership over three years, with unlimited user scaling and no hidden maintenance fees.
Phased Migration and Rapid Adoption
Migration began in March 2025 with a meticulous data audit and cleansing phase. Using InetSoft’s built-in import wizards, more than 240 legacy Mammoth dashboards were transferred without loss of historical context. Parallel operation of both systems for ten weeks ensured zero disruption to ongoing clinical programs.
Training reached 780 employees through live workshops and on-demand video modules. Users praised the intuitive interface that empowered them to build custom reports in minutes rather than days. By September, the full switch was complete. Early metrics tell a compelling story: average dashboard load time dropped from 7.2 minutes to under 1.4 seconds, even for the most complex genomic queries.
Clinical research teams now identify safety signals 42 percent faster, shaving weeks off pharmacovigilance review cycles. Manufacturing dashboards provide real-time yield predictions with 91 percent accuracy, cutting inventory holding costs by 17 percent. Sales and marketing groups leverage embedded AI trend forecasting to refine launch strategies, improving revenue projections by 23 percent.
"InetSoft didn’t just replace our old system—it unlocked insights we didn’t know were possible. Researchers who once waited hours for data now collaborate in real time, directly impacting how quickly we bring life-saving therapies to patients." — Dr. Sarah Kline, Vice President of Clinical Research

Measurable Business Impact and Future Roadmap
Financially, the transition has already generated $1.8 million in annualized savings through reduced IT support tickets and lower licensing fees. Operational efficiency gains extend beyond dashboards: automated compliance reporting now takes hours instead of weeks, freeing regulatory affairs staff for higher-value work.
The environmental benefits are noteworthy as well. More efficient query processing reduced server utilization by 24 percent, helping AstraGen meet its corporate sustainability targets. The platform’s mobile-responsive design has also transformed field medical and sales workflows, enabling instant access to trial data during global conferences and customer meetings.
Looking ahead, AstraGen plans deeper integration with machine-learning models for predictive pharmacoeconomics and personalized medicine simulations. Leadership is also exploring embedding InetSoft dashboards into partner portals for transparent data sharing with contract research organizations and key opinion leaders.
This successful migration from Mammoth Analytics to InetSoft reflects a broader industry shift. Pharmaceutical companies worldwide are moving toward agile, self-service analytics platforms that scale with exploding data volumes while meeting the strictest regulatory demands. For AstraGen Pharma, the decision has proven transformative—accelerating innovation, strengthening compliance, and delivering a clear competitive advantage in an increasingly data-driven healthcare landscape.
With InetSoft powering its analytics future, AstraGen is well positioned to continue delivering breakthrough therapies that improve and extend patients’ lives around the globe.

More Insights About Dashboard Analysis Software
Offering Better Epicor Executive Dashboards - Looking for better Epicor executive dashboards? InetSoft, a pioneer in self-service oriented dashboard software allows for more personalization and supports data mashups across multiple sources for the broadest view of corporate performance. View a demo and try interactive examples...
Office of Decision Support System Dashboards - Looking for good decision support system dashboards? InetSoft's pioneering dashboard reporting application produces great-looking web-based dashboards with an easy-to-use drag-and-drop designer. View a demo and try interactive examples...
OLAP Reporting and Dashboard Tool - InetSoft offers a software platform for dashboards, visual analysis, and reporting to be used in conjunction with an OLAP server or any combination of open standards data sources. InetSoft's StyleBI supports popular OLAP servers such as Microsoft SQL Server Analysis Services, Hyperion Essbase, and SAP NetWeaver...
One Business Dashboard for All - Looking for a good all in one business dashboard solution? InetSoft is a pioneer in self-service dashboard software with a drag-and-drop designer for business users. View a demo and try interactive examples...
One of the Top Dashboard Options - Looking for the top dashboard options? InetSoft is a pioneer in business intelligence offering a dashboard tools that are easy to set up and use. View a demo and try interactive examples...
Online Analytic Dashboard Creation Solution - Looking for a good online analytic dashboard creation solution? InetSoft's pioneering dashboard reporting application produces great-looking web-based dashboards with an easy-to-use drag-and-drop designer. View a demo and try interactive examples...
Online Dashboard Software - Dashboards have become the number one business intelligence tool in use today. Dashboards supply professional users with an quick look at key performance indicators pertinent to business operations. Dashboards provide the working professional world with a means of gauging the temperature of their business versus the rest of their industry. Properly created dashboards are simple, visually perceptible, aesthetically pleasing, and organized. They also apply human visual understanding to the visual delivery of information...
Online Dashboards and Reporting Software - Looking for good online dashboards and reporting software? InetSoft is a pioneer in self-service dashboards and production reporting. View a demo and try interactive examples...
Online Dashboard Creator - Online dashboards have become the number one business intelligence tool in use today. Dashboards supply professional users with an quick look at key performance indicators pertinent to business operations...
Online Data Visualizer - With the use of an online data visualizer, you can transform your raw data into visualizations that are not only easy to understand, but also much more efficient for the entire business...
Online Food Delivery Dashboard - KPIs for Measuring Overall Performance. KPIs are an effective way to present a consolidated view of the performance of an organization in a quantifiable format. Inetsoft's StyleBI assists the designers in making the key food delivery metrics such as revenue and average customer review available to the business users, in large, easy to read text.. The designers have chosen to highlight the metrics on the dashboard in a way that encourages the business users to keep overall performance in mind....
Online Interactive Dashboard - Looking for a new way to keep track of performance and improve overall efficiency of any task? InetSoft's online interactive dashboard software has proven to be a highly effective business tool for both monitoring and analyzing data to meet the queries of any user...
Online Gaming Dashboard - With this onling gaming dashboard constructed with InetSoft's StyleBI solution, game companies are allowed to customize the dashboard with rich and self-service interactivity. While bringing together disparate data from a variety of sources, users can easily import various datasets and combine them through InetSoft's data mashup technology, which allows users to discover more underlying trends and gain meaningful insights at a comprehensive level. InetSoft's data mashup technology combines various data sources on common dimensions so that an aggregation of sources can be analyzed and manipulated within a single view, helping InetSoft's users analyze their business on a deeper level...
On Premise Dashboard Software - Looking for on premise dashboard software? InetSoft is a pioneer in self-service, server-based dashboard software that can easily be installed in any network environmment. View a demo and try interactive examples...
Operations Dashboard - Operations dashboards are useful in managing and displaying the daily activities that go on within a company. Information provided by these applications allows companies to examine the key performace indicators which are vital towards achieving business goals or objectives. The end goal is to gather and utilize the data from these dashboards to enhance daily business activities. Key trends and changing metrics are observed to come to important conclusions which will enhance a company...
Operational Dashboards for Universities - So what does this mean to our academic community? By gathering this data you can really see whether you need to change your priorities. We set our priorities once a year, and we will make those priorities. I review them every quarter, and every once in a while, we know have to change them. Having that data helps us know when we have to change them. Here are some questions that can help you get started on your operational dashboard for your university. What metrics do you already collect? Where do they live? What are you already tracking? What is not worth tracking? What metrics are key performance indicators? What can you automate? And who will be using it? Let me show you some more dashboards we have made for our support center. Here are the contacts to the support center. The trend here is about the same as last year. The levels are lower, but the pattern is consistently that way. So maybe our course management system settling down has been a good thing for us. We had to figure that out. What I look at here is I have multiple campuses to look at, but what I am seeing is that so far this fiscal year we have had 70,000 contacts into the support center...

Operations Management Dashboards - A large part of the North American market data was available in a data warehouse which also included some of the forecast and budget information. But the real challenge that they faced was how to relate that on a global basis because the drugs in rest of the world Europe, Asia Pacific, et cetera were being primarily sold through wholesalers and distributors, and to get a full picture they have had to federate a lot of that information. So they had multiple challenges. First the formats in which they were getting the data was very disparate and had to be normalized and accessed. Some of that was semi-structured data and had to be transformed, matched and integrated. But also they needed to be able to access it in a very dynamic real time way. So the data services platform in this case is taking data from a data warehouse or a physical data store and mashing that up with a variety of data sources and then presenting the same virtual view of data in multiple ways. One of the benefits of the data services platform is you can have a logical view but then you can present it in different upfront formats. So in this case it can be pushed to an Excel spreadsheet or a query but it can also be accessed as a daily sales report, which is standard practice today, and they will continue to do that. But now they are also able to enable a Web portal and mobile applications to pull up specific drugs by specific drilldowns by geography, et cetera., et cetera, and also push that data in a batch mode to a historical data mart for analysis...
Optimizely Dashboard Solution - Looking for a good solution for Optimizely dashboard reporting? InetSoft's pioneering BI application produces great-looking dashboards that give you more self-service analytic capabilities. View a demo and try interactive examples...
Option for Snowflake Dashboard Solution - Looking for a good Snowflake dashboard solution? InetSoft is a pioneer in self-service dashboards and can mashup data in Snowflake with almost any other data source. View a demo and try interactive examples...

Oracle Dashboard - InetSoft has engineered a high performance, interactive, and easy-to-use BI dahsboarding and reporting tool offering flexibile features that can be configurable to various data sources. When using a business intelligence software to analyze data, it is vital that the software is able to gain access to the databases which the company is working with, such as the popular choice of Oracle. With reliable access to the companies' databases, InetSoft's StyleBI can build analytical charts, create high performance dashboards, and lead the business to succesfully meet their objectives with the most up-scale technology.
Order Analysis Dashboard - The Orders Analysis Dashboard is an example of an interactive web-based analytical dashboard built using InetSoft's software that could be used by a supplier in any industry. This particular chart allows users to track and analyze sales orders of different industries. With a easy-to-use point and click environment, users can also drill down into orders by geography, different suppliers, and/or specific industries for an even more accurate analysis...
Partner for Embedded Dashboards - Cloud-Native Technology, Cloud Deployment Flexibility Includes 1-on-1 best practice guidance for design, embedding & rebranding Free Best Practice Guidance Backed by real-world experience, we will help you plan the most efficient path to product roll-out...
Patient Acquisition Dashboards KPIs and Analytics - One of the most important components of a successful healthcare company is patient acquisition and retention. Reaching and interacting with prospective patients is just as important as delivering high-quality medical treatment. Healthcare companies and providers monitor their patient acquisition efforts using a range of analytics and key performance indicators (KPIs) to do this. This article will discuss patient acquisition KPIs and analytics and how they may help healthcare firms compete. The proportion of prospective patients who complete a desired activity, such making an appointment, subscribing to a newsletter, or getting in touch with the healthcare provider, is measured by the conversion rate, a core key performance indicator. This KPI is essential since it shows how well a healthcare organization's patient acquisition tactics work. A high conversion rate shows that the website, marketing campaigns, and other channels used by the healthcare organization are effective in persuading prospective patients to proceed with their engagement with the provider. On the other hand, a poor conversion rate might indicate that the organization's message, the accessibility of its website, or its call-to-action buttons need to be improved. Healthcare companies often do A/B tests, examine user behavior on their websites, and fine-tune their marketing strategies in order to increase conversion rates...
Patient Engagement Dashboards KPIs and Analytics - Modern healthcare places a high value on patient engagement, and physicians work hard to increase patients' participation in their treatment process. Analytics and key performance indicators (KPIs) are essential to reaching this objective. Healthcare practices may optimize their strategy, improve patient outcomes, and improve the entire healthcare experience by monitoring and evaluating different elements of patient involvement. We'll look at the key KPIs and statistics used in patient engagement in the following article. The proportion of prospective patients who complete a desired activity, such making an appointment, subscribing to a newsletter, or getting in touch with the healthcare provider, is measured by the conversion rate, a core key performance indicator. This KPI is essential since it shows how well a healthcare organization's patient acquisition tactics work. A high conversion rate shows that the website, marketing campaigns, and other channels used by the healthcare organization are effective in persuading prospective patients to proceed with their engagement with the provider...
Payments Dashboards for QuickBooks - Looking for a good dashboard solution for QuickBooks Payments? InetSoft's pioneering BI application produces great-looking dashboards that maximize self-service for finance professionals. View a demo and try interactive examples...
Payroll Dashboard Application for QuickBooks Online - Looking for a good dashboard application for QuickBooks Online? InetSoft's pioneering BI application produces great-looking dashboards that mashup accounting data with other data in your enterprise. View a demo and try interactive examples...

Payroll Dashboards for PeopleSoft - InetSoft, a pioneering BI vendor since 1996, offers a web based dashboard system for creating bettter payroll dashboard for PeopleSoft. Try it now...
Payroll Managers Use Dashboards - Payroll managers can use dashboards to gain quick access to critical information and metrics related to their payroll functions. A dashboard is a visual representation of data that allows users to quickly analyze and interpret information. Here are some ways payroll managers can use dashboards: Monitor payroll processing: Payroll managers can use dashboards to monitor the progress of payroll processing. They can view real-time data on the number of employees paid, hours worked, and wages paid. Manage compliance: Compliance is a crucial aspect of payroll management. Payroll managers can use dashboards to ensure that their payroll processes are compliant with local and federal regulations. They can view data related to taxes, deductions, and employee classifications to ensure that they are meeting legal requirements. Track employee data: Payroll managers can use dashboards to track employee data, such as attendance, vacation, and sick leave. They can use this data to ensure that employees are paid accurately and that their payroll records are up-to-date. Analyze payroll costs: Dashboards can provide payroll managers with insights into their payroll costs. They can view data on payroll expenses, including salaries, wages, and benefits, and use this information to identify cost-saving opportunities...
Pension Administration Dashboards - Pension administration involves managing complex processes, from enrolling new members to ensuring timely payments to retirees. As pension funds grow in size and complexity, administrators increasingly rely on dashboards to monitor and manage their operations. These dashboards track key performance indicators (KPIs) and metrics that provide insights into the health of the pension fund, the efficiency of administrative processes, and the satisfaction of members. In this analysis, we will explore various KPIs and metrics commonly tracked in pension administration dashboards, define these KPIs, and discuss their significance in performance management. Member Enrollment and Demographics KPI: Active Membership Count Definition: The total number of active members currently enrolled in the pension plan. Significance: This KPI helps administrators monitor the growth or decline of the pension fund. A rising active membership count may indicate healthy enrollment and engagement, while a decline could signal issues with member retention or attractiveness of the plan...
PeopleSoft Dashboards and Cross-Module Analytics - PeopleSoft has long been a reliable enterprise resource planning (ERP) solution for organizations managing human capital, finance, and campus operations. Its built-in reporting tools, such as Query Manager and nVision, have allowed administrators to generate lists, summaries, and basic dashboards for decades. However, as organizations increasingly demand real-time insights, cross-module analysis, and self-service capabilities, the limitations of PeopleSoft’s native dashboards become more apparent. For many, the question is no longer whether they need dashboards, but how to modernize them without replacing the entire ERP system. PeopleSoft’s delivered dashboards provide out-of-the-box visibility into key metrics, but they come with several constraints. For one, they are often static and inflexible. Query Manager reports require a predefined structure, and nVision dashboards, while powerful for financial reporting, are heavily grid-based and can be difficult to adapt for other operational needs. Customizations are possible, but they often require technical expertise and complex scripting, creating a bottleneck for business users who need timely insights...
Performance Dashboard Examples - Let's take at look at the performance dashboards. Performance dashboards allow businesses to track important and sometime confusing numerical data, in easy to understand visual representations. Performance dashboards can streamline a businesses data and allow employees and managers to use their time more efficiently. No matter what data you are trying to record, whether it is daily sales, monthly profit, or quarterly earnings, performance dashboards can easily manipulate your data into visually eye-pleasing dashboards...
Performance Metrics Dashboard for Applications - Looking for a application performance metrics dashboard tool? InetSoft's flexible dashboard application produces great-looking cloud-based dashboards with an easy-to-use drag-and-drop designer. Mash up your application performance data with any other inside or outside your enterprise. View a demo and try interactive examples...
Performance Log Interactive Dashboard - The Performance Log Interactive Dashboard below is a web-based analytical dashboard constructed using InetSoft's innovative software. A pioneer in business intelligence solutions, InetSoft paves the way for dashboard, reporting, and data mashup solutions for organizations across different industries. The example below well-demonstrates the richness in features of InetSoft's solution, one being the slew of different charts available for users to include in their dashboards. These charts serve as a very useful complement for users wanting to analyze a specific set of data or drill-down into the data. For performance logs like the machine downtime example, the ability to filter and have control over the information greatly benefits the analysis process as users can break it all the way down to the minute, machine type, alert type, and/or severity of downtime. InetSoft's visualization software combines ease of use with detailed tools and features to help users in day-to-day operations, as well as help them keep track of and achieve long term goals and objectives...