Trial InetSoft's Web-based Dashboard Application Online
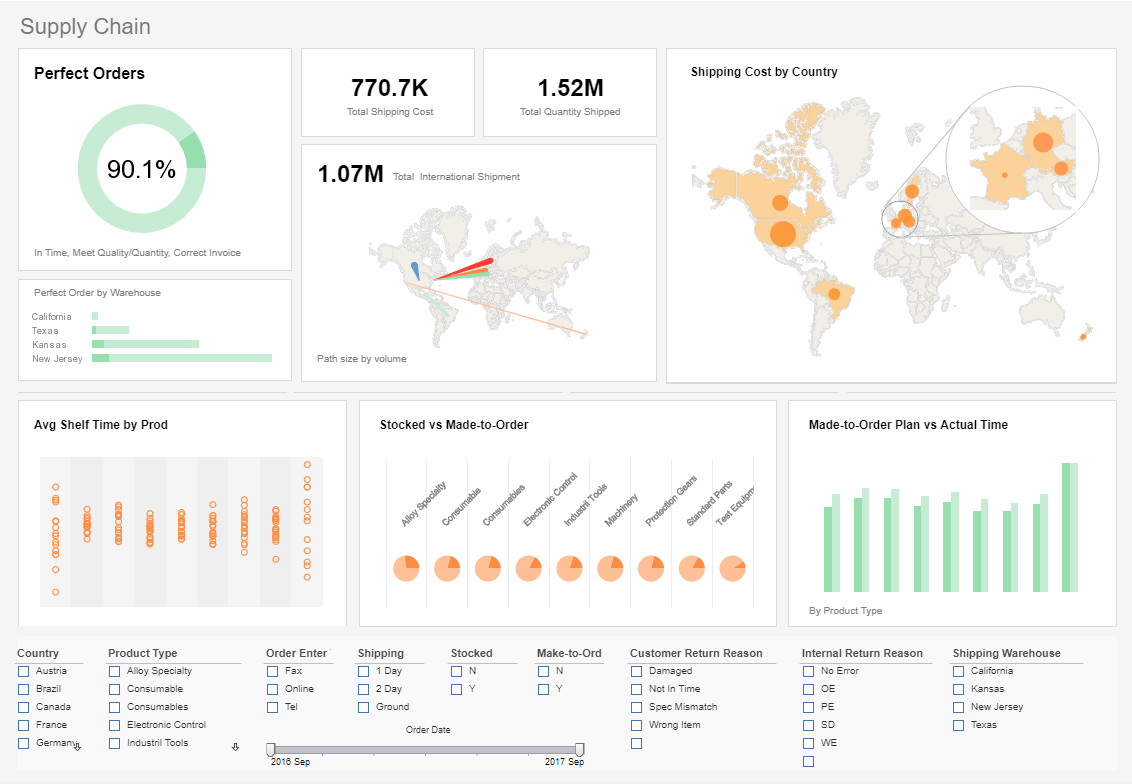
Are you looking to purchase a web-based dashboard application? Since 1996 InetSoft has been making business software that is easy to deploy and easy to use. Build self-service oriented interactive dashboards quickly. View a demo and try our application online for free.

Register for more info and to download free software
About InetSoft
Since 1996 InetSoft has been delivering easy, agile, and robust business intelligence software that makes it possible for organizations and solution providers of all sizes to deploy or embed full-featured business intelligence solutions. Application highlights include visually-compelling and interactive dashboards that ensure greater end-user adoption plus pixel-perfect report generation, scheduling, and bursting. InetSoft's patent pending Data Block™ technology enables productive reuse of queries and a unique capability for end-user defined data mashup.
This capability combined with efficient information access enabled by InetSoft's visual analysis technologies allows maximum self-service that benefits the average business user, the IT administrator, and the developer. InetSoft was rated #1 in Butler Analytics Business Analytics Yearbook, and InetSoft's BI solutions have been deployed at over 5,000 organizations worldwide, including 25% of Fortune 500 companies, spanning all types of industries.

How Do Payroll Managers Use Dashboards?
Payroll managers can use dashboards to gain quick access to critical information and metrics related to their payroll functions. A dashboard is a visual representation of data that allows users to quickly analyze and interpret information. Here are some ways payroll managers can use dashboards:
-
Monitor payroll processing: Payroll managers can use dashboards to monitor the progress of payroll processing. They can view real-time data on the number of employees paid, hours worked, and wages paid.
-
Manage compliance: Compliance is a crucial aspect of payroll management. Payroll managers can use dashboards to ensure that their payroll processes are compliant with local and federal regulations. They can view data related to taxes, deductions, and employee classifications to ensure that they are meeting legal requirements.
-
Track employee data: Payroll managers can use dashboards to track employee data, such as attendance, vacation, and sick leave. They can use this data to ensure that employees are paid accurately and that their payroll records are up-to-date.
-
Analyze payroll costs: Dashboards can provide payroll managers with insights into their payroll costs. They can view data on payroll expenses, including salaries, wages, and benefits, and use this information to identify cost-saving opportunities.
-
Report on payroll performance: Payroll managers can use dashboards to create reports on payroll performance. They can track key performance indicators (KPIs), such as payroll accuracy, processing time, and employee satisfaction, and use this information to identify areas for improvement.
 |
Read how InetSoft saves money and resources with deployment flexibility. |
Do Payroll Managers Use Analytics?
Payroll managers can use analytics to gain insights into their payroll processes and improve their performance. Analytics is the process of collecting, processing, and analyzing data to gain insights and make informed decisions.
Here are some ways payroll managers can use analytics:
-
Predictive analytics: Payroll managers can use predictive analytics to forecast payroll costs and identify potential cost savings. They can analyze historical payroll data to identify trends and patterns that can help them make informed decisions about future payroll expenses.
-
Performance analytics: Payroll managers can use performance analytics to track the performance of their payroll processes. They can monitor key performance indicators (KPIs), such as processing time, accuracy, and employee satisfaction, and use this information to identify areas for improvement.
-
Compliance analytics: Compliance is a critical aspect of payroll management, and payroll managers can use compliance analytics to ensure that their payroll processes meet legal requirements. They can analyze data related to taxes, deductions, and employee classifications to ensure that they are complying with local and federal regulations.
-
Employee analytics: Payroll managers can use employee analytics to track employee data, such as attendance, vacation, and sick leave. They can use this information to ensure that employees are paid accurately and that their payroll records are up-to-date.
 |
Read the top 10 reasons for selecting InetSoft as your BI partner. |
More Articles About Web Dashboard Management
Articles About Departmental Business Intelligence - Looking for departmental business intelligence examples? InetSoft's industry pioneering BI platform can support any department's dashboard needs. Interact with examples in the library, read articles about its capabilities below, and request a personalized demo. Integrated into the application is a pre-built KPI dashboard that monitors eleven key metrics: Equipment downtime. Maintenance backlog. Percentage of planned work for prior month. Maintenance cost as a percentage of equipment replacement value...
Collection of Good Management Dashboard Examples - Below are some good examples of management dashboards. A management dashboard can be looked at as an executive tool whose sole purpose it to make information easier to read. These dashboards can include a variety of different types of data, which can all be integrated into an easy to read dashboard. Good management dashboards allow users to seamlessly transition from one graph to another, without losing any important data...
ETL Disadvantages: IT Centric & Static - They do have some weaknesses though. ETL tools, typically, aren't that great at near-real time or on-demand data access. They were geared towards more of a batch mode of working. It should be used for well established, slow changing data transformation for data warehouse. Furthermore, ETL is a IT tool that's not accessible to data analytics and business users directly. So for most people in the data warehousing environment, in particular, I would say that 80 to 90% of their needs are met with an ETL tool...
Explain Data Product Management - Data product management is a lot like making the perfect pizza. You want it to be delicious, but you also want to be efficient with your ingredients. This can be tricky when dealing with large data sets and tons of customer data. However, if you use these best practices from data product management, you will be able to enjoy a tasty pie in no time...
How Do Network Operations Managers Use Dashboards? This NOC dashboard basically collects the information on current incidents. Using this dashboard, your managers can easily track down the violation of SLA (Service Level Agreement). It also helps your team understand new insights into open and unassigned incidents. Eliminating the problem before it arises will come handy in running a successful network...
How Many Types of Analysts Are There? - There are four types of analysts out there, and they have labels: "Super User", "Business Analyst", "Analytical Modeler", and "Business Manager." Super User, he is a business guy in sales, or marketing, or finance who has gravitated toward the technology, finds that he likes using Excel or the BI tools, likes building reports and rolling up his sleeves and wading into the data. And over time he has become the go-to guy for everyone in the department to build ad hoc reports or ad hoc views of information...
Information May Not Be Readily Accessible - This treasure trove of information may not be readily accessible or integrated across these systems and devices or pushed up to C-level dashboards to guide the improved decision making that all of us seek. Obviously, the CFO is the one to ensure that this vital information is available to relevant users anywhere, at any time, and on any kind of device...
Management Reporting History and Trends - Previously, legacy systems were the main computing system used. Currently, there are businesses which still use the legacy system due to different reasons. The legacy system is still capable of fulfilling the purpose for which they were initially designed. However, the system does not permit growth, which is a significant aspect of any business that needs to survive the current dynamic business sector...
More Agile Environment for Reporting - The other area, and this is related to reduction of cost, is the reduction of complexity. Firms are seeking a far more agile environment to support their business processes and their product and service development. The driver for this really comes from the rapid changes that we see and the nature of the market as well as the ever-changing regulatory environment...
 |
View live interactive examples in InetSoft's dashboard and visualization gallery. |
Polished Visualization Technology - Adding InetSoft's polished interactive dashboard visualization technology will be a welcome addition for both the operations users of Resolve as well as for the managers who made the investment decision to acquire it. Other aspects that made InetSoft stand out from the many options we evaluated were the ease of integration with our application and the level of support their team offered early in the proof-of-concept stage...
Read About Dashboard Business Intelligence Apps - Looking for dashboard apps? InetSoft offers free and commercial Web-based dashboard software. View a demo. Try today for free. The balanced scorecard is a strategic planning and management system that is used in business and industry, government, and nonprofit organizations worldwide to align business activities to the vision and strategy of the organization, improve internal and external communications, and monitor organization performance against strategic goals...
See a Management Dashboard Demo - The best way to keep your finger on the pulse of your enterprise is with business intelligence dashboards. Top management face the challenge of making sure that day-to-day business activities are aligned with the company's long-term goals. One way to periodically and conveniently track performance is with dashboards displaying Key Performance Indicators (KPIs)...
Spotlight on Manufacturing Quality Reporting - A manufacturer with an R&D unit based in the US as well as manufacturing sites located globally needs to have closed-loop information exchange to quickly bridge the gaps between design and production. In order to provide design tweaks to reduce the defect rate, R&D needs to see standardized defect data collected from company-run factories...
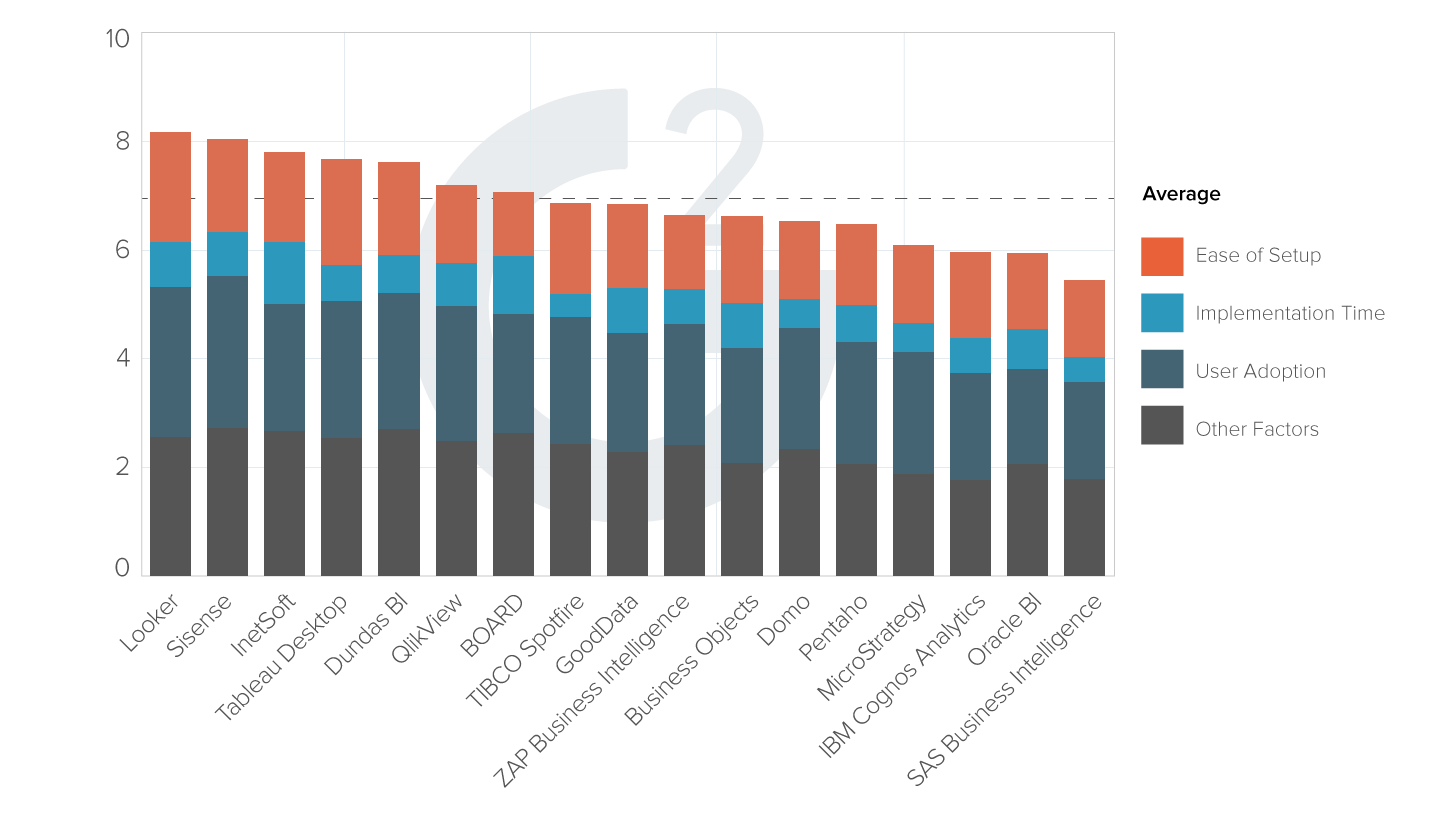
| #1 Ranking: Read how InetSoft was rated #1 for user adoption in G2's user survey-based index | Read More |
Top Examples of Management Dashboards - The best way to keep your finger on the pulse of your enterprise is with business intelligence dashboards. Top management face the challenge of making sure that day-to-day business activities are aligned with the company's long-term goals. One way to periodically and conveniently track performance is with dashboards displaying Key Performance Indicators (KPIs)...
Ways Descriptive Analytics Are Used - The next way both employees and leaders use data to transform the way their business is: 2. Increased Operational Efficiency and Asset Utilization One major part of analytics made possible with business intelligence is descriptive analytics. Simply explained, descriptive analytics evaluates business data and converts it into something decision makers can understand and base their actions on. Simple examples of descriptive analytics reports are sales, customer, and operations reports...
What Is Proactive Performance Management? - So what we're going to look at now is the idea of the day-to-day thought leadership forum. This forum is very fond of talking about the opportunity that performance management has to help drive the creation of self-actualizing organizations. So this is a very simple comparison chart that talks about reactive performance management when it's implemented in many organizations because it's relatively simple and it's easy to understand versus proactive performance management...
Why Do Telecom Managers Use Dashboards? - Data visualization is crucial for managers of telecom companies. They have to deal with a lot of data at the same time, and the only way to handle that efficiently is to be able to visualize it. Telecom companies generate a lot more data than many other companies and industries. Managing this extensive data might result in problems for the managers and staff if they cannot handle it properly. Scheming, through hundreds of documents, will only create...


