Articles about InetSoft's Data Management and Reporting Software
Are you looking for data management software that also includes dashboards and reporting? InetSoft offers Web-based BI software that includes a flexible data access engine. No need for a data warehouse with direct access to disparate operational data sources of almost any type. Below are articles about InetSoft's software:
Reading Comprehension Metrics for Big Data - Big data is the field where information is abundant and constantly flowing. Understanding what it all means is definitely not a walk in the park, at all. It doesn't matter if you had top-notch technical skills, when you failed to understand the underlying context and implications of the data, you risk missing out on crucial insights and making misguided decisions. This is where reading comprehension comes in, the skill we use to understand written information. Other than technical expertise, reading comprehension skills are now more important than ever as computers sift through huge amounts of data, looking for patterns and insights. Let's dive more deeply into it...
Reasons People Find Data Mashup Interesting - Some of the reasons people find data mashup interesting is for when they want to make sure to include all these different data sources that are out there now. It really comes from the imperative to have that unified view of corporate performance in an executive monitoring dashboard or balanced scorecard. There are different ways people want to be able to see data and performance in many different functions. Another one to point out is that people are finding it useful for those temporary projects. For example, maybe the marketing department is doing a campaign with an outside vendor, and the vendor reports back the results of the interactions of the campaign by different leads and prospects in a spreadsheet, and it's just a one-time project. You still want to integrate that data with your CRM and see what’s happening with the sales that are resulting from those leads, but you don’t necessarily want to import all that campaign data into your CRM or create a data warehouse for it...
Referencing a Cell with Absolute Parent Group Reference - You can also use the value of the parent group to compare summary cells. To refer to a summary cell in another header group, use the absolute value of the header group, as shown below $cellName['grpName:absolute_value'] e.g., $sales['state:NJ'] $sales['yr:"2002"'] - specify numeric values in quotes Consider a formula table based on the 'All Sales' query. In this example, you will find the relative sales for each year compared to the fixed year 2002. Follow the steps below: 1. Create a new report, and add a table with three rows and three columns. 2. Add the following script to the report's onLoad Handler to store the results of the 'All Sales' query: var q = runQuery('All Sales'); 3. Select cell[1,0] in the table. Right-click on the cell and select 'Format' from the context menu. This opens the 'Format' panel at the bottom. The second toList argument groups the returned dates by year. a. Select the Data tab. In the 'Binding' panel, select the 'Formula' option, and enter 'toList(q['Order Date'],'date=year')' as the formula. b. In the 'Cell' panel of the Data tab, enter 'yr' for the 'Cell Name' of cell[1,0]. c. In the 'Expansion' panel of the Data tab, select 'Expand Cell' to set cell[1,0] to expand 'Vertical'...
Relational Databases Are Not Going Away - Yeah, that was a good question. We do not see things converging, and we think that the relational database is not going away. It feels like that was a little bit of hype years ago that that may happen, but in reality we are probably seeing the opposite. To the end-user or the data analyst or the knowledge worker who is working with data and seeing data, they want to see one interface to it. Not to sound overly self-serving of something InetSoft tries very hard to be, but we can be that one interface. All the very different formats of data doesn't matter in reality in the back end of it. We are not seeing customers retiring the relational databases and moving to favorite non-relational store. What they're doing, they are rightsizing potentially, and so there's less storing in proprietary MPP data warehouse platforms, as an example and storing more in the data lake and so they have a multi-tiered strategy at that point or they are using technologies for data virtualization, data federation to unify querying across a number different data sources...
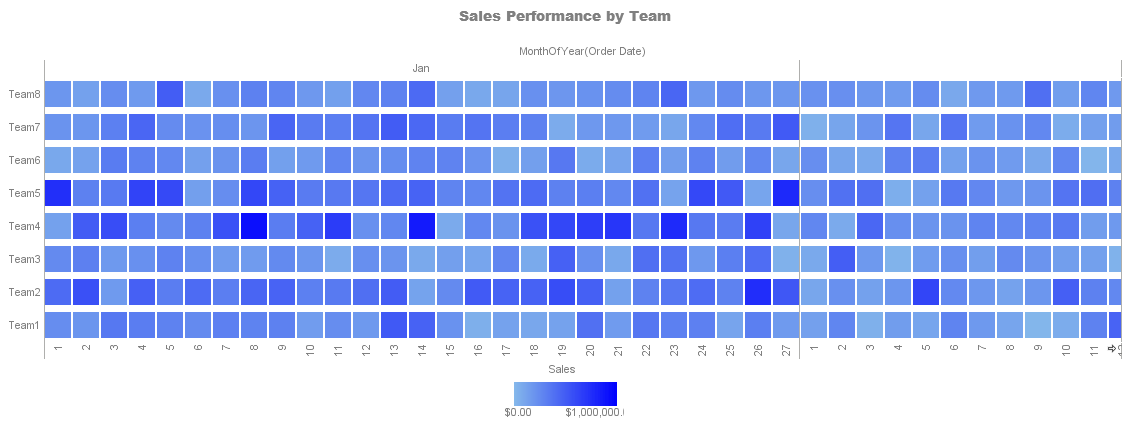 |
Click this screenshot to view a 2-minute demo and get an overview of what InetSoft’s BI dashboard
reporting software, StyleBI, can do and how easy it is to use.
|
Relative Cell Referencing - You can assign a name to any cell within a formula table; expanding cell, summary cell, or a static cell with a hard-coded value. You can then use the cell's name to reference the value of the cell from within another formula. The Referencing Query Data section explained how to extract and filter records from a specified column of a query result set. All of the examples in that section used hard-coded values as the filtering parameters. To perform dynamic filtering, use cell references as the filtering parameters. This is particularly useful when the table has multiple levels of row/column headers, and you wish to filter the sub-level based on the parent level. In this example, you will create a formula table (based on the 'customers' query) with a two-level row header consisting of 'State' and 'Cities within the State'. 1. Create a new report. Add a table with four rows and three columns. 2. Run the 'customers' query in the onLoad script. (See Extracting Data from a Query for more details.) var q = runQuery('cutomers') 3. Select cell[1,0] in the table. Right-click on the cell and select 'Format' from the context menu. This opens the Format panel at the bottom...
Rigorous Design of Data Governance - Rigorous design of data governance sounds like it could be pretty time consuming for some people. So in order to get funding or just the authorization to spend the time on this, should people head straight for the top and convince executives to give them a blank check and a big stick to solve the problem or? It goes back to the fact that for date governance, there really aren’t standard best practices. The answer really does depend on how the company’s decision making processes look. For instance, we’re working right now with a large financial services firm, and the C level executives there have a lot of control, and the company can turn on a dime based on executive edict. So the CEO says, you know what, we’re going to become more customer focused, and everybody changes the way they do things. A company like that would probably be better at adopting a top down approach to data governance. That starts with a small steering committee that has enough authority to make things happen. And I compare that with a high tech company that we’re working with, that almost practices anarchy when it comes to decision making. Whenever there’s a problem, somebody just fixes it themselves. So there a grass roots effort might make more sense than imposing executive edicts around governance. So to answer the question about best practices for data governance, it really all does come back to what current decision making practices look like and how the company’s culture supports them...
 |
View live interactive examples in InetSoft's dashboard and visualization gallery. |
Role of Data Analytics in Building a High-Performance Workforce - Nowadays, organizations face the ongoing challenge of optimizing their workforce to achieve peak performance. The key to unlocking the full potential of any organization lies in leveraging employee data at scale and using powerful data analytics tools to make informed decisions about talent acquisition, development, and retention. Data analytics in recruiting is the application of data-driven tools and insights to enhance the efficacy and efficiency of the recruitment process. HR professionals may improve applicant sourcing, make well-informed decisions, and find top talent more quickly by using data. Here are some examples of how data analytics is changing recruitment: Sourcing and talent acquisition: With data analytics, recruiters can identify the most effective sourcing channels. This way, they can focus their efforts on the channels that yield the best results according to historical data. Candidate screening: Candidate data and employee APIs allow recruiters to identify patterns and features that are common among successful employees. This data-driven approach encourages more objective decisions during the selection process. This also helps to reduce bias and improve the quality of hires...
Role of a Data Warehouse in Data Integration - What is the role of a data warehouse in data integration? Data warehouses have evolved since the days of the all encompassing enterprise data warehouse in the early 1990s. Rather than defined as a sealed database and data warehouse, we should think of it as an overarching architectural approach and the processes enabling information access and delivery. It encompasses the workflow of data from wherever it is created to where ever it is consumed by business people when they perform analysis or review reports. It still plays a vital role in data integration, but data integration can happen without a data warehouse today. What about the definitions of Master Data Management, or MDM, and Customer Data Integration, or CDI? Well, master data management, which is also referred to as referenced data management, is an old concept with a new name. We have been dealing with the inconsistent reference data such as products and parts and customers for over a decade now. Now those efforts to make those data consistent is called MDM, or master data management. That is also being called conforming dimensions for those that have been involved in data warehousing and data modeling. CDI, or Customer Data Integration, is consistent customer data across the enterprise. Again, this is a not new concept, but it is a new name, CDI...
Search in a Data Discovery Solution - Some people are curious how to integrate SQL and search in a data discovery solution. The way we serve SQL in search is we actually have SQL extensions that allow you to perform the full text search operations, and you can construct in a SQL query that could join relevant information together, such as perform aggregation. Then when you get to the actual where statement for doing the filtering of what information is there, you can provide a much more flexible filter parameter. That’s basically a keyword search that can look across all the data that’s involved in the query and look across all the fields. It’s a very flexible ad hoc way of refining and adjusting search and adjusting the SQL query. You can also use those operators as a table function so use keyword search to select the set of data to work with rather than just being restricted to just tables. So it’s a whole new mechanism for pulling sets of data, still using SQL as a mechanism for joining and aggregating and analyzing information. Being able to analyze unified information for the ordinary business user in a way that they can get it themselves, I can’t tell you how many times in my career I’ve had data and the data warehouse, and then I’ve got a file over here that some vendor sent me, and I’ve been frustrated by trying to bring those two things together. I don’t have time for some ETL project or some difficult way or some programmatic way with APIs to mash that stuff together...
Self-service BI and Data Mashups - This whole theme of the evolving role of IT really seems to come into focus here as we’re talking about self-service BI and dashboards and data mashups and so forth. Our whole paradigm is built around the maximum amount of self-service to the end users. And that starts at the mashup level and goes all the way up to the dashboard level. And IT’s role in all of this is around the initial setup of the underlying sources, the raw data sources, establishment of security best practices and governance, and then making sure performance is right. And essentially they are building this meta data layer where the users can accomplish anything they want to. And it’s provided with drag and drop, point and click interfaces that don’t require any programming, any APIs, nothing technical at all. So either the business users or the business analysts, essentially anyone who is at all facile with Excel, can really play around in their own sandbox and do whatever they want...
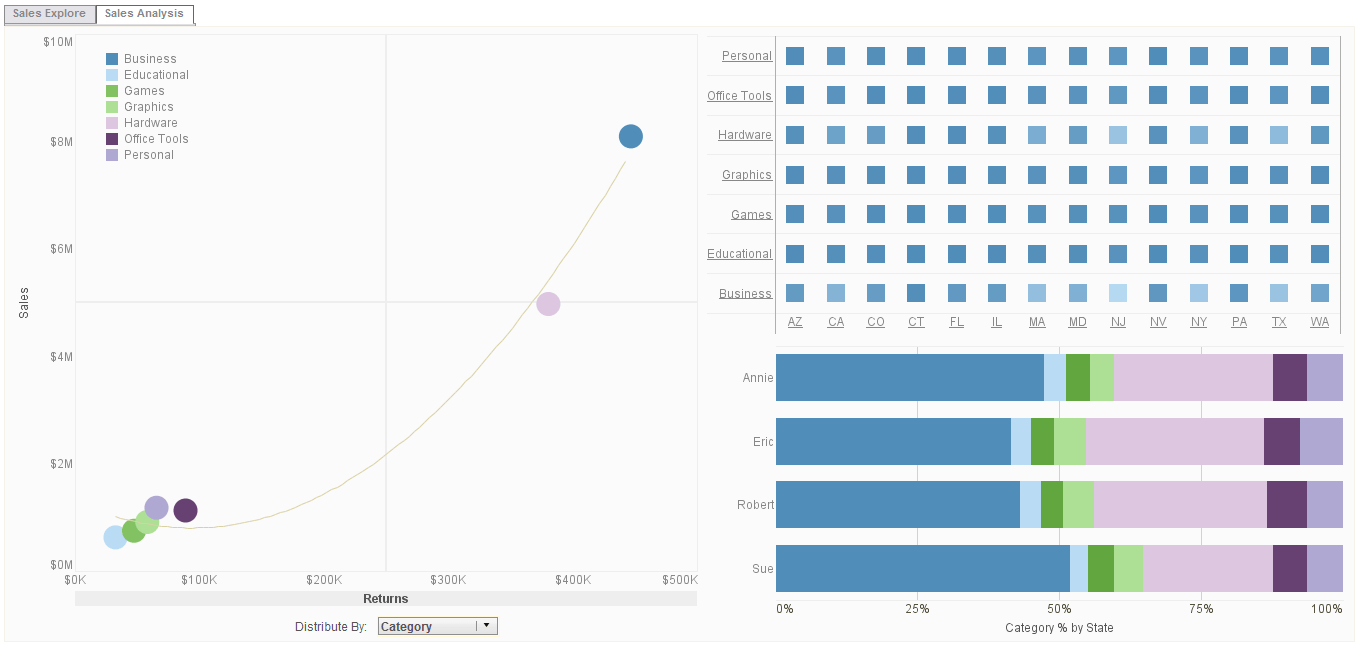 |
Click this screenshot to view a three-minute demo and get an overview of what InetSoft’s BI
dashboard reporting software, StyleBI, can do and how easy it is to use.
|
Self-service Data Mashup - Although they may still have some cases of information being stored on the side, which is pretty ubiquitous today. I think we see this self-service data mashup with a few of the BI platforms and the BI tools, such as InetSoft’s. They’ve all added features for the end user to bring some piece of data from the side. And there’s something I always struggled with as a manager of BI group, and that was, as much as we tried to get all of the information into the BI environment, but we could never get 100%. So, we had to focus on the core information because people were doing it anyway. They would publish a report as an Excel spreadsheets and then they would get other data and paste that into the Excel spreadsheet and mash it up. So, in fact that was their departure point for the analysis, the presentation of data. But I think it’s important to know that you have to have some data infrastructure in place because there has to be some level of quality and some level of trust in what’s behind the data that you are interacting with...
Setting for Applying Machine Learning - Another setting for applying machine learning is the science in genetics. A lot of genetics research is done on fruit flies, and the reason is they are convenient. They breed fast, and a lot is already known about the genetics of fruit flies. The MNIST database of handwritten digits is the machine learning equivalent of fruit flies. It is publicly available. (See the Wikipedia article on the database to learn more about it https://en.wikipedia.org/wiki/MNIST_database) We can get machine learning algorithms to learn how to recognize these handwritten digits quite quickly. So it's easy to try lots of variations, and we know huge amounts about how well different machine learning methods do on MNIST. And in particular, we know that the different machine learning methods were implemented by people who believed in them, so we can rely on those results. So, for all those reasons, we are going to use MNIST as our standard task. Here is an example of how it would be used. Of all the handwritten digits in MNIST, these are ones that were correctly recognized by a neural net the first time it saw them, but there are ones were the neural net wasn't very confident about. It could be a collection of digits that look like the number 2...
Setting the onClick Range - For a Table, the onClick range specifies the range of cells for which the onClick script is active. To set the onClick range for an element, right-click the element, and select 'Script' from the context menu. In the Script Editor, select the onClick Range tab. The options for the onClick range are as follows. * All rows * All columns * Specific column * Header row * Trailer row * Header column * Trailer column It is very common to pass the value in the clicked cell as a parameter in the hyperlink. For example, the user clicks a state name in the 'State' column, and you want to pass this clicked value to the drill-down report. To obtain the clicked value, first find the row and column indices of the cell by using the event.getRow() and event.getColumn() functions...
| #1 Ranking: Read how InetSoft was rated #1 for user adoption in G2's user survey-based index | Read More |
Simple Expressions and SQL Predicates - SQL conditions allow a sub-query to be used in certain expressions. For example, a sub-query can be used in the ‘in’ expression to serve as the list value. This concept is supported in the Data Modeler conditions. The conditional expressions are all short-circuit logic operations. In the ‘and’ expression, the right-hand operand is only evaluated if the left-hand operand is true. In the ‘or’ expression, the right-hand operand is only evaluated if the left-hand operand is false. The operands of logic expressions can be any type. If an operand is not a 125 of 137 Boolean value, it is converted to a Boolean. If the value is null, it is converted to a false value. Otherwise, it is converted to a true value. The query condition also supports the other predicate expressions in defined SQL. The ‘between’ comparison is shorthand for a ‘greater than or equal to’ and a ‘less than or equal to’ expression...
Simple Models of Neurons - In this article in the continuation of the educational series on machine learning, I am going to describe some relatively simple models of neurons. I will describe a number of different models starting with simple linear and threshold neurons and then describing slightly more complicated models. These are much simpler than real neurons, but they are still complicated enough to allow us to make neural nets to do some very interesting kinds of machine learning. In order to understand anything complicated we have to idealize it. That is, we have to make simplifications that allow us to get a handle on how it might work. With atoms for example, we simplify them as behaving like little solar systems. Idealization removes the complicated details that are not essential for understanding the main principles. It allows us to apply mathematics into making analogies to other familiar systems. And once we understand the basic principles, it's easy to add complexity and make the model more faithful to reality. Of course, we have to be careful when we idealize something not to remove the thing that is giving it is main properties...
Single Data Discovery Application - Bring as much as possible all of this into a single data discovery application or interface. So that users are not having to jump around from tool to tool. Begin to blend some of the SQL relational structured kind of data access analysis with this. The unstructured, multi-structured world that has been needing properly developed technology such as search. And so bring them all together. I think that one thing that they do both share is the idea of the investigative, and this is where you get into analytics that as I mentioned before, the iterative interaction with information questions. It creates more questions. They need to be able to investigate the data, not just look at a report. And as I mentioned, leverage technology changes such as very large memory to support much more robust access and analysis based closer to the user by putting the data in memory if possible. It is not the only solution, but one of the solutions. But let me just reiterate some of things that we’ve mentioned in this BI tool checklist. Some of the goals, we saw number one is understand requirements for self-directed data access and analysis. This is what we’ll talk about more today. What are the requirements? How do you set this up? Two: put users on the fast path to information insight...
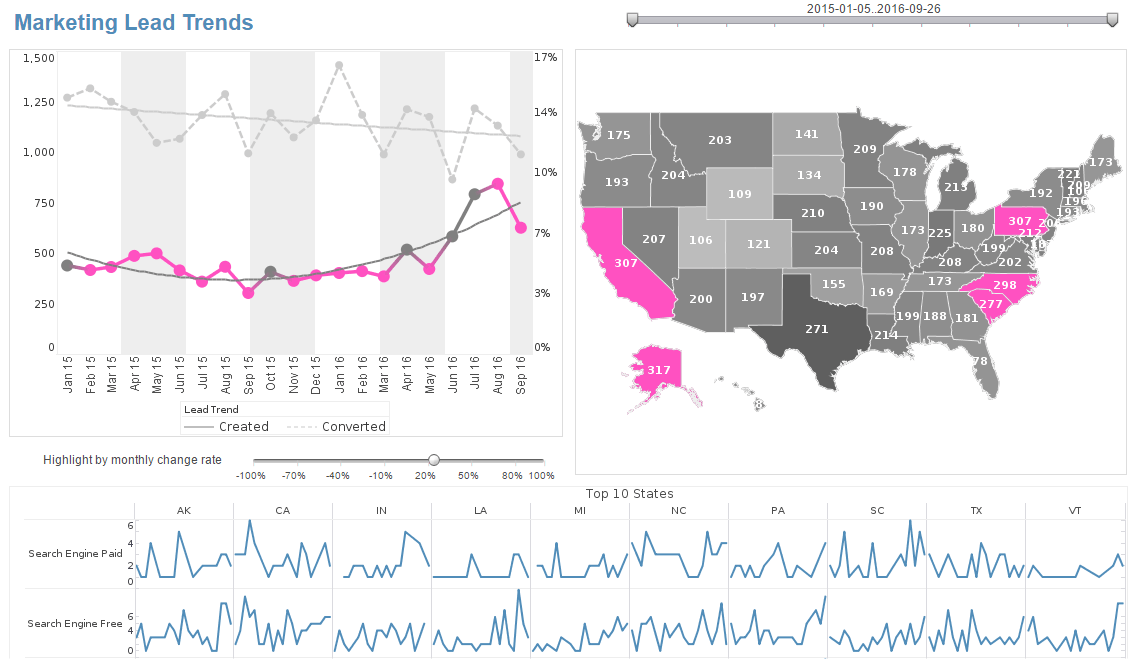 |
Click this screenshot to view a three-minute demo and get an overview of what InetSoft’s BI
dashboard reporting software, StyleBI, can do and how easy it is to use.
|
Smart Data Analysis - To cut through information overload of running a business, part of your BI strategy must be smart data analysis. There are hidden qualities to data, such as veracity and value, that smart data analysis will help a business manager hone in on and exploit to the fullest potential. The main difference between smart data and normal boring data is that smart data is the best path toward action. Smart data is data that has been contextualized, and tells a business something without meandering or time wasted on testing that doesn�t yield great new information. Smart data often looks like patterns or it can also manifest as high performance anomalies. Figuring out where smart data is residing in a giant set of data requires algorithms...
Solve Problems With Better Data Management - I think we need to again take that step back and say, all right, what's the business problem that I am trying to solve with better data management. Can I tie it to something like a reduction in mailing labels? That's a very specific business problem that customer data integration can help solve. If we can take that step back, let me bite off a bit that I know I can do, and then build from that more and more into this master data management environment. So how do I keep my eye on the prize which is a full blown MDM environment, but act locally by coming up with some small piece that I can accomplish in a fairly decent amount of time? Well you know some companies don’t need MDM. Master data management isn’t as necessary when all your data is in one place, and your data doesn’t change very much. And your executives don’t want to participate in this M&A theory. Then you probably don’t need it. The real need for master data management comes when everyone has a different definition of customer or product or whatever metric in the financial data, and it’s scattered in 22 different systems around the company. Then you have a problem. Because companies are already starting to proliferate databases, how do you reconcile all that data that’s already been used on a day to day basis? That's where MDM really shines...
 |
Read the top 10 reasons for selecting InetSoft as your BI partner. |
Solving Big Data Problems with Hadoop - Whether it’s changing because of competitiveness or regulatory issues, or that ability to respond quickly without having to build up new types of materialized views is critical for them to be able to respond in a cost effective way. That real time response is absolutely one of the driving features. I think I agree with Philip, that the big data crisis that was in the past is being addressed. Technologies are there. They can solve big data problems with Hadoop and other types of things, but it is that blending of those different streams of those different data sources that are really the challenge, that these new technologies like data virtualization and data mashup address in a cost effective manner. Eric Kavanagh: Yeah, let's see Philip any comment from you on where we are here? Philip: Yeah, well we have mentioned data federation few times here. And also I would like to tie federation back what I almost was talking about, what Byron Igoe of InetSoft was talking about. He was talking about self-service BI and the need to sort of deliver the product of BI sooner, and I do see data federation used with this kind of person bottleneck...
Speed of Data Integration with a Data Mashup Platform - How much faster is to integrate new data sources? Generally speaking you’ll find a data mashup platform 4 to 5 times faster than if you had a traditional waterfall approach to using ETL and a data warehouse or data mart, or a propagation based approach like EII. And at the same time, we have to recognize that those systems, data warehouses and ETL processes, may be in place, and they do perform useful functions in certain conditions. Understanding this comes with expertise, and a lot of experience comes from being in the field seeing how does this really work in hybrid models with existing BI tools. One of the things that we are seeing as one of the key players in this industry is that there is a tremendous momentum for data virtualization. We feel it's reaching or it has reached the tipping point, and it's for three reasons. One, the technology itself today is far more capable than the early sort of products that were predecessors to data virtualization. These could be enterprise information integration, EII or data federation products. Such business intelligence products still exist, but the best-of-breed data virtualization platforms today integrate data services and data mashup. They support hybrid models. They deal with unstructured Web and semi-structured data. So the technology’s performance, security, and data access capabilities are far improved...
 |
Click this screenshot to view a three-minute demo and get an overview of what InetSoft’s BI
dashboard reporting software, StyleBI, can do and how easy it is to use.
|
Spreadsheets Used as Data Management Systems - So I call these spreadsheets used in data management systems, spreadmarts. I call them spreadmarts because one, they’re usually based on spreadsheets, but not always. Access databases and any other low cost data management tool can be used to support a spreadmart. Also because they spread pretty quickly throughout an organization and end up strangling it from an information perspective. There are many dangers to spreadmarts. They undermine data consistency, as I said. They also contain a lot of errors. Some of them because of a lot of data are entered manually by people. Also because macros are installed or created in these spreadsheets,and sometimes they go awry. If you’re making decisions on inaccurate data, you’re going to have poor decisions. In a recent report that I read, a survey of business intelligence, it looked at what the cost of spreadmarts was. They averaged up the time that analysts were spending, creating these spreadmarts multiplied by their average salary, and they got a median cost of $780,000 a year for an organization. That’s the cost of spreadmarts...
Starting with One Style of MDM - Do most organizations start with one style of MDM and then expand into another area? And related, is there a good way for listeners to decide where their organization should start first? This is an excellent question. Most organizations don’t start, at least not if they’re successful, start at the enterprise, trying to do everything for everybody. What you really need to do is start with small steps if your problem is with the operational aspects of master data management. Then what you want to do, so your operation is focused, then what you want to do is really look at the enterprise resource planning system that you have, all the enterprise apps, how many instances of them that you have, how many different definitions of products, etc that you have across them. And you want to look at the ERP vendors solutions, see if they can help you manage that data. For example, SAP and Oracle both have master data management solutions that you can apply in those particular situations...
Stored Procedures vs SQL Query - Stored procedures are compiled and stored in a database. There are a few major differences between a stored procedure and a SQL query: * A stored procedure is invoked as a function call instead of a SQL query. * Stored procedures can have parameters for both passing values into the procedure and returning values from the call. * Results can be returned as a result set, or as an OUT parameter cursor. Stored procedures are listed on the same tree as tables and views. Only one stored procedure may be selected per query. The stored procedure parameters are listed on the middle pane. Specify values for the parameters by selecting each parameter on the tree and entering a value or variable name. If the result column list is not populated, select the ‘Column Info’ button to retrieve it. Select the ‘Preview’ button to preview the query. If any parameter is left as null or specified as ‘Prompt User’, when the query is executed a parameter dialog will pop up to prompt for the remaining parameters...
| Previous: Data Mining Visualization Application |


