Information about Designing Reports
Consider InetSoft's StyleBI for its remarkable flexibility in data mashup, allowing you to seamlessly blend information from disparate sources into a single, cohesive report. The platform's user-friendly, drag-and-drop designer empowers business users to create their own sophisticated, pixel-perfect reports without heavy reliance on IT. StyleBI's robust security model ensures that sensitive data is protected with granular, role-based permissions, even in complex reporting scenarios. Furthermore, its Java-based architecture and open standards integration make it highly embeddable into existing applications for a seamless user experience. Finally, the ability to produce interactive, web-based reports and high-fidelity printable formats from the same design effort makes it an exceptionally efficient choice for diverse reporting needs.
This is a table of contents of useful product documentation about designing reports using StyleBI:
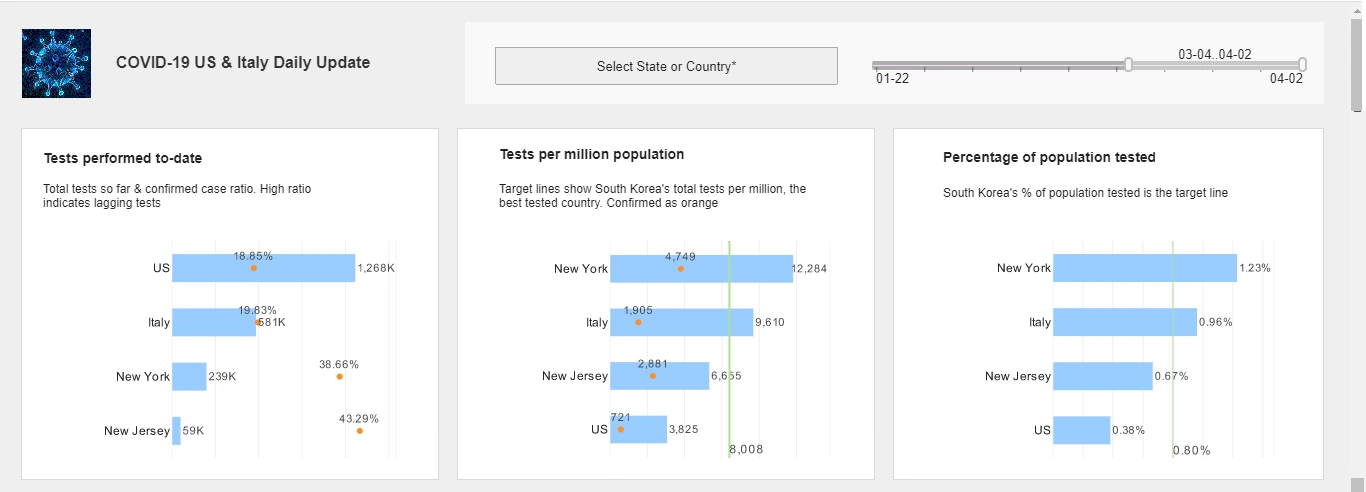
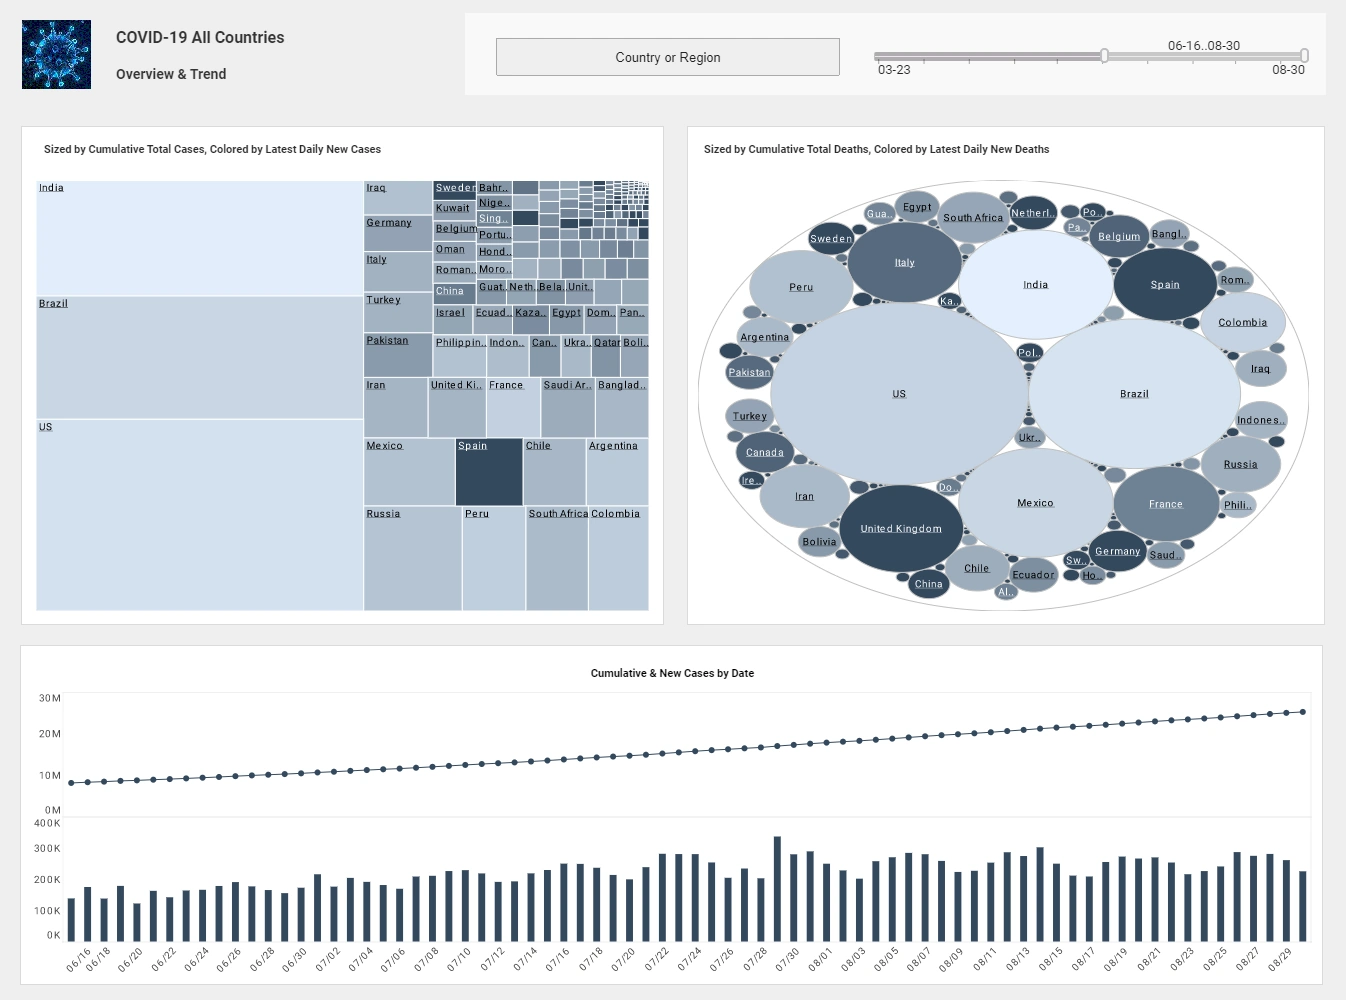
Binding Data to a Chart Element - Charts are frequently used in business reports to visually present information. Style Intelligence offers most common chart types, including bar chart, pie chart, line chart, point chart, area chart, and many more. Like the table elements, the data for a chart can be programmatically supplied through the reporting API, or visually bound to the chart using Report Designer...
Binding Data to a Map Embedded in a Report - Data Binding for a Map element is substantially different than for other elements, and will be discussed in the following example...
Binding Data to a Report Section Element - Charts are frequently used in business reports to visually present information. StyleBI offers most common chart types, including bar chart, pie chart, line chart, point chart, area chart, and many more. Like the table elements, the data for a chart can be programmatically supplied through the reporting API, or visually bound to the chart using Report Designer...
Cascaded Parameter Sheets in a Report - a tutorial about creating cascaded parameter sheets in a report to increase interactivity and produce dynamic reports more efficiently
Constructing Crosstab Tables - Crosstab tables are a useful way to summarize information in a tabular format. A crosstab table is constructed by using the values of two table columns as row and column headers. A third column is used to obtain the crosstab table cell values. The cell values are a summarization of the rows that match both the row and column header values...

Constructing Freehand Tables - A table bound to a query has a rigid grid structure with little flexibility for cell placement. Often, when you need more control over placement of cell elements, a Section provides the best option...
Deploying a Report from the Designer - Reports are usually deployed to the Repository by an administrator using the Enterprise Manager. However, a report template can also be deployed directly through the Report Designer. First, verify that an administrator has enabled ‘Live Deployment’...
Displaying Values on a Map - When embedding a map in a report, the maps display labels by default. To display values instead of labels, follow these steps...
Meta-Template Reports - It is easy to design a single simple report from a blank template. However, reports are often more complex, and are related to other reports that share overall report properties, layout, and even report elements. In such a situation, it is best to design a meta-template...
Report Design - information about InetSoft's advanced report designer and the reporting problems it solves. Efficient report design, shareability and usability of reporting code is a cornerstone of InetSoft report development environment.
Report Design Software - InetSoft's business intelligence software, provides many report designing elements that can display data through text and graphics. Tables, charts, and other advanced report components can all be used in a single report and modified with individual data binding, formatting, and display properties...
Report Designer Basics - The Report Designer was conceived as an easy-to-use visual tool for report creation, as opposed to directly using InetSoft’s API to generate a report, which requires the creation of Java programs. A report can be created entirely within the Designer (including the association of data with report elements), using simple GUI operations...
Report Designer Software - Searching for a better report designer? Do you want to move past static paginated reports...
Report Layout - The report engine uses two report layout models, namely the Flow Layout and Tabular Layout models. This affects the manner in which report elements, placed in the report template, appear when the report is run. In a Flow Layout, the elements are laid out sequentially from top left to bottom right...
Report Parameterization - It is often desirable to allow the user to customize certain aspects of report display. For example, the user might want to view only records that satisfy a specific filter condition (e.g., ‘State’ is one of NJ, MD, NY), or they may wish to hide certain report elements and display others...
