Information about InetSoft Graphical Dashboards
These pages pertain to InetSoft's graphical dashboard software:
Filtering Dashboard Operators - InetSoft's award-winning dashboard software allows users to filter dashboard operators for a truly custom interactive reporting experience. The table below lists the operators available for use in filtering conditions. Operator description equal to True when the column value identically matches the specified criterion. (String matching is case-insensitive.) in range For date fields, true when the column value (date) falls within the specified date range criterion. one of True when the column value is a member of the set of criteria values. (String matching is case-sensitive.) less than True when the column value is strictly less than the criterion value. Select the 'or equal to' check box to obtain a “less than or equal to” criterion. (Strings are compared based on their alphabetical ordering.) greater than True when the column value is strictly greater than the criterion value. Select the 'or equal to' check box to obtain a “greater than or equal to” criterion. (Strings are compared based on their alphabetical ordering...
Finance Dashboard For Tracking Key Metrics - Researching finance dashboards for tracking key metrics? Since 1996 InetSoft has been making dashboard software that is easy to deploy and easy to use. Its unique data mashup capabilities enable unified views of corporate performance and maximum self-service...
Financial Markets Trading Dashboards - The Financial Markets Trading Dashboards is an example of an interactive web-based analytical dashboard constructed using InetSoft's innovative software. A leader in business intelligence solutions, InetSoft enhances and provides organizations of all different sizes with an user-friendly BI software that features unique and powerful tools for everyday business operations...
Financial Reporting Dashboards for Tracking Key Metrics - Looking for a financial reporting tool to track key metrics? Since 1996 InetSoft has been making BI software that is easy to deploy and use. Whether you need pdf reports of financial statements or interactive dashboards to monitor finance and other corporate KPIs, InetSoft's server-based application connects to almost any data source including ERP applications such as JDE or SAP, or even Excel spreadsheets. Reports can be distributed automatically, and dashboards can be used from any browser, whether from a PC or a mobile device...
Flash Based Dashboards and Reporting - InetSoft's dashboard and reporting applications provide business users with a no-Flash, HTML5 interface that's as simple as using a web browser. Executives and analysts no longer require advanced technical abilities, and can create custom visualizations and reports in a highly interactive, self-service environment that allows for multi-dimensional and drill down analysis. InetSoft customers can be found in all parts of the world with concentrations in the Pacific Rim, India, the Middle East, Western Europe, and North America. The software can be deployed enterprise-wide and is also deployed to serve specific departments such as sales, marketing, finance, and operations...
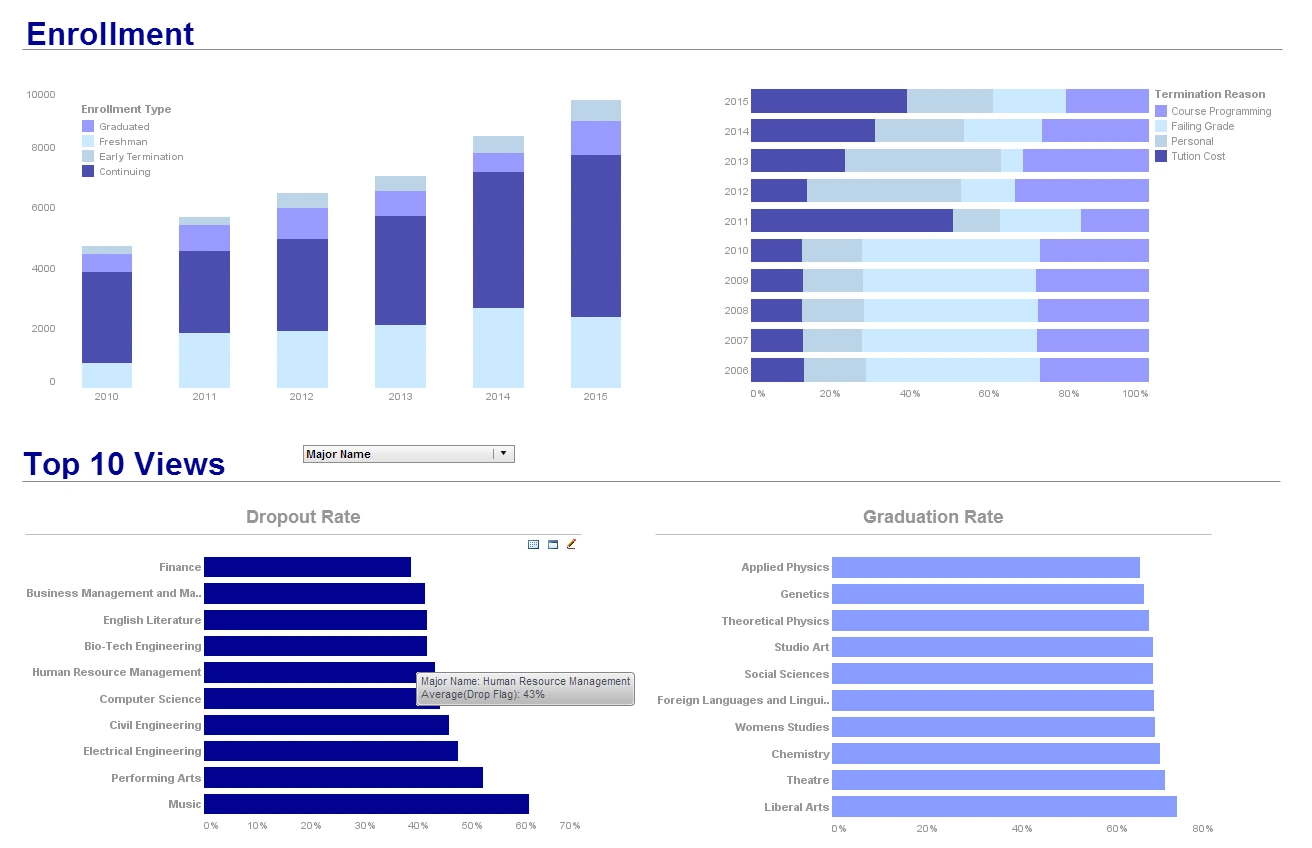
Flash Dashboard - Instead of Flash, HTML5 permits a very rich Internet application (RIA) experience that is very responsive, very customizable, and visually compelling, all things that today's business users expect and demand from their enterprise applications. InetSoft's dashboard software is 100% HTML5 for the user interface, therefore zero-client, which a major plus for deployment and maintenance for organizations of all sizes. This is an example of an interactive dashboard with several visual elements such as a speedometers and gauges. The library of available graphical display elements includes many variations of thermometers, speed dials, sliding scales, and cylinders. Just drag and drop a field onto one of these elements and the InetSoft software automatically knows to total it. They all update whenever a user filters on other fields such as date or school or region, etc. This example embeds a visual analysis chart for analyzing multi-dimensional data. With options for sizing and coloring data points, the charting software can depict 3rd and 4th dimensions of data, instead of limiting you to just two dimensions on the x and y-axes. This enables processing lots of data with just one chart and simple pointing and clicking to find outliers and correlations...
Fleet Management Companies Benefit from Reporting Dashboards - The trucking industry is one of the most competitive and profitable businesses. It is an ever-growing industry. There is so much to do in this that if you have the right strategies and technologies by your side, you can easily earn fortunes out of it. An integral part of the trucking industry is its fleet management. Vehicles are the backbone of the logistics industry. And fleet management means managing them in every way possible. Decades before, the responsibility to manage the fleet and its vehicles solely relied on the fleet managers. They used to struggle to handle several duties single-handedly and ensure operational efficiency. But not anymore. Technological advancement has changed everything. Nowadays, fleet owners can adopt a solution from fleet management companies to assist their managers in streamlining fleet activities. In this article, we will talk about how the fleet management company has changed the way the trucking industry works. And also, what is the need for investing in such solutions...

FMCG Dashboards - It can be a pain to manage all the moving pieces of your supply chain, especially when the goods at stake fall under the fast-moving commodities category. An FMCG dashboard is a real-time analytical tool that assists in meeting financial objectives by taking into consideration the unique requirements of popular fast-moving consumer items like food and beverages. It helps to satisfy high demand, improve purchasing and selling tactics, and cover shortages.Well over half of all consumer expenditure goes into fast-moving consumer goods (FMCGs), which include snacks, soft drinks, cleaning supplies, and cosmetics. As a result, FMCG companies must keep track of a vast array of KPIs, including those specific to each product, market, and even store location. FMCG businesses also look at the supply chain that moves their products from the raw ingredients to the retailer to spot inefficiencies, expenses, and other problems. Metrics including stock levels for each store, typical time to sell, product margins, shelf exposure and availability, delivery costs, fulfillment statistics, brand preference versus competitors, as well as sustainability data are frequently included in FMCG KPIs...
Food Safety Dashboard Software - Big data analytics are becoming a larger part of everyday life. Many organizations are eager to get insight into their development trends, to understand the bigger picture of their industry and make better decisions. In the past years, food poisoning in restaurants has been one of the hottest concerns. Also, with the ongoing pandemic, more and more people begin to pay more attention to health and safety problems...
Formatting Dashboards - Formatting a dashboard doesn't have to be as difficult as it sounds. InetSoft's products all feature tried and tested intuitive controls. See how formatting a dashboard is as easy as snapping together your childhood legos. Certain components have multiple regions that can be selected and formatted independently. For example, a component title bar can always be formatted independently of the component body. To format a particular region of a component, right-click on the desired region, and select ‘Format’ from the context menu. To format the general component (rather than a particular region), first make sure the component is entirely deselected. Then right-click to select the general component (not a region), and choose ‘Format’ from the context menu. The ‘Format’ dialog box contains the following tabs: 1. The Format tab allows you to specify a data format. Formatting is available for the following data types: Date, Number, Currency, Text, Percent. 2. The Alignment tab settings determine the horizontal and vertical alignment of component text. 3. The Font tab allows you to specify the font face (Arial, Serif etc.), the style (bold, italic), and the size of the font used for component text. 4. The Border tab allows you to set border thickness and color for components...
Free Dashboard Software - If you're looking for free dashboard software to set up shareable executive and monitoring dashboards, try Style Scope Free Edition. Derived from our commercial business intelligence software, this free dashboard application is designed to be very intuitive and interactive. StyleBI Free Edition is a small-footprint server that delivers Web-based interactive Flash dashboards and visualizations that can be shared within an organization. The Java-based application can be installed on any Windows, Unix, or Mac desktop and can be connected to data in standard relational databases as well as spreadsheets. The kinds of dashboards that can be created range from monitoring and executive dashboards to sophisticated interactive visual analysis and business management dashboards...