How an Industrial Gas Manufacturer Upgraded from Jedox to InetSoft for Reporting Dashboards
Industrial gas manufacturing is a complex, data-intensive industry that depends on precision, reliability, and real-time visibility. From managing production plants to coordinating global distribution networks, every decision relies on accurate and timely data. For one industrial gas manufacturer, legacy reporting tools were no longer keeping pace with operational demands. After years of relying on Jedox for reporting and planning, the organization made the strategic decision to upgrade to InetSoft to modernize its reporting dashboards and unlock greater agility across the business.
The Challenge: Static Reporting in a Dynamic Environment
The manufacturer operated multiple production facilities producing oxygen, nitrogen, and specialty gases for industries ranging from healthcare to semiconductor manufacturing. Each facility generated massive volumes of operational data, including pressure levels, purity metrics, production output, and equipment performance.
Jedox had served as the company’s reporting solution for financial planning and periodic reporting. However, as operational complexity grew, several limitations became increasingly apparent:
- Limited interactivity: Reports were largely static, requiring users to request new versions or exports to analyze different scenarios.
- Slow data refresh cycles: Operational data was often delayed, preventing real-time decision-making.
- Fragmented data sources: Integrating plant data, logistics systems, and ERP information required manual processes and data preparation.
- High dependency on IT: Business users relied heavily on developers to modify reports or create new dashboards.
These challenges created bottlenecks across the organization. Plant managers lacked immediate insight into production anomalies. Supply chain teams struggled to optimize delivery routes based on current demand. Executives received reports that were already outdated by the time they were reviewed.

The Need for a Modern Reporting Platform
The company recognized that its reporting system needed to evolve from static outputs to a dynamic, interactive analytics environment. The ideal solution would:
- Provide real-time visibility into production and distribution metrics
- Enable users to explore data independently through interactive dashboards
- Integrate seamlessly with multiple data sources without heavy ETL processes
- Scale across global operations and support growing data volumes
- Reduce reliance on IT for report creation and customization
After evaluating several options, the organization selected InetSoft for its flexibility, performance, and strong support for embedded and interactive reporting.
The Transition to InetSoft
The migration from Jedox to InetSoft was approached in phases to minimize disruption. The initial focus was on high-impact operational dashboards used by plant managers and supply chain teams.
InetSoft’s ability to mash up data from multiple sources proved critical during implementation. Data from SCADA systems, ERP platforms, and logistics applications was combined into unified datasets without requiring extensive data warehousing changes. This allowed the company to accelerate deployment while maintaining data accuracy.
Developers leveraged InetSoft’s API and web-based integration capabilities to embed dashboards directly into existing operational portals. This ensured that users could access analytics within their daily workflows rather than switching between systems.
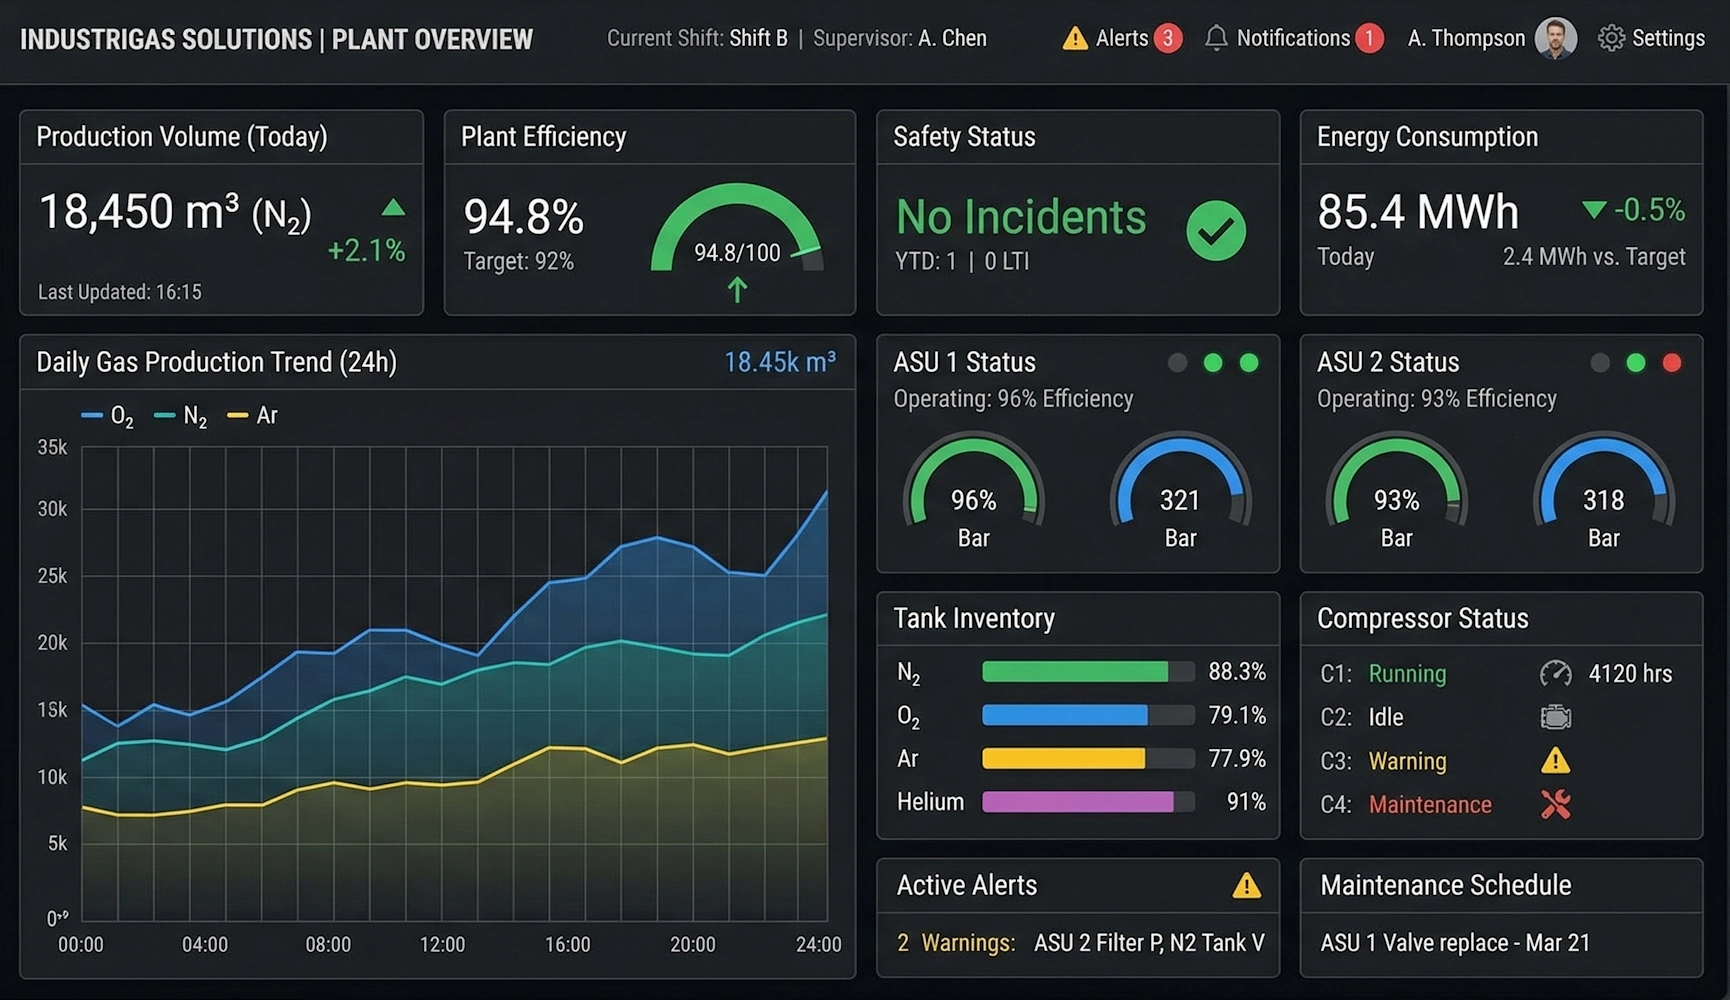
Real-Time Operational Visibility
One of the most immediate benefits of the upgrade was real-time visibility into production metrics. InetSoft dashboards displayed live data on plant performance, including:
- Gas purity levels across production lines
- Equipment utilization and maintenance status
- Production output versus targets
- Energy consumption and efficiency metrics
Plant managers could quickly identify anomalies, drill down into specific data points, and take corrective action without delay. This reduced downtime and improved overall operational efficiency.
Enhanced Supply Chain Optimization
The company’s distribution network required precise coordination to deliver gases safely and efficiently. InetSoft dashboards provided supply chain teams with real-time insights into inventory levels, delivery schedules, and customer demand.
Interactive features allowed users to filter data by region, product type, or customer segment. This enabled more accurate demand forecasting and route optimization, reducing transportation costs and improving service levels.

Empowering Business Users
A major shift came in how business users interacted with data. With InetSoft’s self-service capabilities, users could create their own dashboards, customize visualizations, and explore data without relying on IT teams.
This empowerment led to faster decision-making and greater innovation. Teams began uncovering insights that were previously hidden within static reports, such as correlations between production variables and equipment performance.
Improved Executive Reporting
Executives gained access to high-level dashboards that aggregated data from across the organization. These dashboards provided a comprehensive view of key performance indicators, including production efficiency, revenue trends, and operational risks.
Unlike static reports, these dashboards were interactive and always up to date. Executives could drill down into specific regions or facilities, enabling more informed strategic decisions.
Performance and Scalability Gains
InetSoft’s architecture delivered significant performance improvements compared to the previous system. Data caching and optimized query processing ensured that dashboards loaded quickly, even when handling large datasets.
As the company expanded its operations, the platform scaled seamlessly to accommodate additional data sources and users. This scalability ensured that the reporting system would continue to meet future needs.
Reduced IT Burden
By shifting to a more user-friendly and flexible platform, the organization reduced its reliance on IT for routine reporting tasks. Developers could focus on higher-value initiatives, while business users handled their own analytics needs.
This change improved overall efficiency and allowed the IT team to support innovation rather than maintenance.
Measurable Business Impact
The transition to InetSoft delivered tangible benefits across the organization:
- Faster decision-making through real-time data access
- Reduced operational downtime due to improved monitoring
- Lower transportation costs through optimized logistics
- Increased user satisfaction with interactive dashboards
- Enhanced scalability to support future growth
These improvements reinforced the value of investing in a modern reporting platform that aligns with the demands of a data-driven industry.
Upgrading from Jedox to InetSoft transformed reporting dashboards from static, reactive tools into dynamic, proactive systems that drive operational excellence. For industrial gas manufacturers operating in complex, high-stakes environments, this shift provides a competitive advantage by enabling faster insights, better decisions, and more efficient operations across the entire value chain.

Related Articles About Reporting Dashboards
Report Creation Tool - Looking for good report creation tools? InetSoft's pioneering reporting application is easy to use and powerful enough for production reporting. View a demo and try interactive examples...
Report Generation - Servlet Configuration - Configuration of servlets is dependent on the Web server and servlet engine. It normally involves the following steps: 1. Add the InetSoft JAR files to the CLASSPATH of the servlet engine. 2. Register a servlet with the server. The servlet class name is inetsoft.report.web.PDFService. 3. Possibly assign an alias for the servlet. The alias is then used to form a URL that refers to the servlet. The PDF servlet requires a few initialization parameters. The parameters must be specified when configuring the servlet in the web server. For details on how to specify initialization parameters, please refer to the web server documentation...
Report Generation - InetSoft's Style Intelligence makes it easy for non technical users by making report generation a simple process that requires minimal expertise or administrative assistance. View the information below to learn more about this powerful reporting software. When reports are being generated by the engine, they are placed in a queue. As an administrator, you can control when the completed reports will exit this queue. The completed reports can be removed after a specific number of hours or when the total number of reports in the queue exceeds a certain threshold value. These properties can be set using the 'Monitoring' > 'Queued Report' page under the Server tab. The 'Viewsheets' page under the 'Monitoring' node provides key information about executing Viewsheets that are currently being processed by the server, as well as open Viewsheets that are active in memory but are not currently being processed. In a clustered environment, select a machine from 'Cluster Node' menu to view the monitoring statistics for that machine...
Report Graphic Elements - The graphic elements in InetSoft's report software offer the most complete visual toolkit available in a commercial BI application. You can add new elements from the left pane by dragging them into the layout on the right. You can change the position and size of elements on the right by selecting them, then dragging the element or its resize handles. You can also modify the properties of elements in the layout by selecting them, right-clicking, and choosing ‘Properties’. For text elements that are bound to data, the ‘Column’ control at the bottom displays the current binding field, and allows you to choose an alternate binding. For text elements that display static text, the ‘Text’ control at the bottom allows you to modify the text contents. Properties include font, color, alignment, format, contents, and (TextBox only) borders. You can upload an image, and set its size. You can change the style of the Separator...
Report Handlers - The current chapter explains how you can use various report handlers to implement advanced business logic. This includes adding actions to report elements, and modifying report generation based on user input or the runtime environment. The current chapter explains how you can use various report handlers to implement advanced business logic. This includes adding actions to report elements, and modifying report generation based on user input or the runtime environment. An element's onClick handler is executed when a “selection” event (i.e., mouse click) takes place on the element. You can use the onClick handler to implement interactions such as hyperlinks and drilldowns, or to initiate any other business logic in response to user selections. To access the onClick handler for an element, right-click the element, and select 'Script' from the context menu. Then select the onClick tab at the top of the Script Editor. Because the handler does not execute on the client browser, it cannot perform client-side actions directly. Instead, the handler controls the behavior of the report by returning one of the pre-defined viewer actions. Actions related to hyperlinks are showReplet() and showURL(). Other viewer actions are discussed in a later chapter...
Report Image Search Archive Properties - Report image search archive properties are entirely customizable in InetSoft's reporting software - an agile platform that allows for quick modifications. Image properties include specifications relating to the representation of images in the Portal. PNG or JPEG. PNG can only be used with version 4.0 or newer browsers. Generally PNG results in an image with a smaller file size, and better quality than JPEG. Default is false (recommended). Turns PNG compression on or off. This property is ignored if JPEG images are used. PNG images are antialiased by default when using j2d. Set this property to false to turn off antialias. (Antialias gets rid of “jaggies”). When generating html, images are converted to jpeg using a resizing ratio of 1.0. This sometimes causes the image to be distorted. This default can be changed by setting this property. When generating html, images are converted to jpeg using a resizing ratio of 1.0. This sometimes causes the image to be distorted. This default can be changed by setting this property...

Report Log and PDF Properties - Report Log and PDF properties can be adapated to suit custom needs with InetSoft's reporting software - a robust platform that allows for localization. Please see section 'Advanced Log Configuration'. For customizing log detail levels and log message formats. PDF properties include specifications relating to reports generated in PDF format. See PDF Generation for related properties in Enterprise Manager. This is mostly used when the font width information is different between Java and PDF. The ratio can be used to adjust the spacing so that the generated PDF matches the actual font size used in PDF viewers. It is a list of semi-colon separated ratios. Each ratio is specified by a font name and, optionally, a font style, followed by the ratio, e.g., MS Hei:1.1;Algerian-bolditalic:1.02...
Report Log Configuration - Configuring the report log is easy with InetSoft's StyleBI, a powerful business intelligence platform that allows users to make custom changes. View the example below to learn more about this powerful reporting software solution. Enterprise Manager provides the ability to log messages generated during server execution. Logged messages are appended to a text file (sree.log, by default) and optionally sent to “stderr.” Click 'Send Log' to email the log contents to the address specified in the 'Send Log To' field of the 'Log Configuration' page. From the Enterprise Manager, you can administer the log file by selecting 'Log' > 'Log Configuration' on the navigation tree under the Server tab. You can change the amount of detail that appears in the log file by editing the 'Log Detail Level' value on the 'Log Configuration' page. There are five detail levels defined. It is recommended that you set the detail level to 'Warning' or higher. As of version 10.2 logging in InetSoft is implemented using the standard Java Logging API of the java.util.logging package...

Report Look and Feel - InetSoft's visualization driven reporting software is loaded with dynamic options that allows executives to customize the report look and feel for a visually appealing experience. The global look-and-feel can be set for the entire Portal using this page. The look-and-feel consists of the properties discussed below. It is also possible to control the look-and-feel of the Portal page via a CSS file. Color Scheme The five color schemes are Blue, Green, Alloy, Orange, and Vista. The color scheme controls the default colors used on the Portal, report buttons, and any popup windows. Tab Style The 'Tab Style' property controls the tabs used on the Portal title bar. The options available are: Simple, Aqua, Windows, and Text. The 'Report List' property controls the Portal's Repository style. The default is 'Tree', which displays Repository folders and reports in an hierarchical structure. The 'Expand All Nodes' option pre-expands all of the folders in the Repository tree. The 'List' option displays Repository folders and reports as a flat list using the entire page...
Report Maker Online - Are you looking for an online report maker to track business performance? InetSoft's online report maker is the ideal tool for users wanting to track their KPI's remotely without having to rely on specialized IT professionals and endless hours of setup. Whether it's installed on your local desktop, in the cloud, or on a server at your company's local intranet, this online report maker allows users to access their reports through a web browser...
Report Making Software - As your business grows, so does your need for report making software that will automate business monitoring and management. Better sales numbers, more salespeople, more clients and accounts to manage also means more products to ship and track, more employee information to file, and more daily variables to react to. That's why InetSoft designed the easy to use report making software, StyleBI. In addition to web-based interactive dashboards, StyleBI also contains a powerful reporting engine...
Report Migration - With the introduction of the Crystal Migrator, developers can now take advantage of the latest technologies while tying in components based on pre-existing legacy systems. It has long been known that traditional report writers have been tightly integrated with respect to relational databases. While for some the effects of this integration may go unseen, for others it is a limitation that cannot be overcome. As technology evolves, the paradigm for data integration has shifted to include querying data from all different types of objects with embedded business logic. This naturally catapults the Style Report™ software suite to the top of the reporting industry as the company's record indicates a strong dedication to using open standard based technologies while also incorporating support for new cutting edge technology. The Crystal Migrator now enables report writers to neatly integrate legacy based systems into a very dynamic environment whereby new business logic can be tightly integrated, thus taking advantage of the newest technologies and cutting down the costs associated with migrating from one system to another...
Report Monitoring Summaries - InetSoft's StyleBI provides report monitoring summaries that allow administrators to make simple modifications in order to improve performance. The 'Summary' page under the 'Monitoring' node provides a set of monitoring charts that help you track server performance. In a clustered environment, select a machine from 'Cluster Node' menu to view the monitoring statistics for that machine. Click on a chart to view the detailed information provided by the corresponding page under the 'Monitoring' node. The following information is available. The 'Level' column indicates the monitoring level required for the feature. Because StyleBI monitoring features are based on Java's managed bean name (Mbean) technology, you can access monitoring information from a remote computer. To configure remote access, open the 'MBean' page under 'Server' node. The 'Requests' page under the 'Monitoring' node provides key information about requests of various kinds that are being sent to the server: Report, Viewsheet, Visual Composer, Ad Hoc. In a clustered environment, select a machine from 'Cluster Node' menu to view the monitoring statistics for that machine. The page provides the following information...
Report Objects - The Element object is the base object of all other report objects. All other objects share its methods and properties. This section lists general properties of the Element object. Field returns the current value bound to an element within a Section. The field property uses the name of the bound data field (rather than the element's ID) to refer to the element's value. If the element that references the field array is not within a Section, then the field property is undefined. Modifications to the field array have no effect on elements. The field array provides read-only access to the values of all bound elements in the current band/row, and is accessible from every element inside the band. The field array provides the original data bound to the element, not the string representation provide by the Text Property. Therefor, if a column has type Date, the field array returns a Date object...