InetSoft Product Examples of Good Reporting Design
Nowadays reporting means interactive visualizations not paginated reports.
Fundraising Dashboard
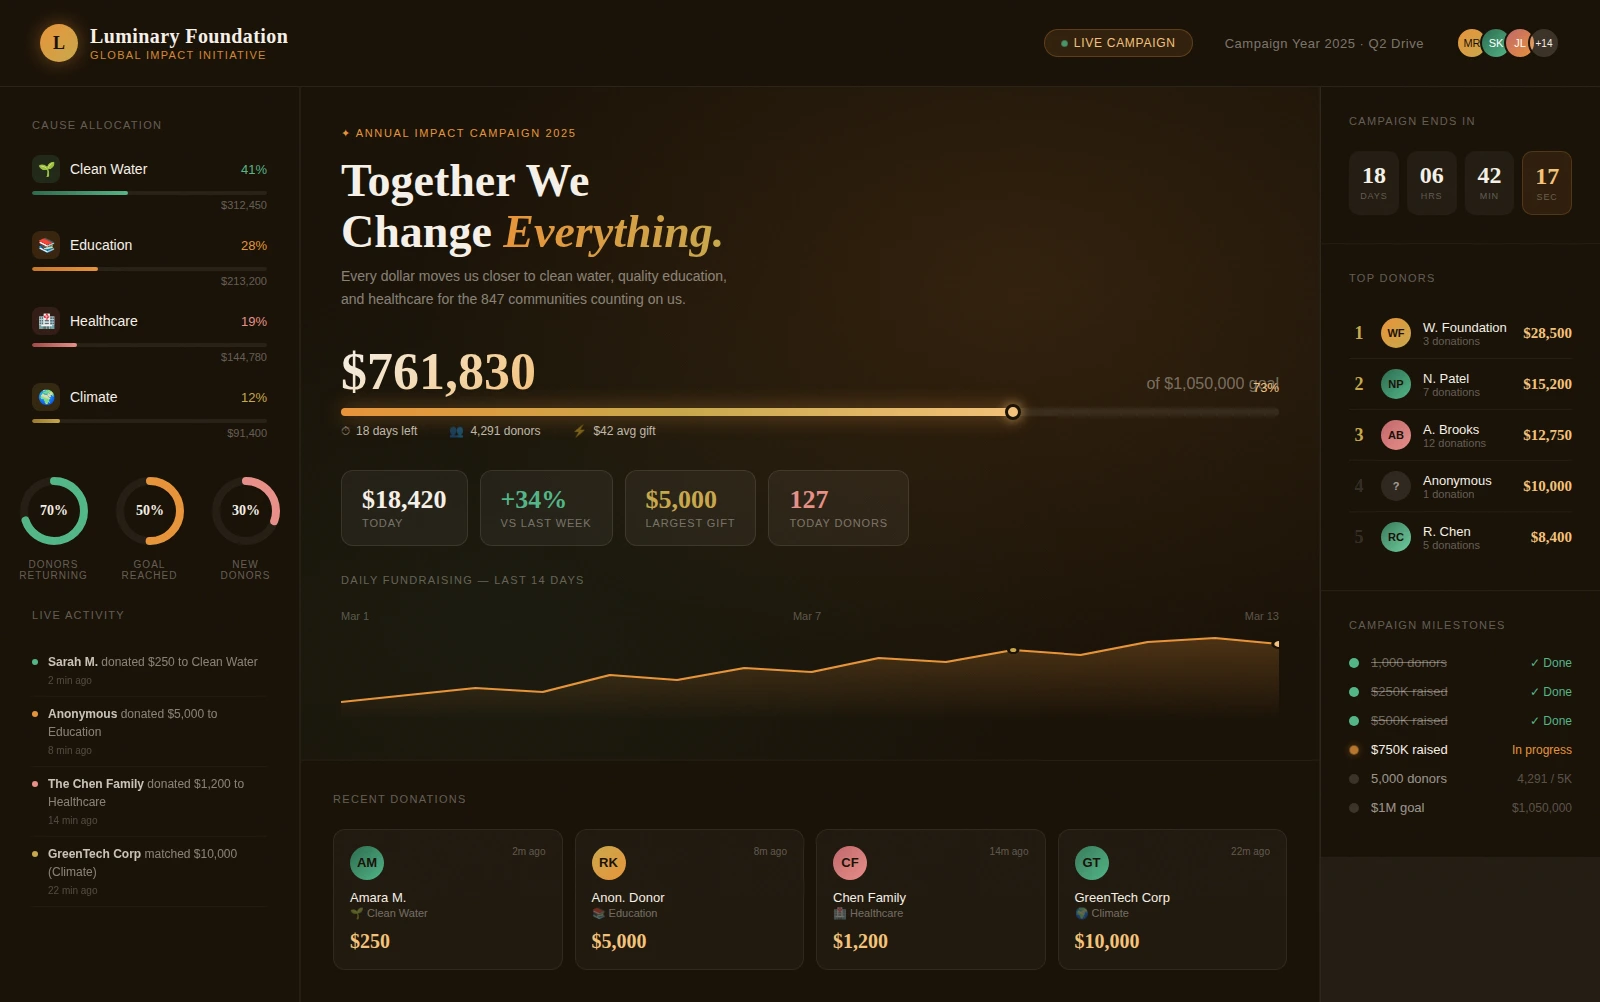
This dashboard highlights donation trends, campaign progress, and donor segmentation in one place. It helps nonprofit teams quickly identify which channels drive the strongest results. The design supports faster planning for upcoming appeals and stewardship efforts.
Lumber Harvesting Dashboard
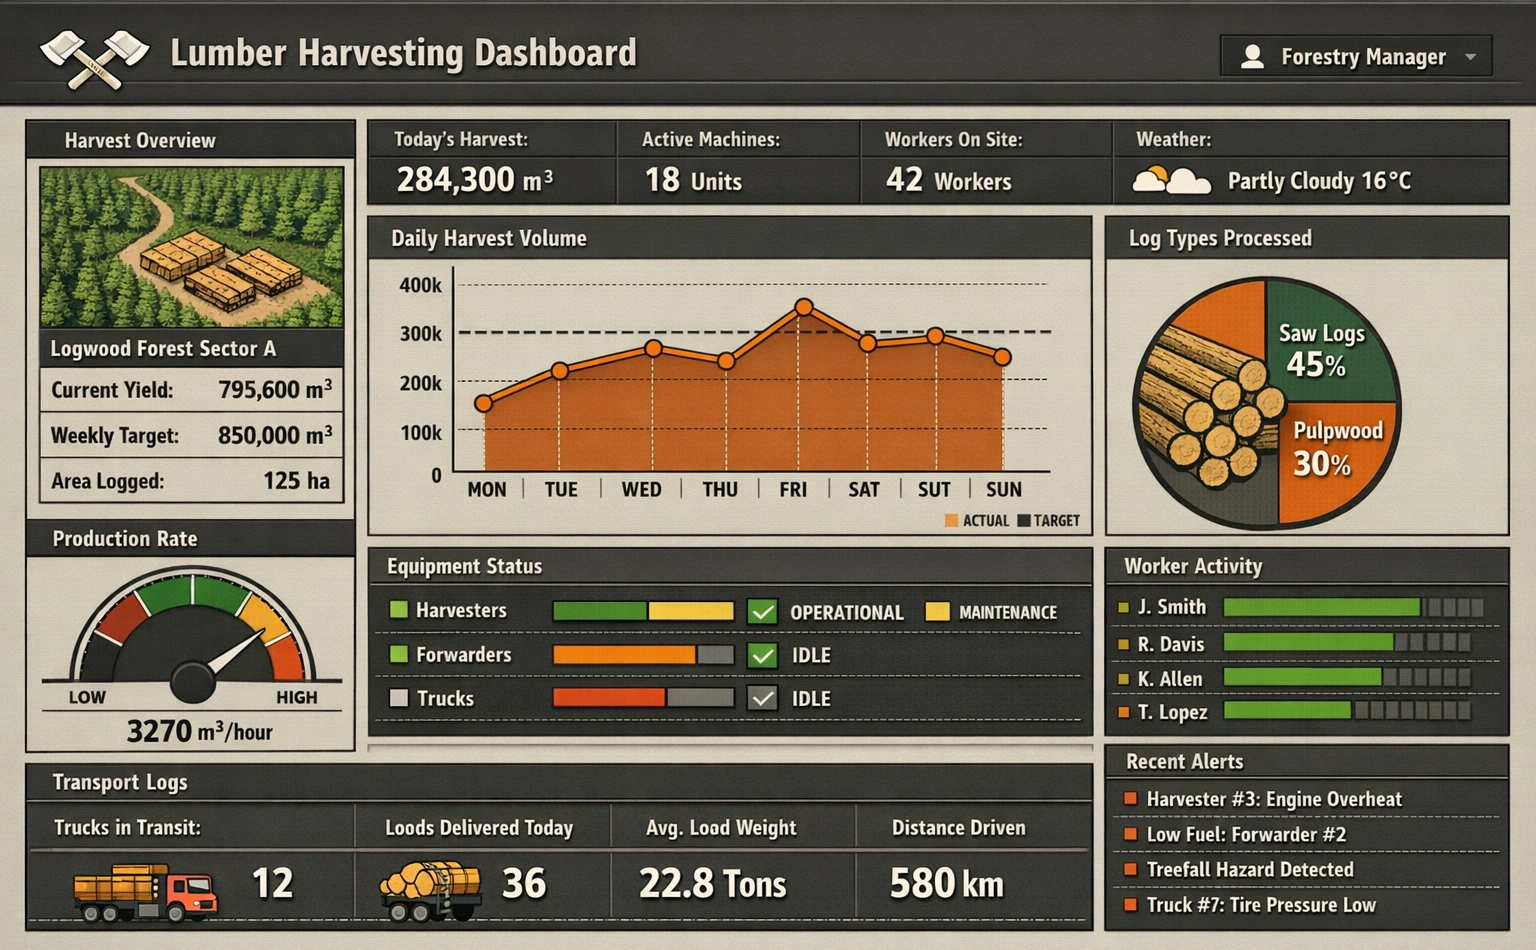
This dashboard tracks harvest volume, yield efficiency, and site-level operational status. It gives managers clear visibility into production bottlenecks and resource utilization. The layout makes it easier to balance output goals with sustainability targets.
Dairy Farming Dashboard
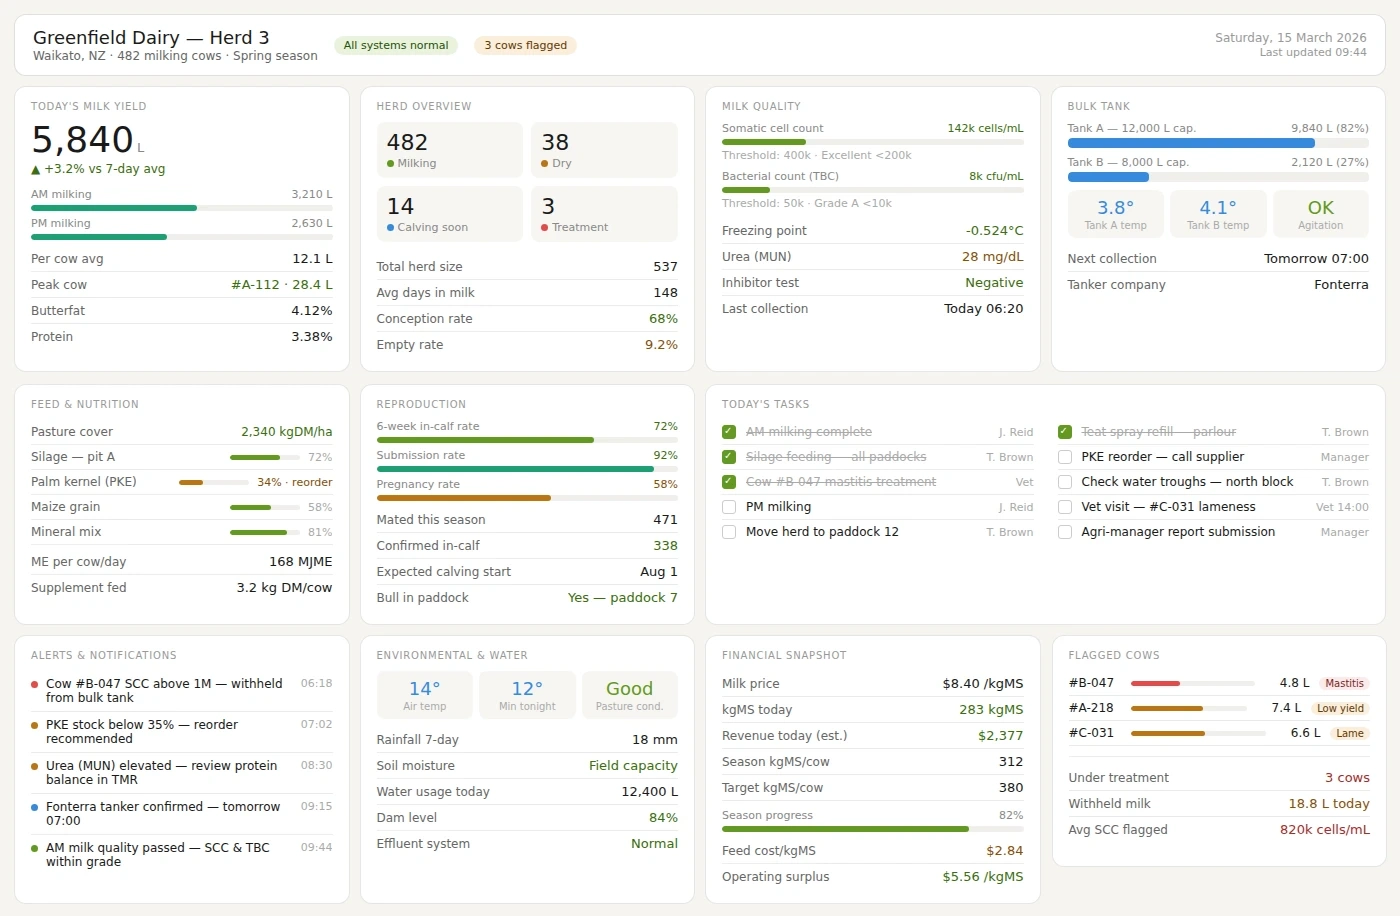
This dashboard presents milk production, herd health, and feed efficiency metrics together. It helps farm operators detect performance shifts before they become costly problems. The design enables daily decision-making with a simple, actionable visual flow.
Gold Mining Dashboard
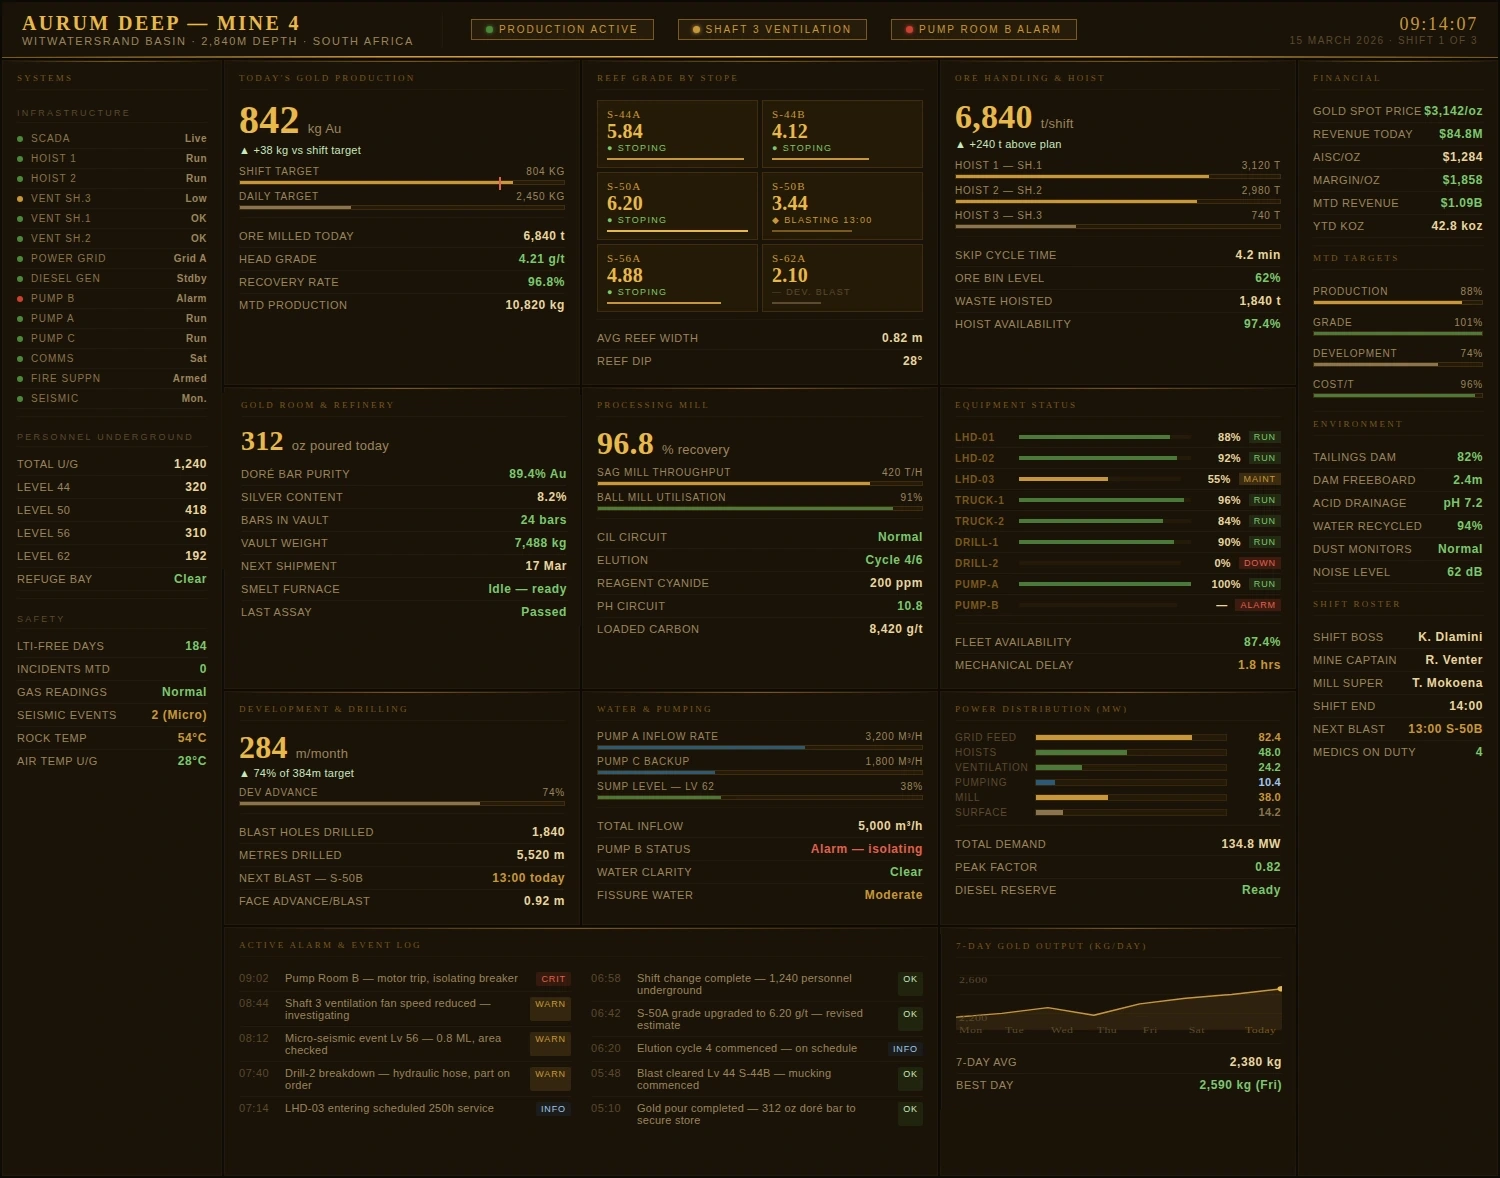
This dashboard combines extraction rates, site safety indicators, and equipment performance. It helps operations teams compare productivity across mines and shifts. The visual structure supports rapid response to risk and downtime.
Canal Operations Dashboard
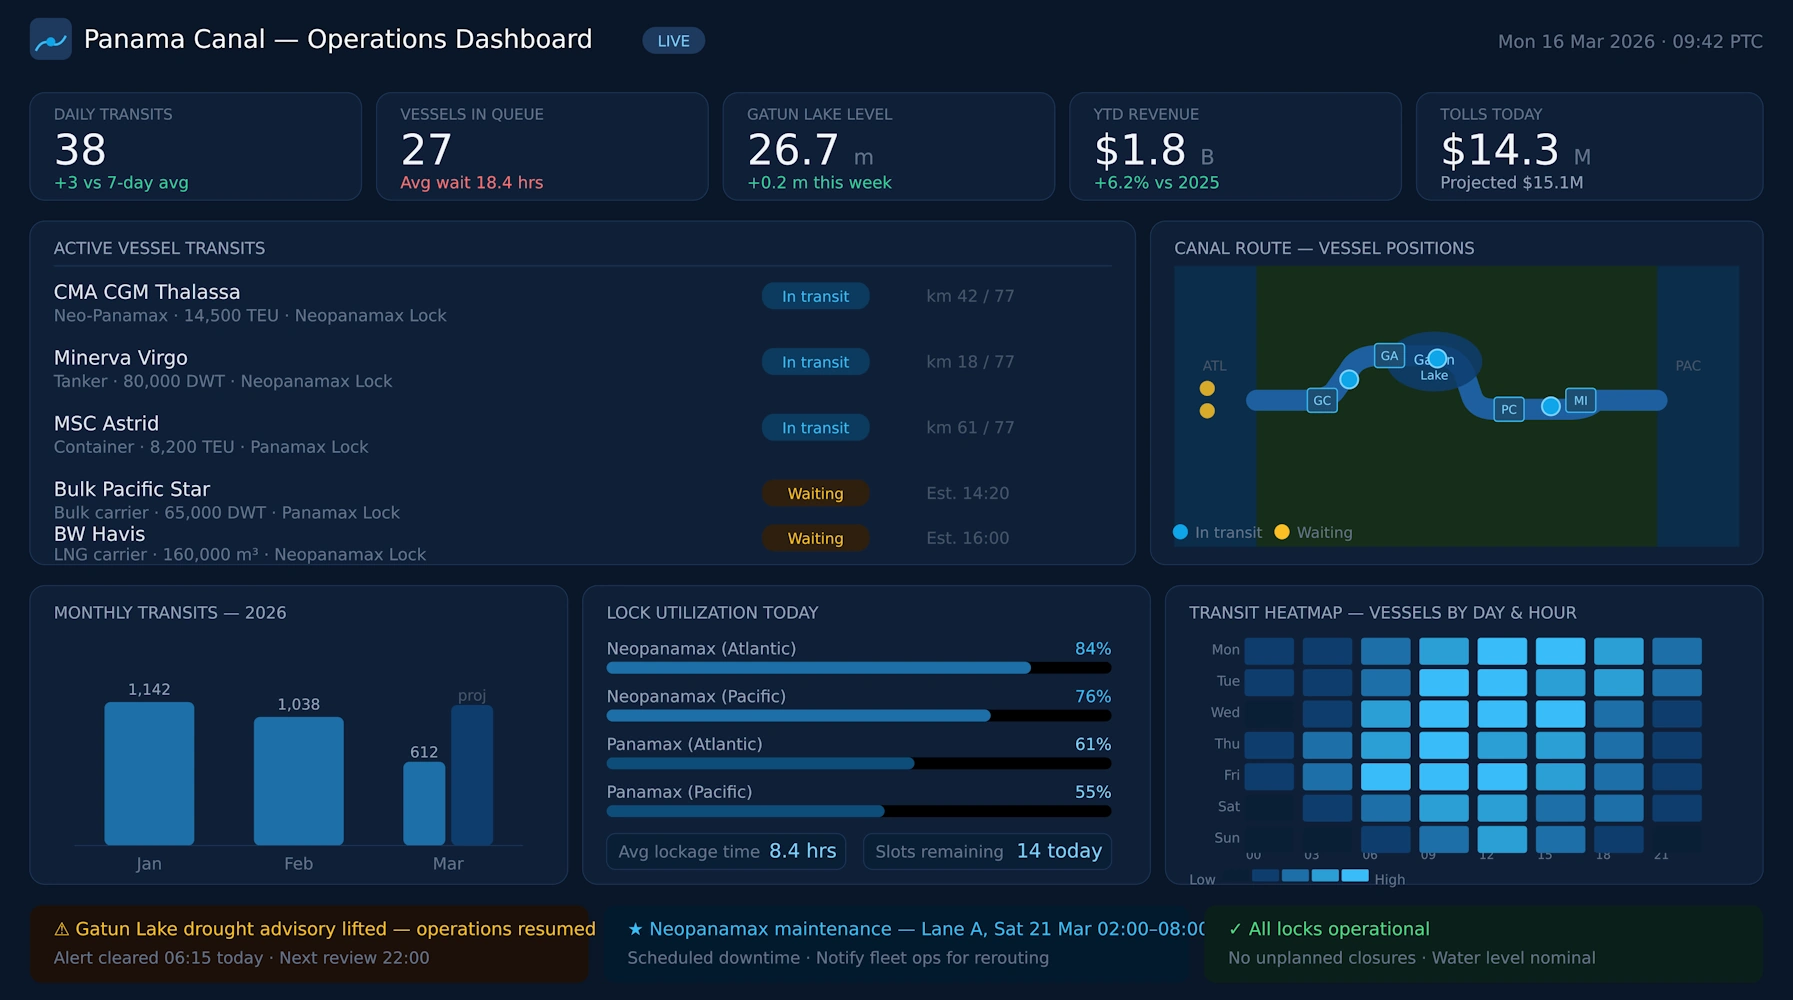
This dashboard monitors vessel traffic, transit timing, and lock utilization patterns. It provides operators with a real-time view of congestion and throughput. The design helps improve scheduling and reduce operational delays.
Ski Resort Dashboard
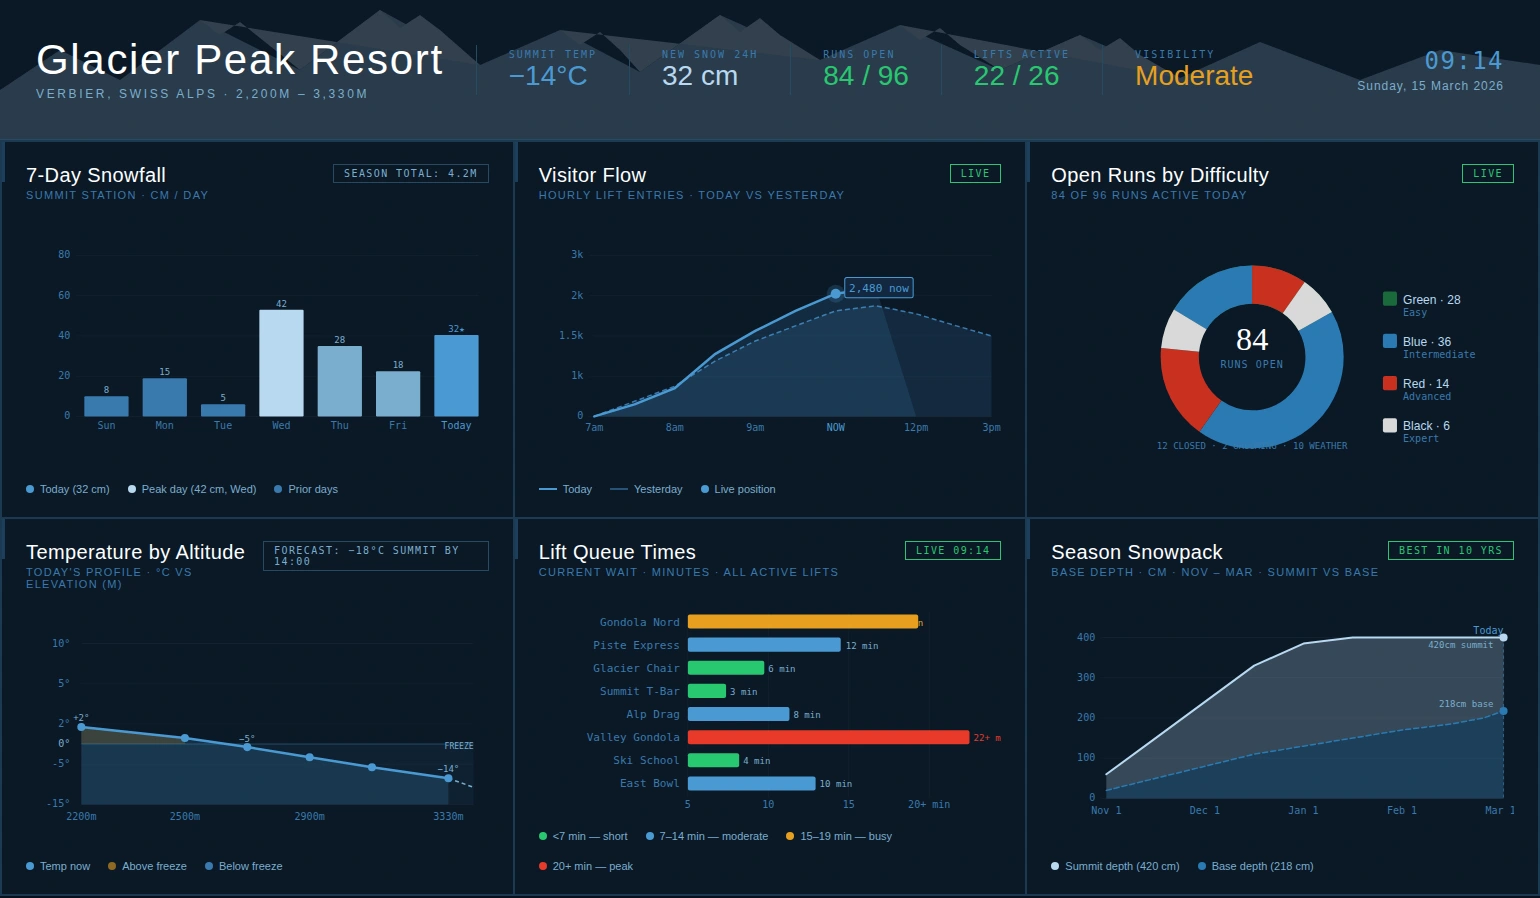
This dashboard summarizes lift activity, weather effects, and guest demand across the resort. It helps leadership align staffing and services with changing conditions. The layout supports better planning for both peak periods and off-hours.
News Publishing Dashboard
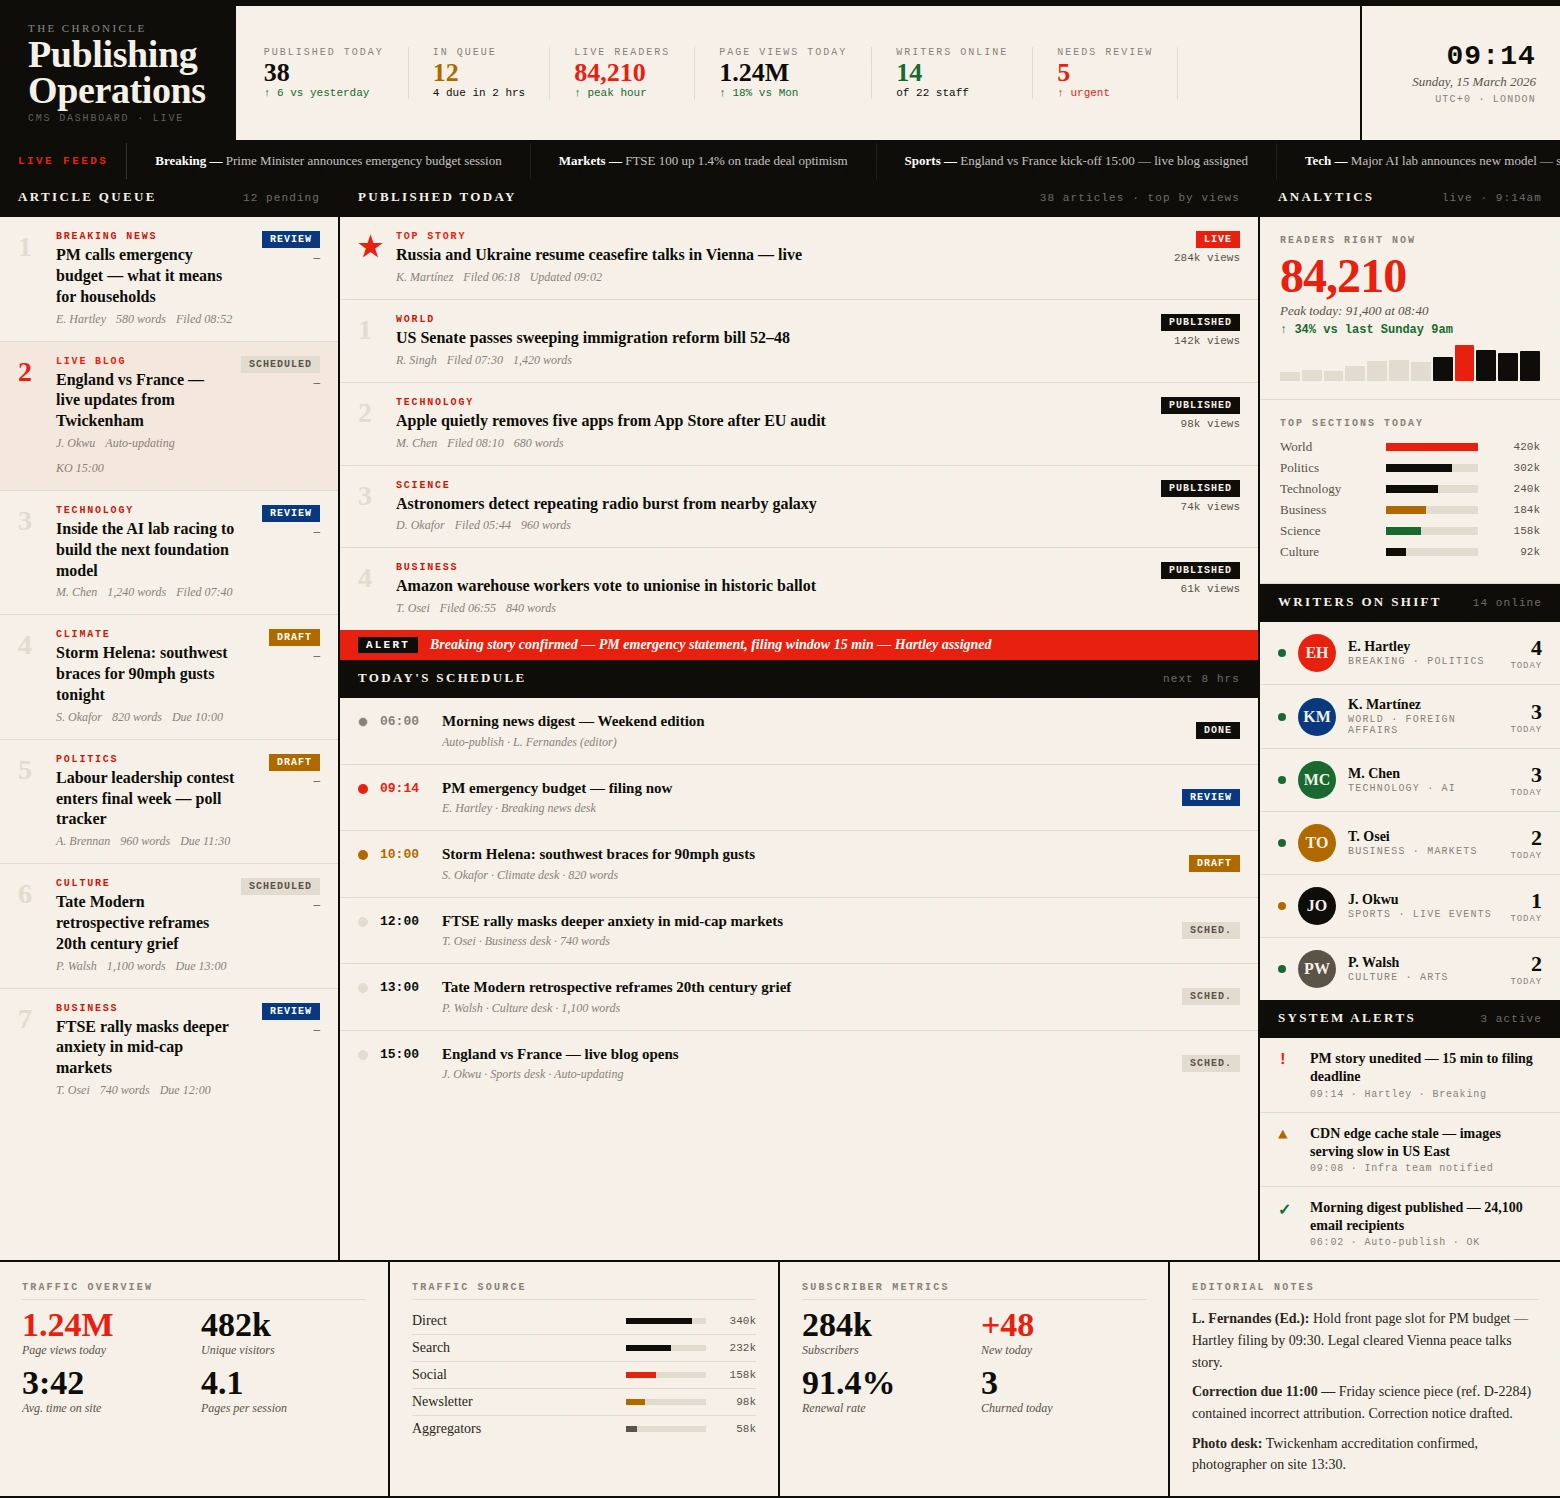
This dashboard displays audience engagement, content velocity, and channel performance. It helps editorial teams understand which stories create the most impact. The design supports faster publishing decisions backed by live data.
Formula 1 Race Dashboard
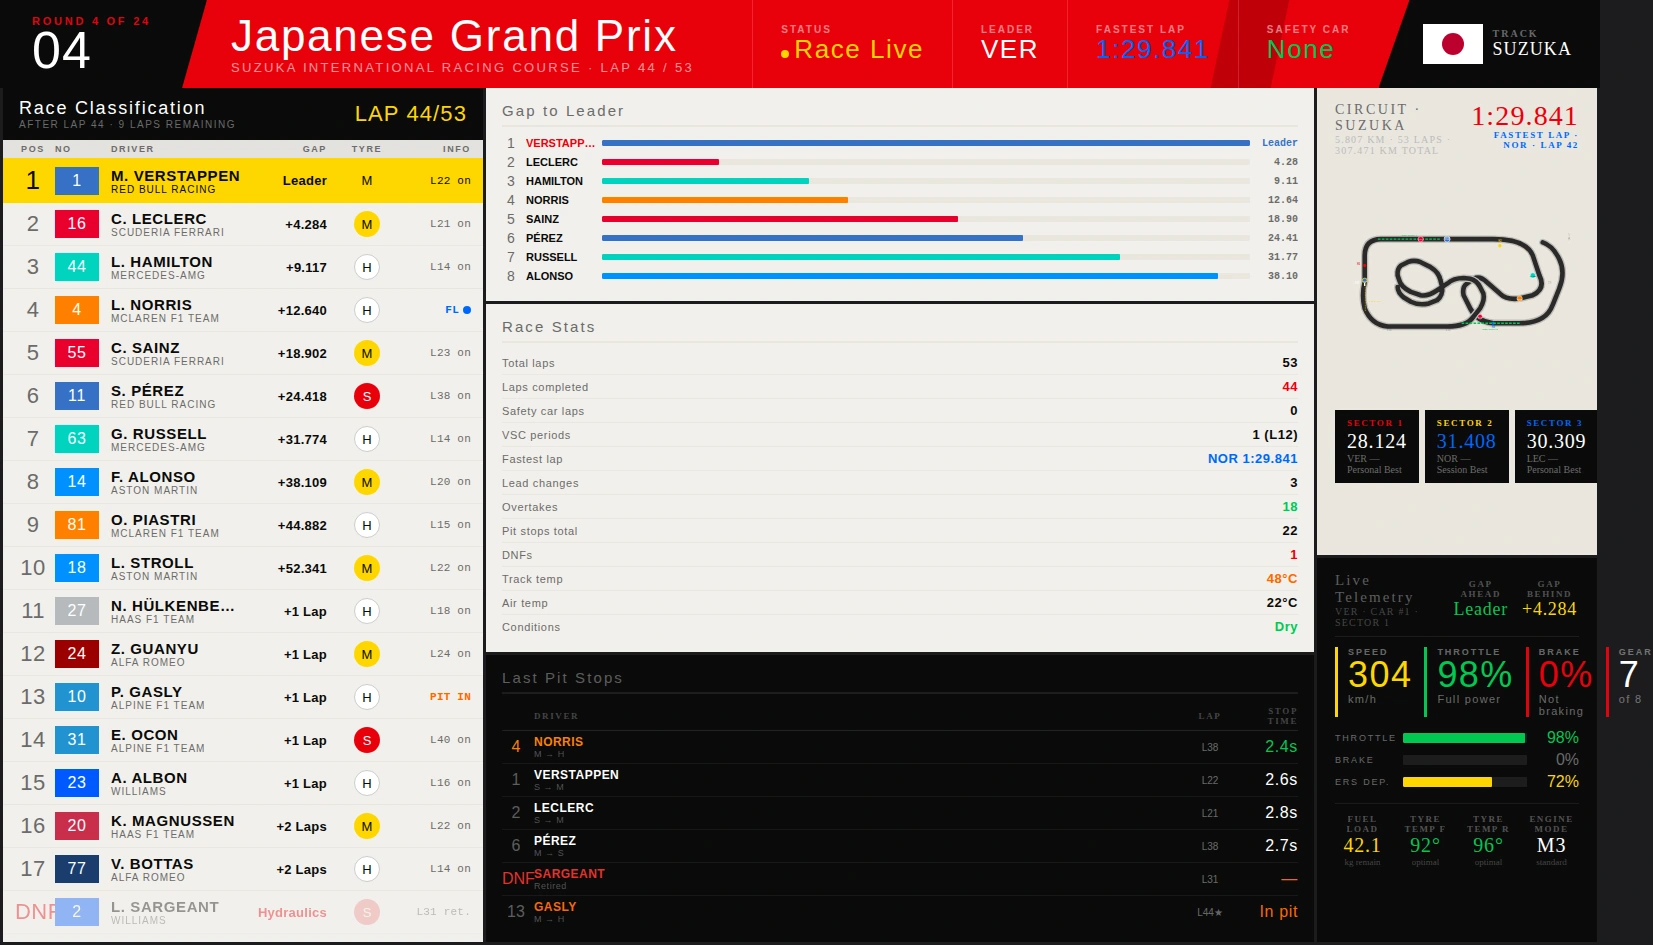
This dashboard tracks lap performance, pit strategy, and driver comparison metrics. It enables race teams to spot tactical advantages in real time. The structure prioritizes clarity under high-speed decision pressure.
Subway System Dashboard
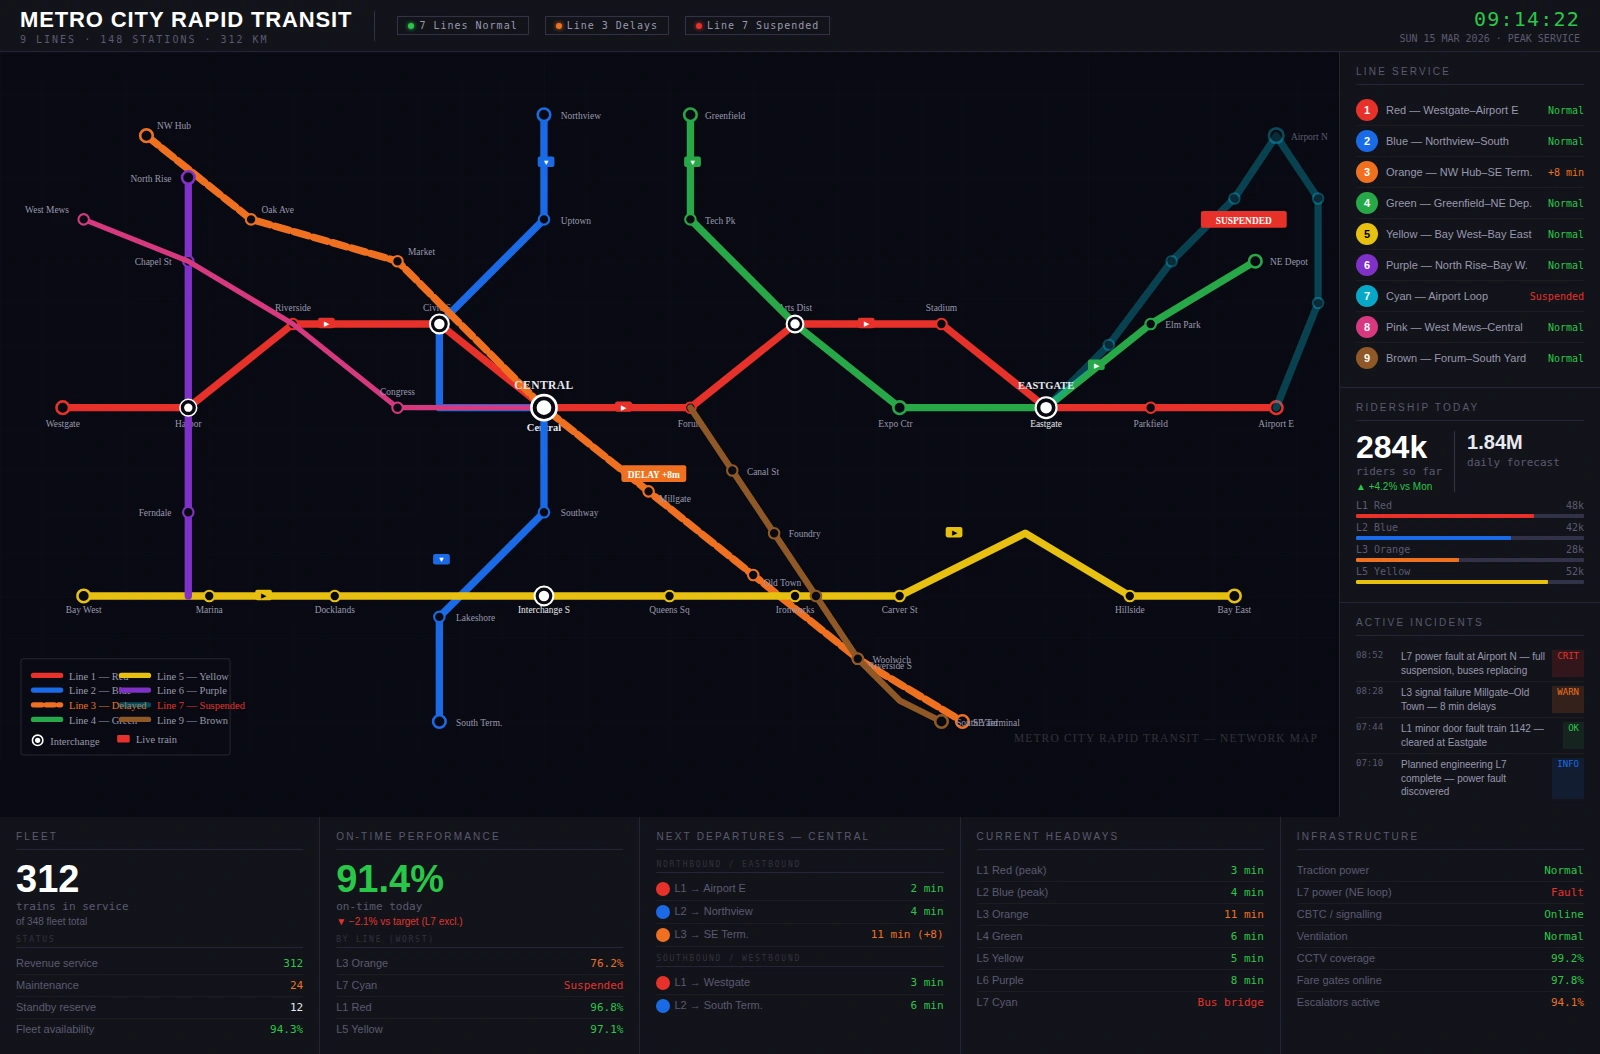
This dashboard visualizes line reliability, rider demand, and service incident patterns. It helps transit teams coordinate maintenance and schedule adjustments efficiently. The design improves situational awareness across the network.
Winery Dashboard
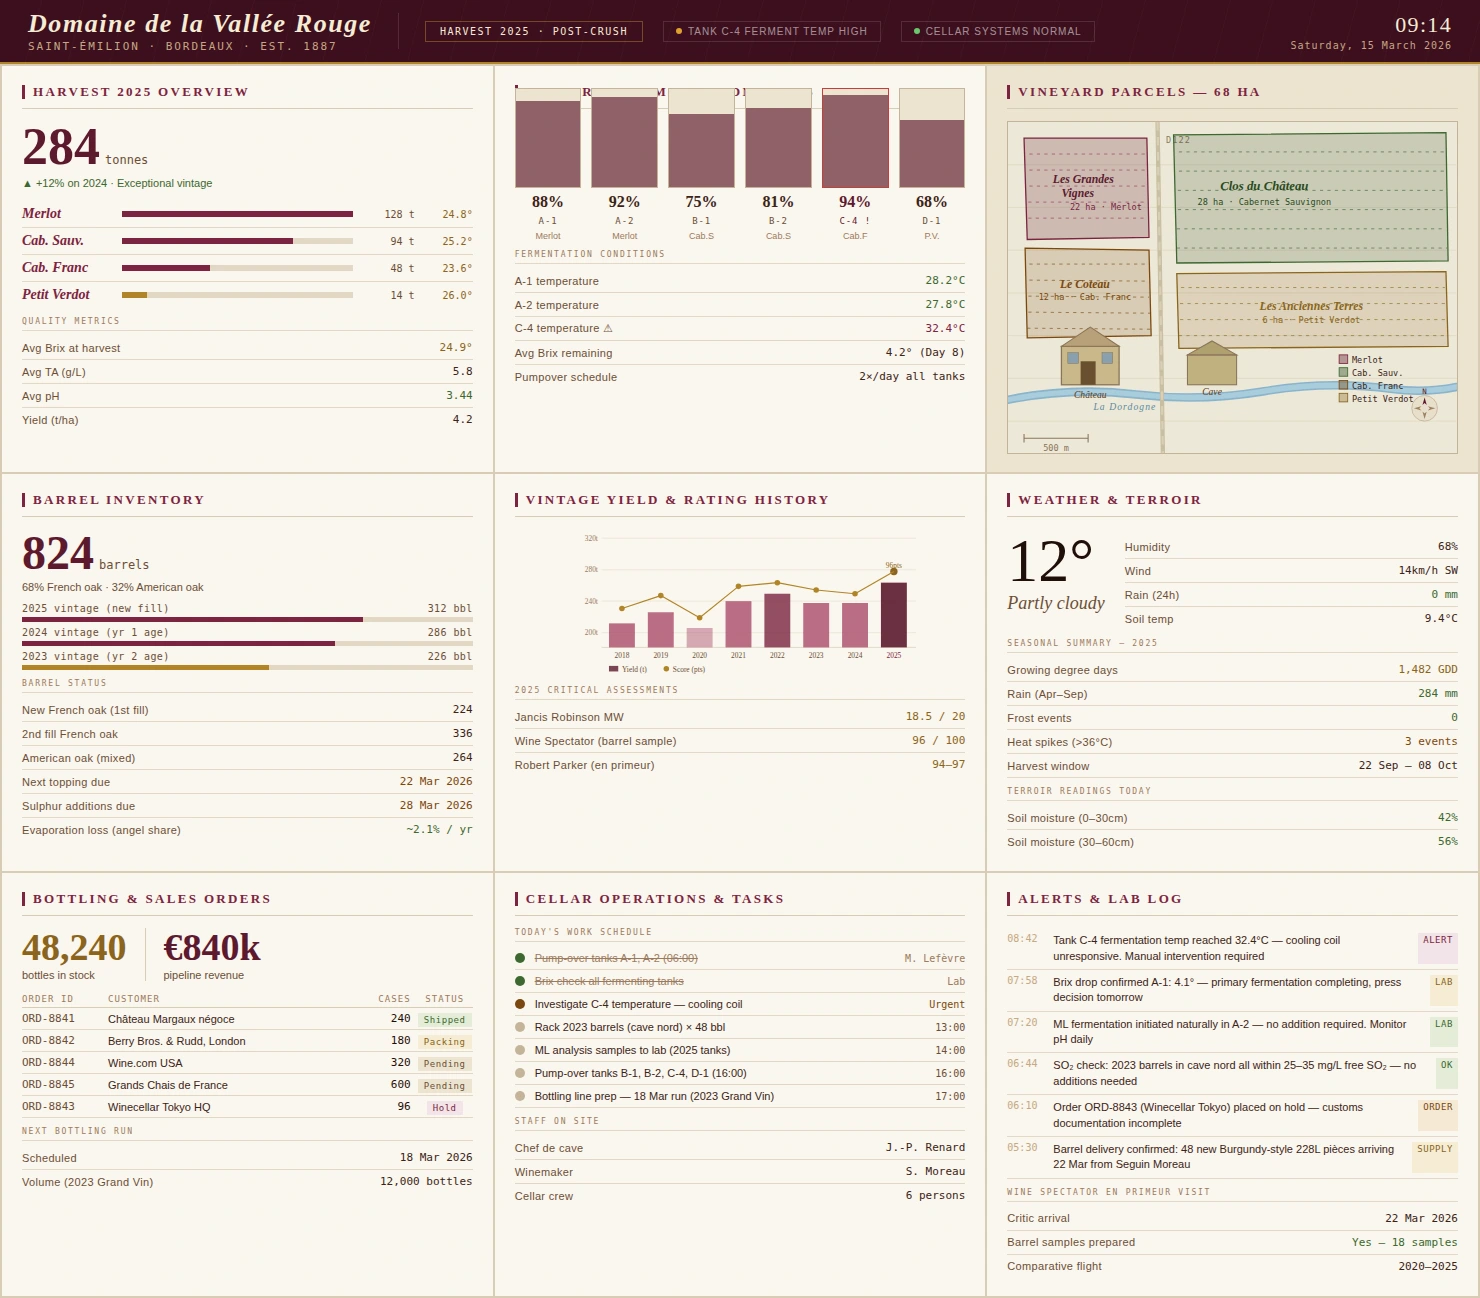
This dashboard combines production, distribution, and tasting room sales indicators. It helps winery teams monitor both operations and customer-facing performance. The design makes seasonal trends easier to evaluate and act on.
Pharmaceutical Trial Dashboard
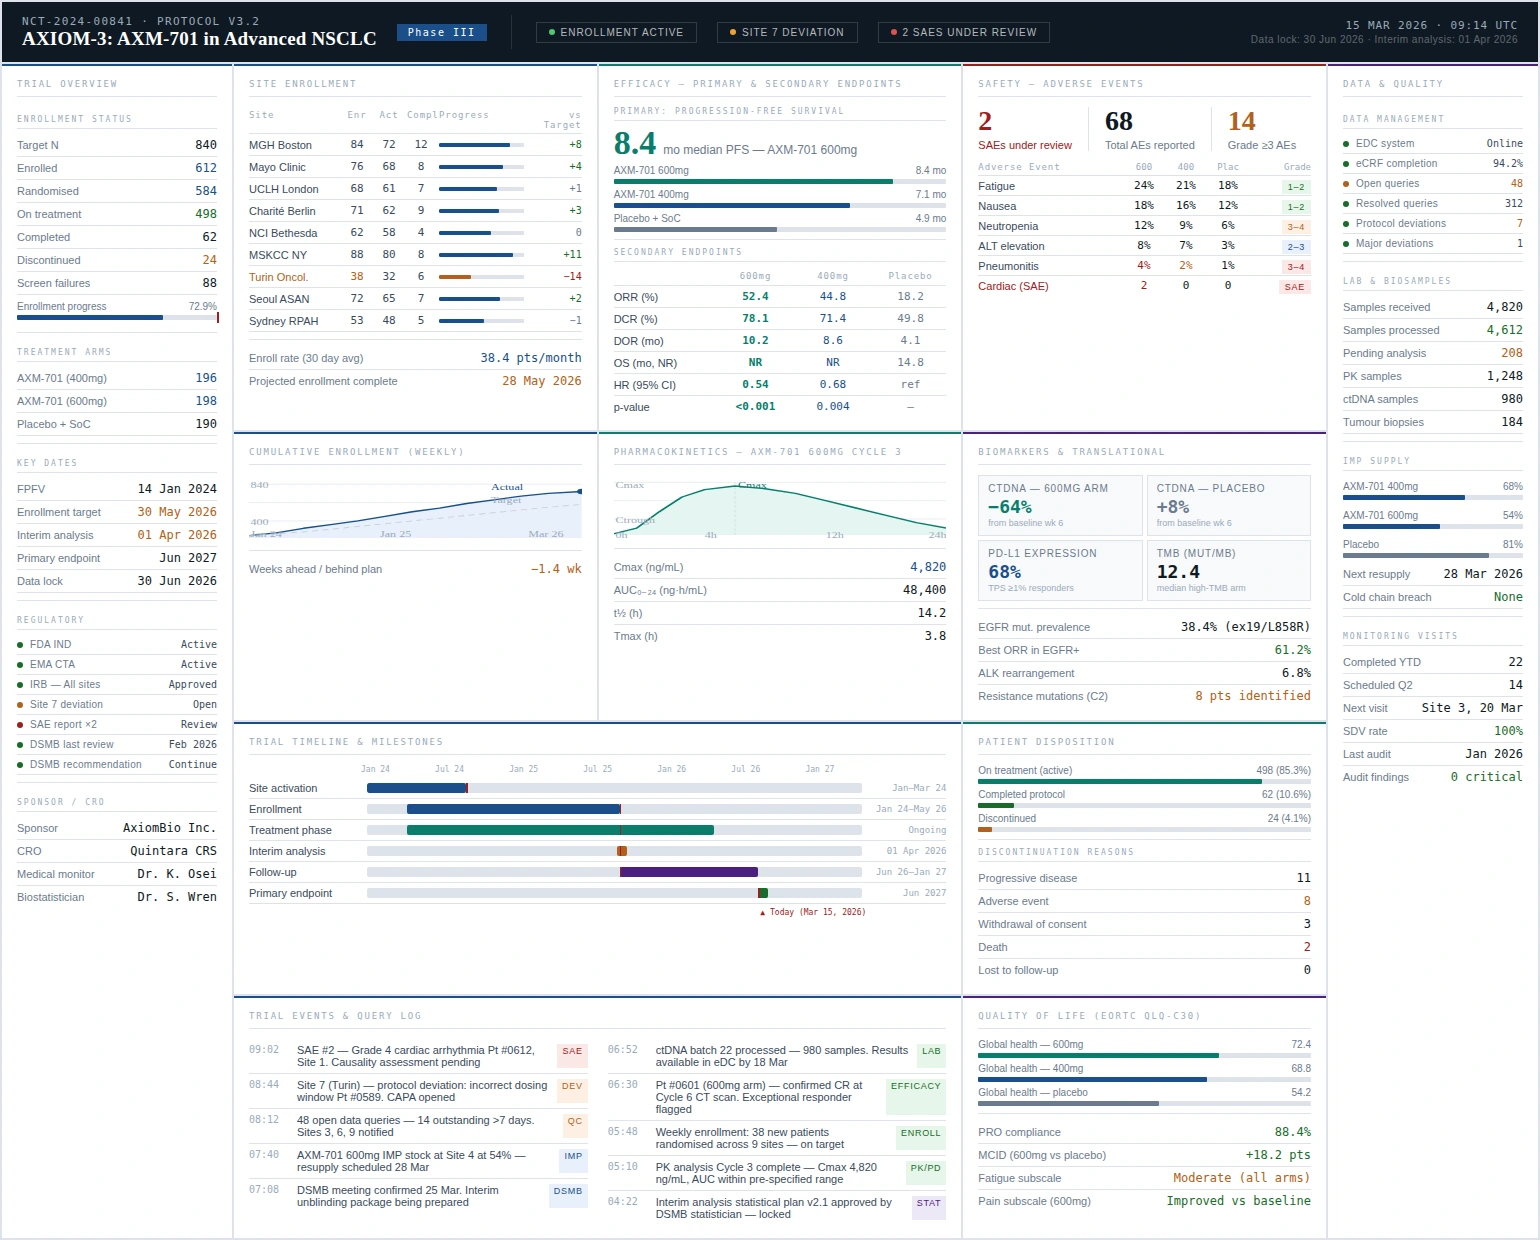
This dashboard tracks enrollment, protocol adherence, and adverse event reporting status. It gives research teams a consolidated view of trial progress and risk signals. The layout supports timely intervention and stronger oversight.
Offshore Oil Platform Dashboard
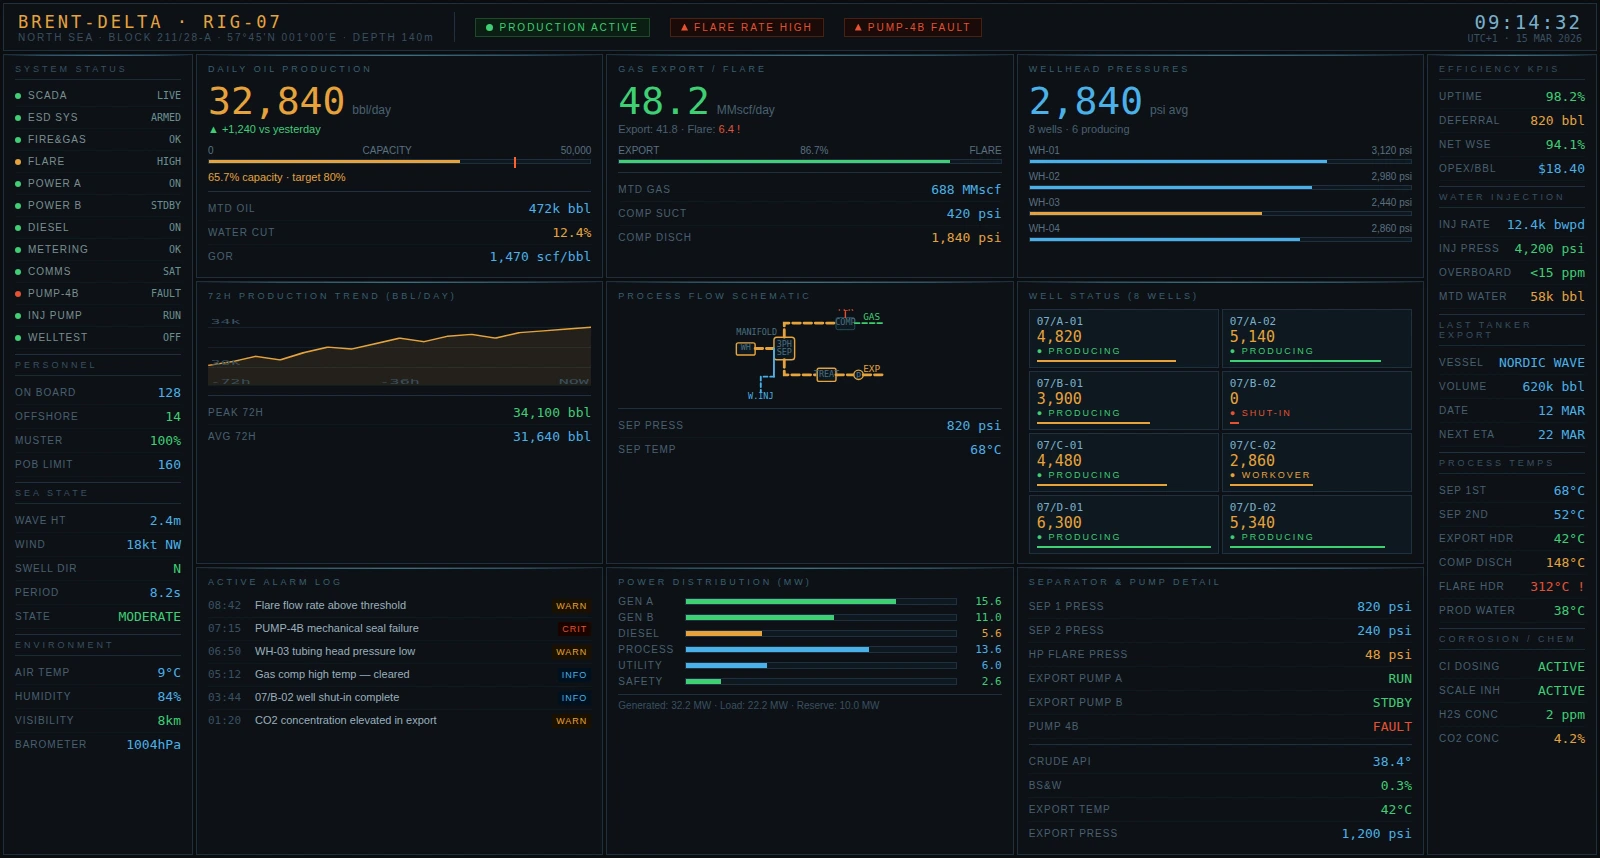
This dashboard presents production rates, equipment health, and safety compliance metrics. It helps offshore teams reduce downtime and improve asset reliability. The design supports quick escalation when performance deviates from plan.
Academic Performance Report
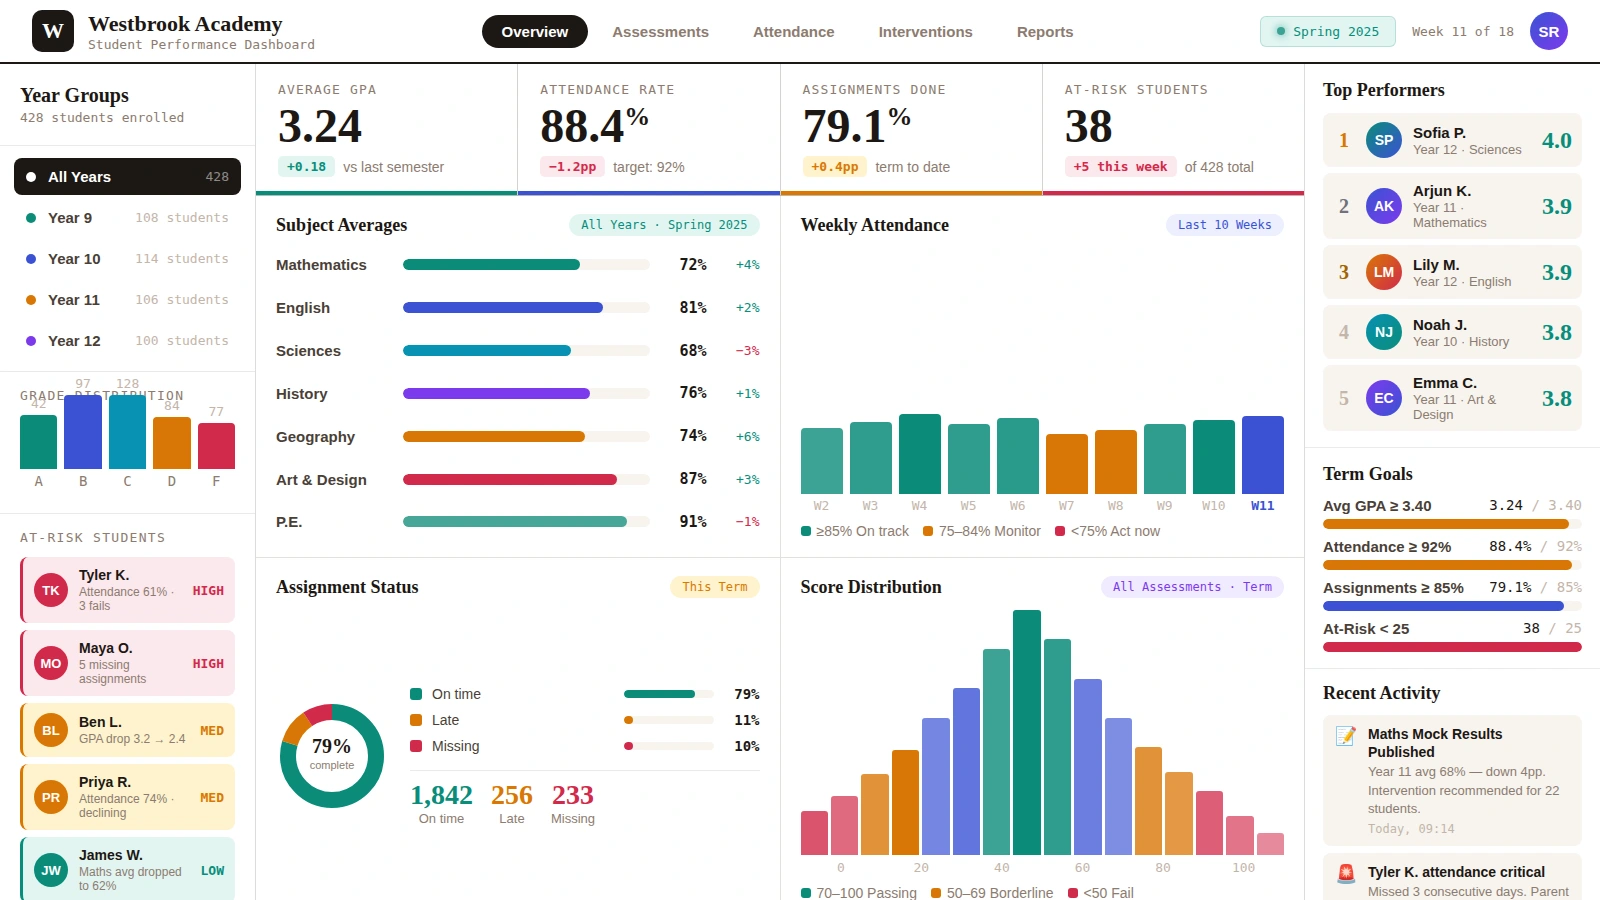
This dashboard shows student outcomes, attendance, and course-level performance indicators. It helps educators identify achievement gaps and intervention opportunities. The design supports data-informed planning for academic improvement.
FMCG Analytics Dashboard
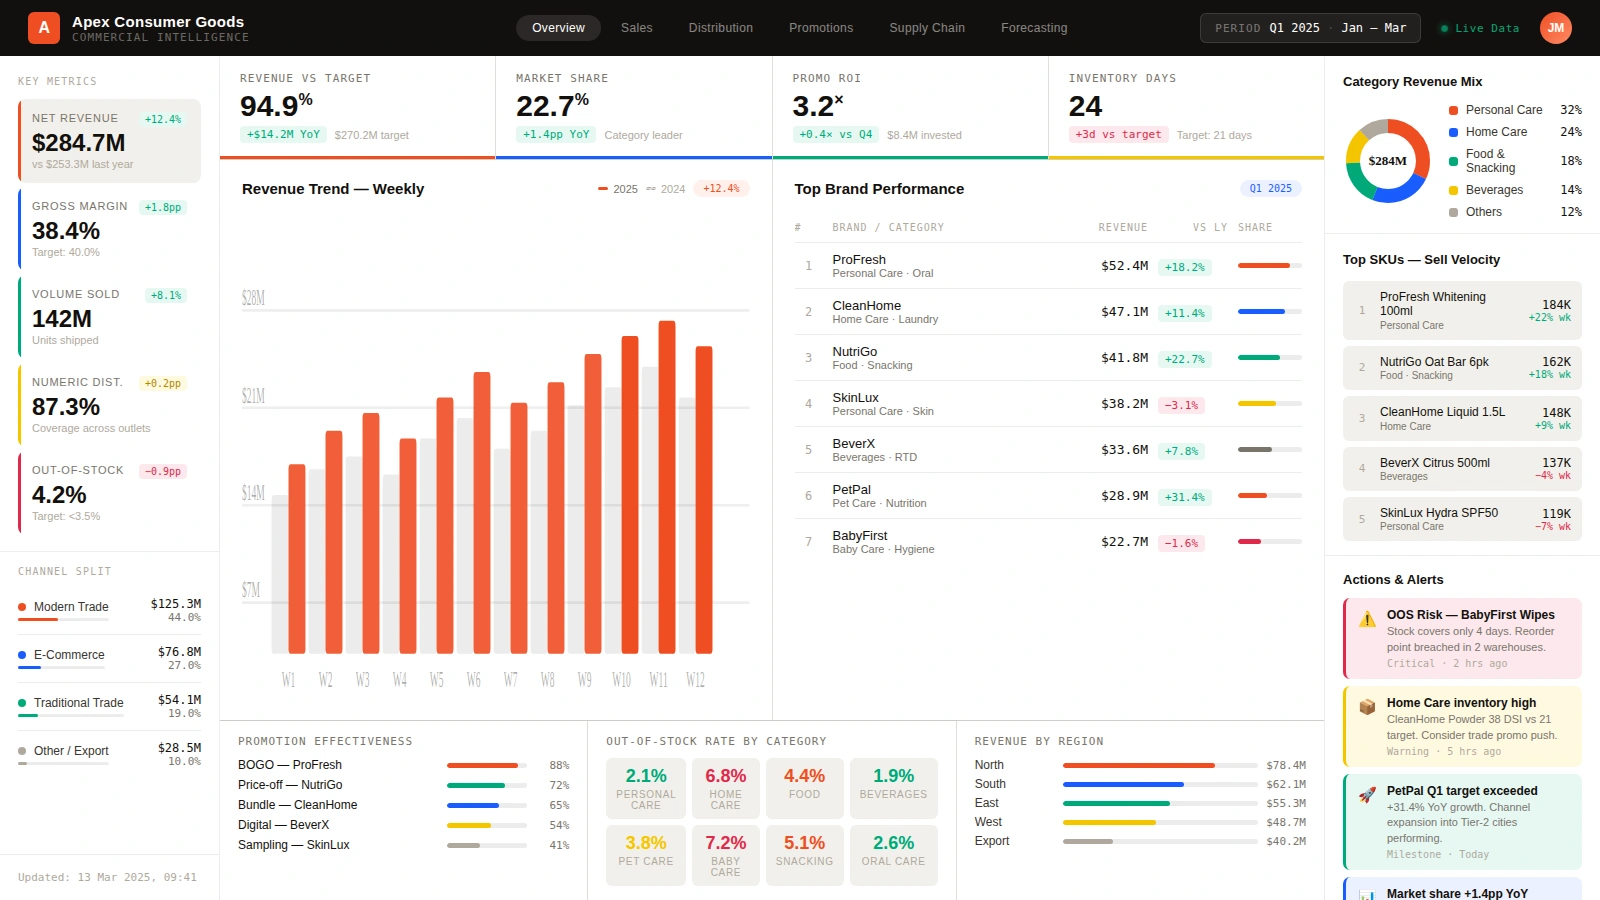
This dashboard unifies sales velocity, inventory movement, and channel performance metrics. It helps teams optimize promotions and replenishment strategies quickly. The design makes category-level performance easy to compare across regions.
Emergency Room Dashboard
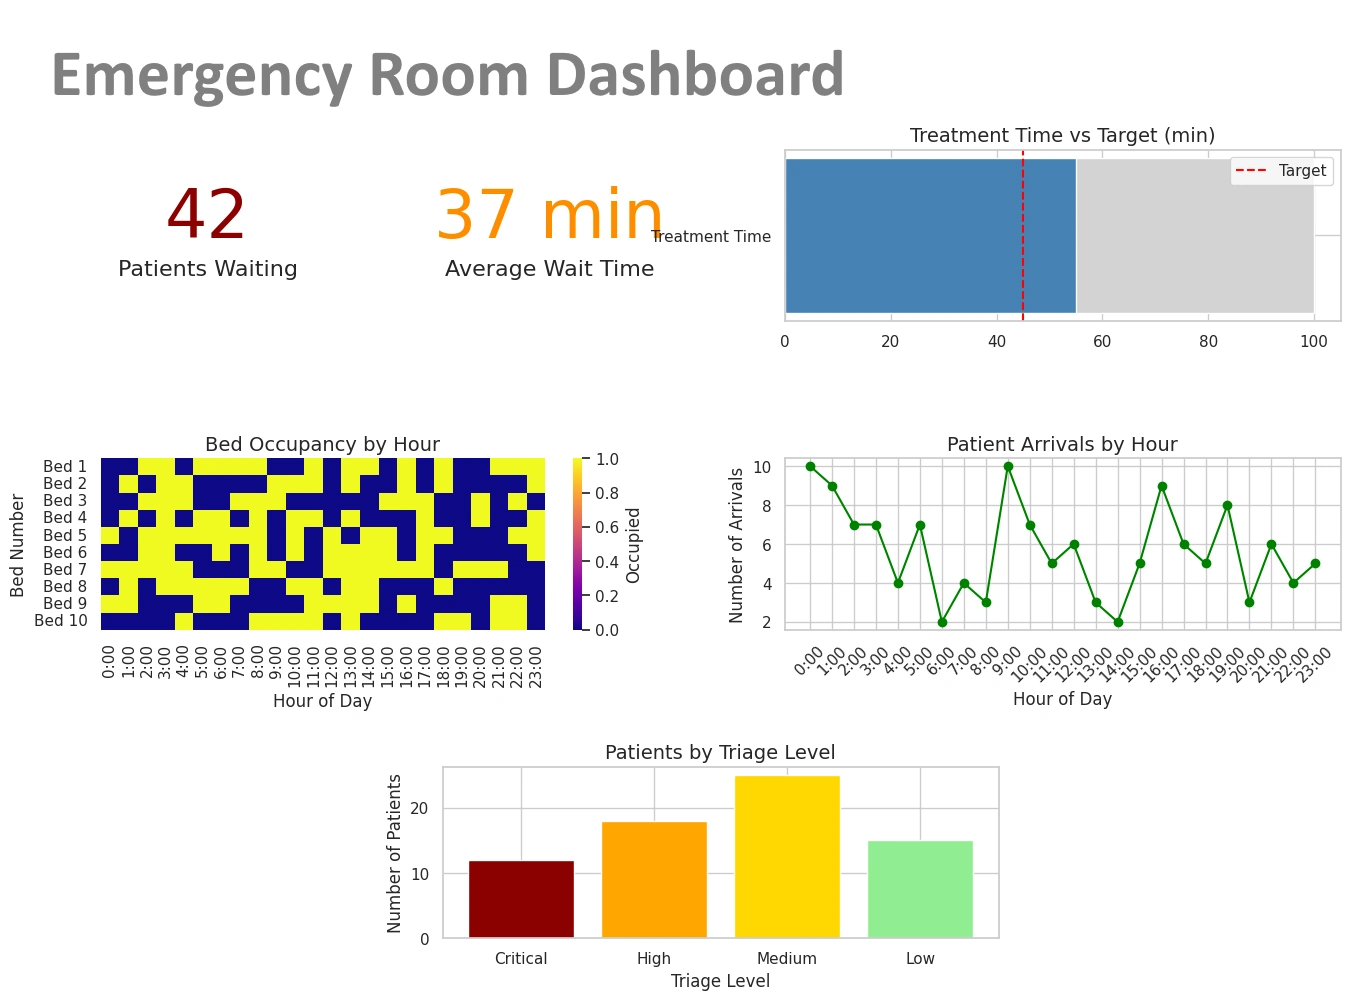
This dashboard tracks patient flow, wait times, and staffing pressure in real time. It helps hospital teams prioritize care delivery during high-demand periods. The design supports faster operational decisions and better service quality.
Related Articles
Java Reporting - An interview with InformIT - an interview with InetSoft's CEO about the company's evolution from a Java reporting tools provider to a business intelligence software company. I love meeting with executives that are also strongly technically inclined, which made my interview with InetSoft's CEO and co-founder, Luke Liang, so much fun. In 1996, Luke Liang and Larry Liang created InetSoft Technology, just as Java was coming into popularity. As an emerging market, Java lacked tools, and as they surveyed the market they decided to address the most urgent need: reporting. With hope and engineering prowess, they built reporting tools for extracting data from corporate data sources and presenting it in a meaningful way. And their efforts paid off as they experienced a good reception from the community. Rooted in a reporting foundation, InetSoft Technology continued to grow and soon became a leading provider of reporting software, even receiving Java Developer Journal (JDJ) awards five years in a row...

Java Reporting Engine - Access multiple data sources with a single reporting engine, a characteristic of enterprise reporting is that the data sources tend to be diverse in nature. A reporting application often needs to retrieve data from multiple data sources, each with a different protocol. Instead of forcing a relational view on all data sources, the Style Report reporting engine allows report developers to connect to any data source through a Java API, and the most common data sources using the visual query builder. Style Report's professional authoring tool combines word-processing grade design with dynamic data manipulation. Key benefits include: * Deliver professional, high fidelity presentation * Transform and manipulate raw data * Embed business logic with scripting * Enhance manageability and agility...
Java Reporting Framework - InetSoft provides a user-friendly Java reporting framework that allows business users to create professional, high performance reports. Utilizing a Java reporting framework offers multiple advantages to end users over other reporting software, making reporting less of a hassle and more efficient for businesses. For example, Java reporting frameworks such as InetSoft's are much simpler to use; those who are familiar with the basics of Microsoft Word, Excel, and PowerPoint can make intuitive reports with no programming experience needed. In addition to this, InetSoft's framework offers flexibility to the user, allowing users to pull in data from multiple sources and export reports in all possible formats such as DOCX, WordML, XLS, XLSX, SpreadsheetML, RTF, PDF, HTML, MIME email and TXT.

Java Reporting Generator - A high performance Java reporting generator is included in InetSoft's award-winning Style Report. This reporting application has an advanced object oriented API and easy to use visual report designer. The professional authoring tool combines word-processing grade design with dynamic data manipulation. Key benefits include: * Deliver professional, high fidelity presentation * Transform and manipulate raw data * Embed business logic with scripting * Enhance manageability and agility You can deliver on-demand reports on the Web. In-report exploration capabilities empower business users with the ability to reshape information in real time. Key benefits include the ability to: * Gather up-to-the-minute information * Reshape reports in real time * Minimize performance bottlenecks...
Java Reporting Software - InetSoft's Java reporting software was the company's first BI product and broke new ground in enterprise reporting providing new levels of efficiency for the database analyst or power user of business intelligence. InetSoft’s AJAX and HTML5 powered Web 2.0 technology brings a desktop grade Web user experience to ad hoc query and reporting. Key benefits are: * Extend professionally designed reports * Gather information by self service queries * Produce presentation quality reports on the web...
Javascript Reporting Tools - If you are looking for software for making reports in a Java environment, evaluate InetSoft's award-winning Style Report. This Java reporting application integrates seamlessly with other business applications to create a powerful reporting solution...
Javascript Reporting Tools - InetSoft provides user-friendly javascript reporting tools that allow business users to tailor dashboards and reports with javascript to adapt to even the most unique reporting needs. Utilizing a Java reporting framework offers multiple advantages to end users over other reporting software, making reporting less of a hassle and more efficient for businesses...
Key Benefits of This Visual Reporting Solution - That’s one of the key benefits of this visual reporting solution. It breaks down the cycle of pain, and as in this case, a couple of people can bounce ideas around. This could be a manager. It happens all the time a manager is going into a meeting with his bosses or the board and needs to be able to answers on the fly. With this kind of tool, he or she has got the all data there so they can answer their questions on the fly with a whole set of data in memory. To summarize and conclude this portion of the demonstration, there’s five test of problems that we see visual reporting and analysis apply to. The first is list reduction which you saw several examples of that, certainly the university giving example on prospect identification. Next is portfolio analysis, the airline example, where you try to understand out of this portfolio of flights where do I need to focus. This could also be assets, people, projects, or proposals. We’re doing some work that identified performance, who are high paid low performers in a team of a couple of hundred thousand in a large company. It’s great for that because you can see what makes up that group. That gets into outlier detection where you found anomalies and unexpected behaviors, customer behaviors, staff performance, project progress, or medical claims issues, for instance...
Key Metrics Definition - Also known as a key performance indicator, or KPI, a key metric is a statistic which, by it's value gives a measure of an organization or department's overall health and performance. All organizations, from nonprofits to multinational corporations, need to track key metrics in order to have an accurate picture of what is going on...
Key Points of StyleBI - So let's take just a really brief look at what we think are the key points of StyleBI. This is not intended to be a product demonstration, where we are just really capturing the high level view here. And there are really three parts I think that are very important when we talk about StyleBI. The first is that we try to deliver data in the time that you need it...
Key Points of StyleBI Continued - We also have a very interesting way of making use of qualitative information based on unstructured data, because we can understand unstructured data and organize it into concepts. We can actually use those concepts to drive some of the aspects of the analysis, that’s better served by talking about an example. So for example, let’s say, you are a large insurance company and you have a database of claims information. That claims information may include hard information such as how much a claim was for, who made the claim, when the claim was made, etc. That works very well in the traditional world of business intelligence...
KPI Reporting Tools - Looking for an intuitive flexible reporting tool for tracking your KPI's? InetSoft offers both free and enterprise versions of its award winning kpi reporting tool, Style Report...

Last Paradigm Is Production Reporting - Then finally the last paradigm is what we call production reporting. We email you something. Its reporting and dashboards, but it doesn’t have to be something that you go and request. It could be something that shows up for you automatically. One of the ways that we use it at our company is we look at forecasts, and we get an automatic delivery of what everybody’s forecast is. We see how they are doing according to their plan, and as a result we all know exactly what's going on without even doing any effort. Sometimes these things overlap. You start off with the canned report, but then you realize you want to find something else, so you got to an ad hoc reporting wizard. You determine what you want to look for, manipulate the information and then you can publish that as a new dashboard. Now everyday you get that information just showing up, and that can be very helpful to people who need more and more information. And I’d like to point out that this is only talking about people who are internal or business users, internal to your company right now, but one of the best facts about all of these very simple ways of receiving information, whether it is production reporting or interactive dashboards, is that external users find them very easy, too...
Lawyers Actually Want to Use These Reports - Have you found that the lawyers actually want to use these reports on their own? Or, are you having to spend a lot of time handholding? How have the performance reports been rolled out from your point of view? Ron: It was expected that many would have a hard time adopting the new technology and that we would get a lot of phone calls. But up front we set up a little live tutorial and orientation that lasted a half hour. That really took care of it for most people. The dashboards are really intuitive enough. Operationally, there is a process to calculate profit for the quarter. That takes two days. As soon as that’s done, we can hit the go buttons. So, getting it out is easy and fast. Mark: Just for myself, I found your reports and dashboard very easy to understand and to use. Have you found that with your own people, as well, that they – they are able to self-serve, or do they want you to take them through it more, or how does that work? Ron: It’s a bit of both. But certainly they can use it easily. For complex questions, they would normally have one of the finance team with them. Sometimes it’s just that they have got questions about more details. So, for example we’re looking at staff margin...

LDAP Report Environment - InetSoft's reporting software allows users to configure LDAP report environment to increase the securirty of proprietary data. When using the iPlanet Directory Server, you must set up a base DN (Distinguished Name, e.g., dc=inetsoft, dc=com) for the company. In addition, you should configure the server by setting up access permissions for this DN. Finally a schema must be created to enable access to deployed reports (replets) via iPlanet. Assuming that the iPlanet Directory Server is correctly installed and configured, you must next create a replet schema. To create the schema, follow these steps: 1. Start the iPlanet server console, expand the node under root that corresponds to the DN, e.g., 'inetsoft' (in the left pane), then expand the node 'Server Group'. 2. Click on 'Directory Server' in the left pane, then click the 'Open' button in the right pane. 3. Open the Directory Server console, click the Configuration tab, and highlight the node 'schema' under the root of 'hostname.inetsoft:389', where 'hostname' is your machine name and 'inetsoft' is your DN...
LDAP Report Security - InetSoft's reporting software allows users to configure LDAP report security via the enterprise manager. The LDAP security provider is useful when your users/groups/roles are already defined in an LDAP environment such as MS Active Directory, Sun One IPlanet, or any generic LDAP implementation. When using the LDAP security provider, all users/groups/roles are retrieved from the LDAP server and cannot be created or configured in Enterprise Manager. All permissions to InetSoft components and functions are stored on the LDAP server (with modification of the LDAP schema). The structure of the LDAP schema must be defined in the Enterprise Manager. To add Schema information, select the Server tab, and then select the 'Server' > 'Security' option to open the 'Security Provider' page. Select the 'LDAP Security Provider' option and choose the appropriate LDAP server implementation from the menu. Make sure the LDAP server is correctly installed and configured...

LDAP Report Setup - InetSoft's reporting software provides highly customizable options and simple tools for users with LDAP report setup needs. To use Active Directory Server, you should enable writing to schema. To do this, follow the steps below: 1. 'Start' >'Run' 2. Type “mmc” and click 'OK' 3. Select the 'Console' > 'Add/Remove Span-In' menu and click 'Add'. 4. Select 'Active Directory Schema' and click 'Add' 5. Select 'Active Directory Users and Groups' and click 'Add' 6. Select 'Close' and then 'OK' 7. Right-click 'Active Directory Schema' in the tree on the left 8. Select 'Change Domain Controller' 9. If the Current DC is not correct, select 'Specify Name', enter the DC, and click 'OK' 10. Right click 'Active Directory Schema' and select 'Operations Master' 11. If the Current Operations Master is not the same as the DC you just entered, click the 'Change' button 12. Check the “The Schema may be modified...” box. 13. Click 'OK' and exit the MMC Note that the administrator account needs to be a member of the Schema Admins group. Select 'Generic' as the 'LDAP Security Provider' to use any other LDAP server...
Leadership Weekly Report Tool - Searching for a leadership weekly report tool? Easily build formatted or interactive leadership weekly reports with InetSoft's advanced flexible BI tool. Highly rated for customer service and ease of deployment, InetSoft has been a pioneer in self-service BI since 1996. View a demo and try interactive examples...