Evaluate InetSoft's Solution for Business Intelligence Scorecards
Are you looking for a good solution for business intelligence scorecards? InetSoft offers competitive pricing models and a range of deployment options, allowing organizations to choose a solution that aligns with their budget and scalability requirements. InetSoft's BI scorecards provide a high degree of customization, allowing you to design dashboards that align with your unique KPIs and reporting requirements. View a demo and try interactive examples.

Register for more information and a personalized demo
About InetSoft
Since 1996 InetSoft has been delivering easy, agile, and robust business intelligence software that makes it possible for organizations and solution providers of all sizes to deploy or embed full-featured business intelligence solutions. Application highlights include visually-compelling and interactive dashboards that ensure greater end-user adoption plus pixel-perfect report generation, scheduling, and bursting. InetSoft's patent pending Data Block™ technology enables productive reuse of queries and a unique capability for end-user defined data mashup.
This capability combined with efficient information access enabled by InetSoft's visual analysis technologies allows maximum self-service that benefits the average business user, the IT administrator, and the developer. InetSoft was rated #1 in Butler Analytics Business Analytics Yearbook, and InetSoft's BI solutions have been deployed at over 5,000 organizations worldwide, including 25% of Fortune 500 companies, spanning all types of industries.

How Does the Head of Attractions at an Amusement Park Use Business Intelligence Scorecards?
The Head of Attractions at an amusement park plays a pivotal role in ensuring that the park's rides and attractions are not only safe and well-maintained but also appealing to visitors. Business Intelligence (BI) scorecards can be an invaluable tool in this role, offering a comprehensive way to monitor and manage various aspects of the attractions department. Here's how the Head of Attractions might utilize BI scorecards:
-
Performance Monitoring:
- The scorecard can track key performance indicators (KPIs) for each attraction, including metrics like attendance, ride capacity, wait times, and customer satisfaction ratings.
- This information helps in identifying popular attractions, assessing their efficiency, and understanding visitor preferences.
-
Safety and Maintenance:
- BI scorecards can include data on safety incidents, maintenance schedules, and compliance with industry regulations.
- This allows the Head of Attractions to proactively address any safety concerns and ensure that all rides meet or exceed safety standards.
-
Revenue Generation:
- The scorecard can provide insights into the revenue generated by each attraction, including ticket sales, merchandise, and concessions related to that specific attraction.
- This data helps in optimizing pricing strategies, as well as identifying opportunities for upselling and cross-selling.
-
Resource Allocation:
- It can track staffing levels, both in terms of operators and maintenance personnel, required for each attraction.
- This helps in efficient resource allocation, ensuring that the right number of staff is assigned to each attraction based on demand.
-
Customer Feedback and Satisfaction:
- BI scorecards can integrate customer feedback from surveys, social media, and direct comments.
- This information is crucial in understanding customer sentiment, identifying areas for improvement, and recognizing exceptional performance.
-
Trends and Seasonal Variations:
- The scorecard can analyze historical data to identify trends in attraction popularity over different seasons, days of the week, or even times of day.
- This enables the Head of Attractions to make informed decisions about staffing, promotions, and ride maintenance schedules.
-
Competitor Benchmarking:
- BI tools can incorporate data on competitors' attractions, attendance figures, and customer feedback.
- This allows for a comparison of performance against industry standards and competition, which can inform strategic decisions.
-
Investment and Expansion Planning:
- The Head of Attractions can use BI scorecards to evaluate the return on investment (ROI) for potential new attractions or upgrades to existing ones.
- This helps in making data-driven decisions about where to allocate resources for future developments.
-
Sustainability and Environmental Impact:
- Scorecards can include metrics related to energy consumption, waste management, and other sustainability initiatives associated with attractions.
- This data is vital for meeting environmental goals and demonstrating the park's commitment to sustainability.
 |
Learn how InetSoft's data intelligence technology is central to delivering efficient business intelligence. |
What KPIs Do Amusement Parks Use?
Here are some of the most important KPIs that amusement parks commonly use:
-
Attendance:
- Total number of visitors on a daily, weekly, monthly, or yearly basis.
- Breakdown of attendance by age groups, demographics, and geographical regions.
-
Attraction Utilization:
- Number of rides or attractions in operation compared to the total available.
- Average wait times for popular attractions.
-
Customer Satisfaction Scores:
- Ratings and feedback from visitor surveys regarding their overall experience, rides, food, cleanliness, and customer service.
-
Average Revenue Per Guest (ARPG):
- Total revenue divided by the number of visitors.
- Helps in understanding spending patterns and optimizing pricing strategies.
-
Food and Beverage Revenue:
- Total revenue generated from food and beverage sales.
- Can be broken down by type of food (e.g., snacks, meals) and beverage (e.g., soft drinks, alcohol).
-
Merchandise Sales:
- Total revenue generated from merchandise, including souvenirs, clothing, and other retail items.
-
Seasonal Variations:
- Attendance and revenue trends over different seasons, holidays, and special events.
-
Attraction Downtime:
- Percentage of time an attraction is unavailable due to maintenance, repairs, or safety checks.
-
Safety Incidents:
- Number of reported incidents, categorized by severity (e.g., minor injuries, major incidents).
- Helps in assessing and improving safety protocols
-
Repeat Visitation Rates:
- Percentage of visitors who return for a second or subsequent visit within a specified time frame.
-
Weather Impact:
- Analysis of how weather conditions affect attendance and revenue.
More Resources and Articles about InetSoft's Solution for BI Scorecards
Align Processes and People - Definition of Management Scorecards - /info/defining_management_scorecards/ A management scorecard, commonly referred to as a balanced scorecard, takes an organization's in-the-background business plan and converts it into daily marching orders. Instead of passively working towards company goals, a management scorecard sets the stage for what needs to be done in the future and lays out the plan on how to get there...
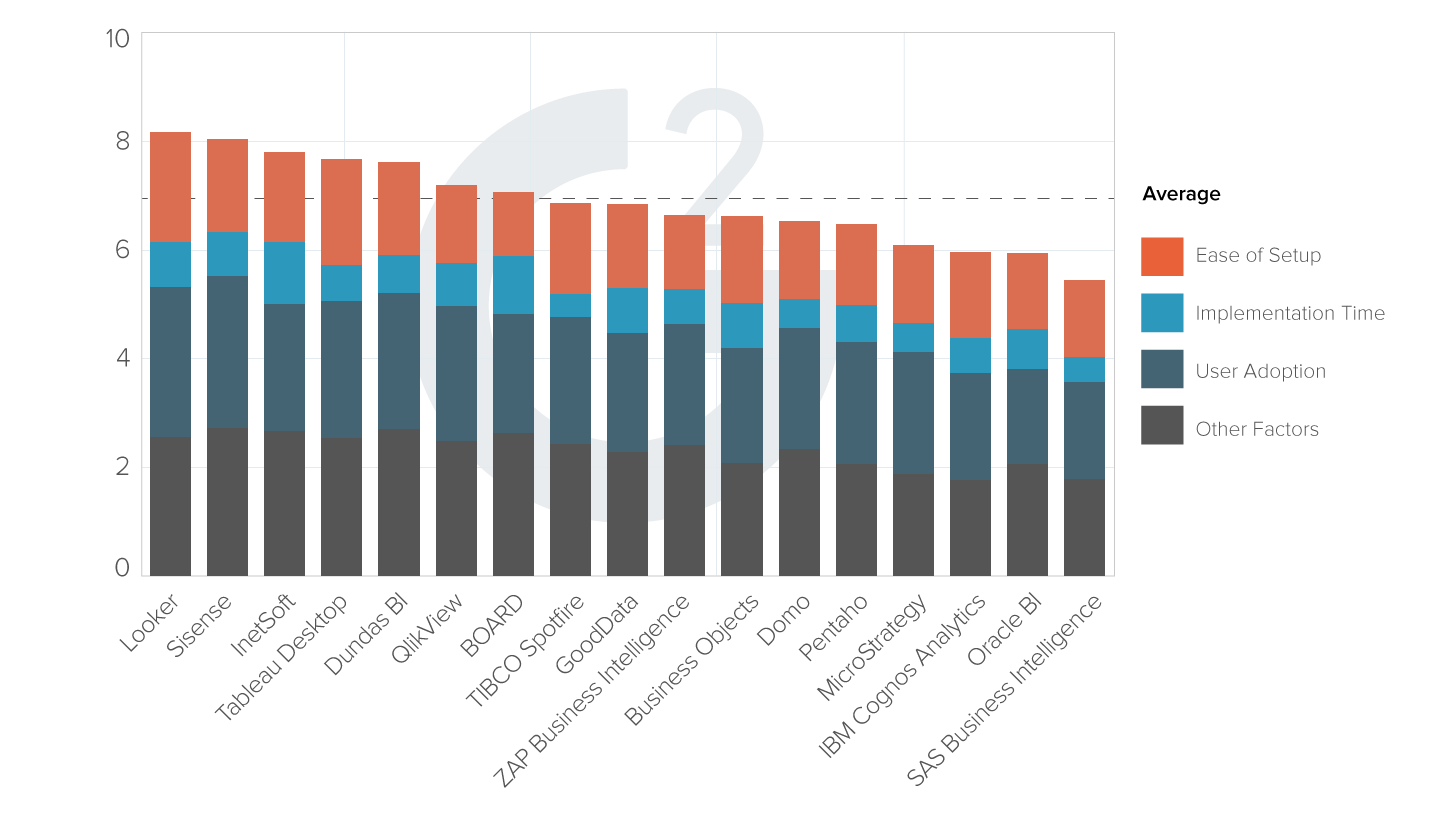
Does Tableau Do Paginated Reports? - No, Tableau is good at web-based data visualization. In contrast, InetSoft's reporting functionality is extensive. Crowdsource review site G2 Crowd's user-rating-based report, the Business Intelligence Platforms Implementation Index Report, lists InetSoft in the top 3 overall, #1 for user adoption, and #3 for ease...
Evaluate InetSoft's Vendor Management Dashboard Tool - Are you looking for a good tool to make a vendor management dashboard? InetSoft's pioneering dashboard reporting application produces great-looking web-based dashboards with an easy-to-use drag-and-drop designer. Get cloud-flexibility for your deployment. Minimize costs with a small-footprint solution. Maximize self-service for all types of users. No dedicated BI developer required. View a demo and try interactive examples...
 |
Read how InetSoft was rated as a top BI vendor in G2 Crowd's user survey-based index. |
Good Scorecard Applications - Scorecards are business intelligence tools that provide a perfect way to monitor, measure, and manage business performance. InetSoft's scorecards centralize a list of key performance indicators (KPIs) that compare current performance data against goals, quotas, and target trends. Scorecard applications also include analytic information about what to do when goals or quotas...
Importance of Visualizing Success - Visualizing success is an important part of this. We helped a county government build their balanced scorecard which they called managing for results. By the way balanced scorecard comes in a lot of different names. One of our suggestions is name it something else quickly, right...
Information about InetSoft's Tools for Making Dashboard Graphs - Looking for tools for making dashboard graphs? InetSoft offers free and commercial Web-based dashboarding and charting software. Whether you want an enterprise-scale solution, a local area network based dashboard, or graphs that you can embed in a Web page, InetSoft's applications can help...
Intuitive Scorecard Design - An effective balanced scorecard can be achieved with four key components: A destination statement A strategic linkage model that outlines how one will achieve said goals A definition for each goal A definition for each measurement With these four pieces in place, the company's efficiency can be graded quite easily. The destination statement is an outline of the goals that the company is aiming to achieve by implementing this scorecard in the first place...
 |
View live interactive examples in InetSoft's dashboard and visualization gallery. |
Keeping in Mind External Measures - Number nine is a mistake that I made over the years with my clients. I used to recommend to them, like how a lot of books recommend that your scorecard should include measures of your performance. How are you doing with money? Are you making money so that you're profitable? How are you doing with your customers? How are you doing with your employees...
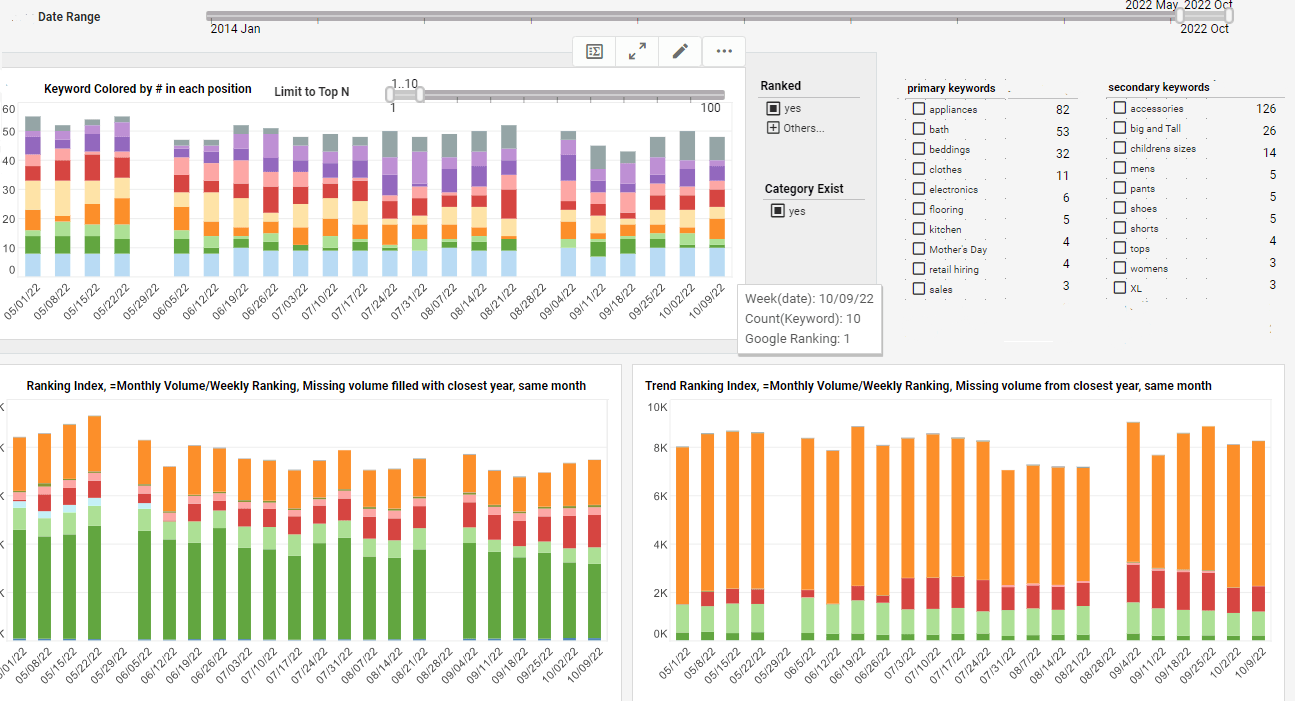
KPI Scorecard Example - KPI Scorecards are a business planning tool that allow users to track performance, available in InetSoft's comprehensive real-time analytical reporting and dashboard software. View the example below to learn more about the Style Intelligence solution...
Link All Your Metrics - Here are some of the biggest mistakes I've seen organizations make. Probably one of the most common ones is coming up with some vague vision statement and then trying to link all your metrics and your scorecard to the vision. In fact, some of the books on balanced scorecards even suggest that that's how you should do it...
Looking for Highly Rated Reporting Tools - Looking for a highly rated reporting tool? InetSoft has been delivering easy, agile, and robust business intelligence software that makes it possible for organizations and solution providers of all sizes to deploy or embed full-featured business intelligence solutions. View a demo and try interactive examples. InetSoft's comprehensive reporting platform can be used to create over 30 chart styles including bar, pie, line, curve, radar, waterfall, speedometer, pareto, candle, stock, stick, and bubble. These charts can be customized to show targets, provide desired x/y-axis formats and intervals, and even to show multiple datasets...
 |
Read the top 10 reasons for selecting InetSoft as your BI partner. |
Metrics to Add to Your Scorecard - So the external metrics that you might think about adding to your scorecard or your dashboard are like weather gauges for a pilot. A pilot can't control the weather, but they certainly monitor it in order to determine how to fly the plane. So some example external measures might be how your suppliers or vendors are performing, political factors. A pharmaceutical company...
Performance Management Process and Tools - Guess what that leads to consequence wise. They answered, and they hung up, They answered and they hung up as many times as they could, without listening to the customer, without being nice to the customer, without saying hello or good day or how else can I help you, is there anything else you need assistance with, any of that...
Stories of Good Dashboarding - Let's talk about some other good examples of dashboarding at companies. Yesterday, I attended a really good session by a leading financial services provider, and they highlighted the fact that they focused in on the right metrics. They went from number six in the industry in revenues and fees per financial representative to number one by focusing and having dashboards at...
Strategy For How To Develop Scorecards - Whenever you apply a threshold and best practice to whatever performance data you are looking at, that's a scorecard. For example, in healthcare, the government administration is setting what are the thresholds for how a hospital qualifies to get future business from Medicaid or Medicare...
Read what InetSoft customers and partners have said about their selection of Style Scope for their solution for dashboard reporting. |
This Year's Best Linux Dashboard Solution - Are you looking for the best Linux dashboard solution? InetSoft's pioneering dashboard reporting application can be hosted on any Linux server and produces great-looking web-based dashboards with an easy-to-use drag-and-drop designer. Get cloud-flexibility for your deployment. Minimize costs with a small-footprint solution. Maximize self-service for all types of users. No dedicated BI developer required. View a demo and try interactive examples...
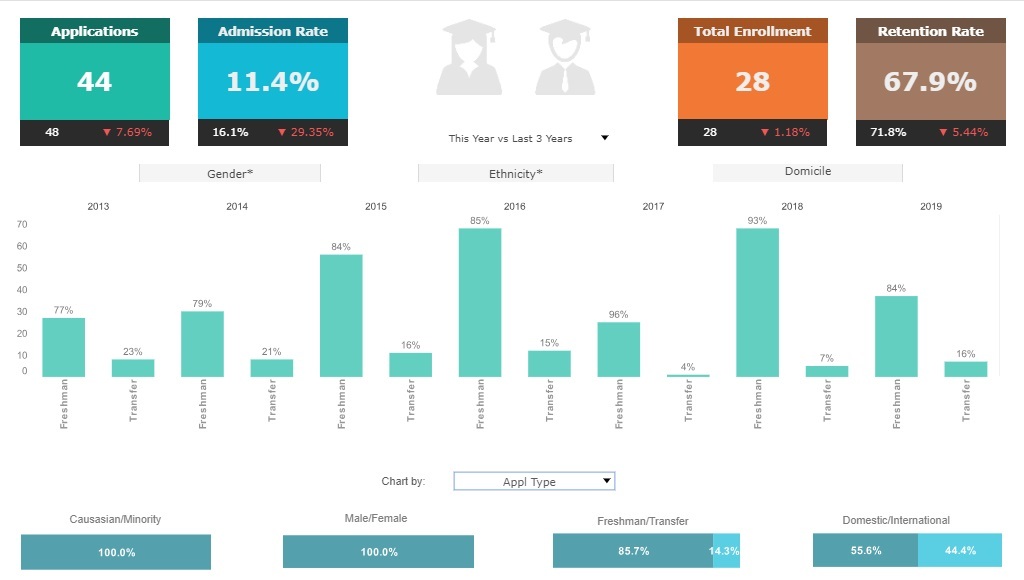
Three More Examples from a Scorecard Application - These can be designed by a non-technical person with a drag-and-drop designer. The first is an example from a college admissions department tracking their applications, admission rate, enrollment and retention rate by gender and racial equity. The second is from a litigation firm monitoring their case won-loss-decline rate, how their cases were sourced...
Tool for Creating a Scorecard - A scorecard is a business intelligence tool used to record an organization's strategic business model and implement it into the daily agenda. The scorecard sets the stage for future business goals and lays out a plan of attack to reach them. When creating a scorecard, a business and its employees are evaluated to identify opportunities for improvement. Balanced scorecards provide a framework for how a business should be run and enable...


