Try InetSoft's Metrics Dashboard and Scorecard Application
Are you looking for metrics dashboard and scorecard solutions? Since 1996 InetSoft has been making business software that is easy to deploy and easy to use. Build self-service oriented dashboards quickly. View a demo and read customer reviews.
InetSoft offers dashboard scorecard software that is:
Robust- attract the attention of executives
- satisfy the demands of power users
- adapt to organizations of all sizes
- deployed in a matter of weeks, not months
- learned by end-users with minor training
- comform to changing data information and business needs
- accommodate data exploration through visualization and maximum self-service
 |
View a 2-minute demonstration of InetSoft's easy, agile, and robust BI software. |
About InetSoft
Since 1996 InetSoft has been delivering easy, agile, and robust business intelligence software that makes it possible for organizations and solution providers of all sizes to deploy or embed full-featured business intelligence solutions. Application highlights include visually-compelling and interactive dashboards that ensure greater end-user adoption plus pixel-perfect report generation, scheduling, and bursting. InetSoft's patent pending Data Block™ technology enables productive reuse of queries and a unique capability for end-user defined data mashup.
This capability combined with efficient information access enabled by InetSoft's visual analysis technologies allows maximum self-service that benefits the average business user, the IT administrator, and the developer. InetSoft was rated #1 in Butler Analytics Business Analytics Yearbook, and InetSoft's BI solutions have been deployed at over 5,000 organizations worldwide, including 25% of Fortune 500 companies, spanning all types of industries.
Register for more info and to download free eval software
 |
Read why choosing InetSoft's cloud-flexible BI provides advantages over other BI options. |

What is the Difference Between a Dashboard and a Scorecard?
For a short explanation of the difference between the two, when one is used versus the other, please see this InetSoft article.
Three More Examples from a Scorecard Application
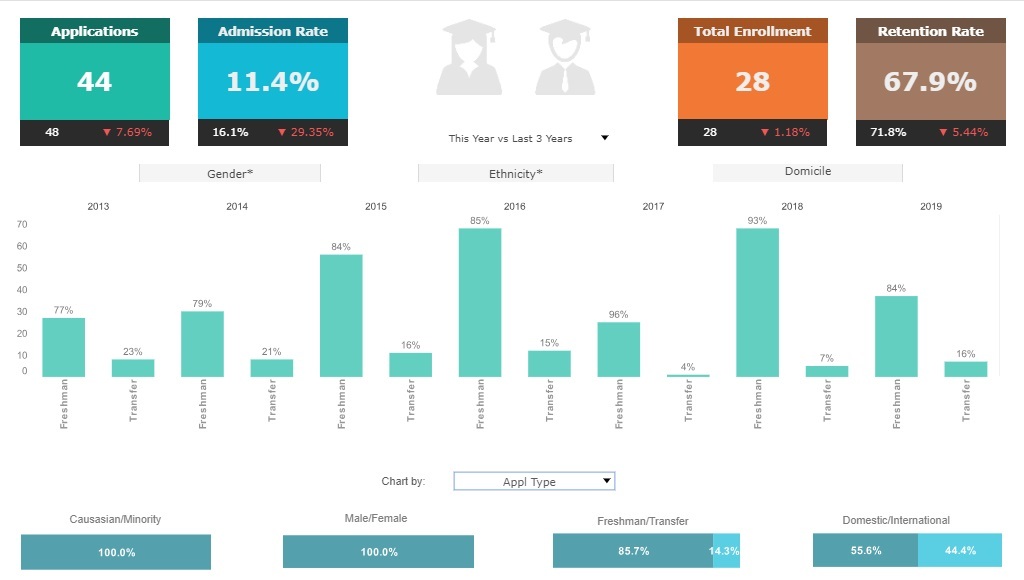
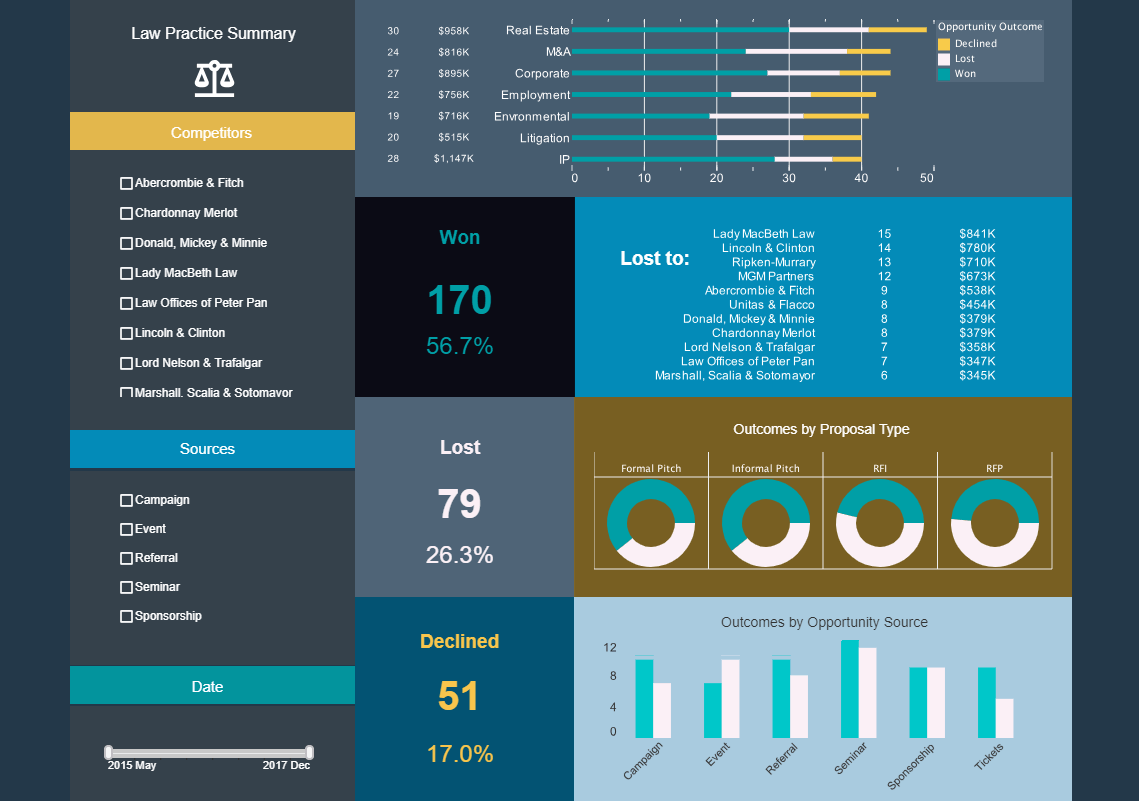
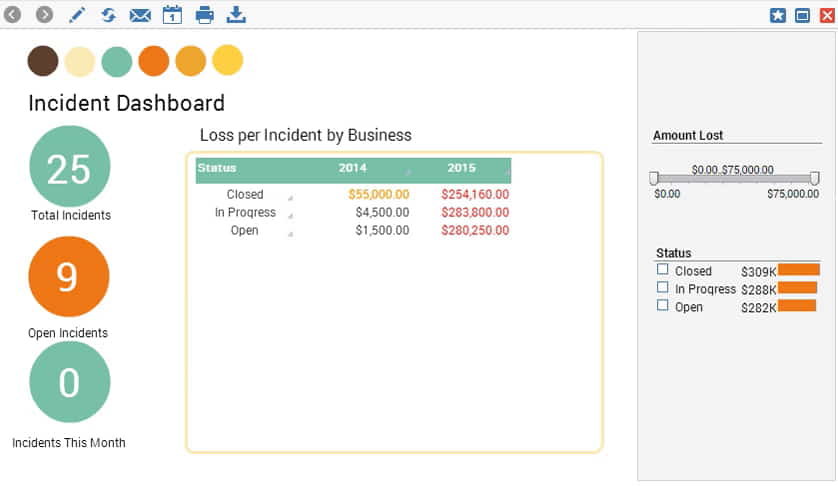
These can be designed by a non-technical person with a drag-and-drop designer. The first is an example from a college admissions department tracking their applications, admission rate, enrollment and retention rate by gender and racial equity. The second is from a litigation firm monitoring their case won-loss-decline rate, how their cases were sourced, and the type of proposal received, and how they performed against their competitors. The third is from the risk management department of a multinational corporation measuring the amount of loss per incident by status and year.
When to Use a Scorecard
Scorecards are useful tools for planning and tracking progress towards goals. They help you to identify areas where you may need to improve performance and provide a way to measure how well you're doing against your strategic priorities. So you use a scorecard to see your actual performance compare to annual, quarterly, or monthly goals.
Scorecards are used to track progress against goals and objectives. They provide a snapshot of where you are now and help you understand if you are on course to meet your strategic plan. The people who need to use them the most are c-level executives who need to see where the organization is going, grasp the big picture, and ensure they're meeting or exceeding goals committed to the board. Departmental managers might get a version of the scorecard or an operational dashboard version to track their daily and year-to-date progress towards the goals are more likely scorecard people.
More Articles About Metrics Dashboards and Scorecards
BI Dashboard Software That Uses HTML5 - HTML5 is the replacement for Flash for interactive web-based applications. InetSoft offers an HTML5-based BI solution that is ideal for both desktop and mobile usage powered by a server-based application that can be hosted anywhere: on premises, in a private or public cloud, or by InetSoft at AWS. InetSoft's industry pioneering BI platform can support any department's dashboard needs. Interact with examples in the library...
Business Intelligence Leader Since 1996 - Application highlights include visually-compelling and interactive dashboards that ensure greater end-user adoption plus pixel-perfect report generation, scheduling, and bursting. InetSoft's patent pending Data BlockT technology enables productive reuse of queries and a unique capability for end-user defined data mashup. This capability, combined with efficient information access enabled by InetSoft's visual analysis technologies, allows maximum self-service that benefits the average business user, the IT administrator, and the developer. InetSoft solutions have been deployed at over 5,000 organizations worldwide, including 25% of Fortune 500 companies, spanning all types of industries...
Dashboard Management System to Consider - Looking for a good dashboard management system? InetSoft, a pioneer in self-service oriented dashboard software offers an easy to setup system for creating interactive dashboards and analyses. Our customers rate our service as top performing on G2.com. View a demo and try interactive examples. InetSoft's dashboard software provides users with the flexibility to make changes to dashboard data assets in real-time as the need arises. View the example below to...
Evaluate InetSoft's Drag and Drop Dashboard Builder - Are you looking for a good drag and drop dashboard builder? InetSoft's pioneering dashboard application produces great-looking web-based dashboard with an easy-to-use drag and drop designer. Get cloud-flexibility for your deployment. Minimize costs with a small-footprint solution. Maximize self-service for all types of users. No dedicated BI developer required. View a demo and try interactive examples...
Example from Dashboard and Balanced Scorecard Software - Are you looking for a balanced scorecard and dashboard solution for tracking key metrics and business performance? Since 1996 InetSoft has been delivering easy, agile, and robust business intelligence software that makes it possible for organizations and solution providers of all sizes to deploy or embed full-featured business intelligence solutions...
 |
Learn about the top 10 features of embedded business intelligence. |
Good Reporting and Dashboard Development Tool - Looking for a good reporting and dashboard development tool? InetSoft's pioneering dashboard reporting application produces great-looking web-based dashboards with an easy-to-use drag-and-drop designer. View a demo and try interactive examples. InetSoft's patent pending Data Block technology enables productive reuse of queries and a unique capability for end-user defined data mashup...
JavaScript Reporting Tool Example - You can add advanced interactivity to your dashboards by attaching scripts to components or events (e.g., Dashboard loading) Dashboard scripts use JavaScript syntax (ECMA-262) and support most standard JavaScript functions. The JavaScript function libraries are enhanced with additional functions that provide programmatic access to Dashboard properties and behaviors. The StyleBI scripting language is based on the ECMA-262 (JavaScript) standard. The scripting environment provides full access to all report elements, and can be used to perform actions on report initialization and loading, as well as handling ongoing user interactions...
Learn About Project Metrics Dashboards - Looking for tools to build a dashboard to track project metrics? InetSoft offers Web-based dashboard software with a drag and drop designer to create whatever dashboard you need. View a demo. Embedded Dashboard Table - InetSoft's dashboard software offers an embeddable dashboard table that facilitates the creation of interactive multidimensional reporting. Instead of creating a regular table from a query or data model, you can create a Data Table by manually typing values into the Worksheet. Such a table is called an Embedded Table. There are two ways to generate an embedded table...
More Samples from Balanced Scorecard Software - InetSoft's balanced scorecard software allows users to track key metrics in real time in order to achieve specific goals and keep the company on track. Balanced scorecards can provide critical updates as often as possible, tracking as many parameters (e.g., sales revenue) as needed. With this software, individuals can set the stage for what needs to be accomplished in the future, as well as lay out a plan for how to achieve that goal. These different parameters can be checked at regular intervals, called triggers, and against different conditions to make sure that company performance is on track. If performance is not on track, specified actions can be put into place such as email notifications, etc...
 |
View live interactive examples in InetSoft's dashboard and visualization gallery. |
Node Performance Metrics Dashboard - Looking for an application performance metrics dashboard tool? InetSoft's flexible dashboard application produces great-looking cloud-based dashboards with an easy-to-use drag-and-drop designer. Mash up your application performance data with any other inside or outside your enterprise. View a demo and try interactive examples. Tracking dashboards allow for a one-click representation of how your business is functioning at a particular point in time, without having to know how all the parts work together. This style of tracking dashboards allow for management to easily communicate between departments about how to shift focus to problem areas...
Researching Information Dashboard Design - Researching how to design information dashboards? InetSoft offers Web-based dashboard software that includes a drag and drop designer for creating impactful, interactive dashboards for enterprises and ISV's. Read articles below for more information. Aggregating Dashboard Data - Users can easily aggregate data and create comprehensive reports from different data sources using InetSoft's award-winning dashboard software. View the example below to learn more about the StyleBI solution. To define grouping and aggregation...
Resources for Performance Metrics Dashboards - Looking for performance metrics dashboard solutions? InetSoft offers Web-based dashboard software that enterprises can deploy quickly, and ISV's can embed easily into their own applications. Dashboard Vendor Demo - Searching for dashboard vendor demos? Since 1996 InetSoft has been a pioneer in the development of dashboard reporting software that is easy to deploy and easy to use. Build self-service oriented analytical dashboards quickly. View a demo and try interactive examples. InetSoft's analytical dashboard application is easy enough to be: Deployed in just weeks. Learned by end users with minimal training. Used by any executive without the aid of IT...
Sample from Balanced Scorecard Software - Are you looking for a balanced scorecard solution for tracking key metrics and business performance? InetSoft offers Dashboarding and Scorecarding Software that is robust enough to: attract the attention of executives satisfy the demands of power users adapt to organizations of all sizes...
 |
Read how InetSoft saves money and resources with deployment flexibility. |
Software for Impromptu Reporting - Today's business users are looking for quick and easy ways to create new reports or visualizations of their data. Rather than the old model of giving time and resource consuming requests to database analysts, IT and business managers are looking for self-service functionality to meet the demands for impromptu reports. As an innovator in reporting software since 1996, InetSoft has pioneered an evolution towards visualization-driven reporting in response to this need, and its award-winning software has been deployed at thousands of organizations worldwide and integrated into dozens of other application providers' solutions serving vertical and horizontal markets of their own...
Solution for Creating Online Visual Reports - Looking for software to create nice online visual reports? InetSoft's pioneering dashboard reporting application produces great-looking web-based dashboards with an easy-to-use drag-and-drop designer. View a demo and try interactive examples. Below are some examples of Visual Reports generated by InetSoft's Visual Reporting API. And following is documentation on using InetSoft's JavaScript-like API for programmatically generating charts...
Tips for Developing Scorecards - I am a huge believer in the incremental approach. You can start by understanding the vision and work on version 1 of the primary scorecard or dashboard. Deploy that to a hundred people. Then see what can be improved. Then roll out version 2 to the remaining thousands of people. So implementing an incremental approach to rolling out dashboards and learning from users along the away, that's definitely the way you want to approach to a BI project...
 |
Read the top 10 reasons for selecting InetSoft as your BI partner. |
Tools for Creating Multidimensional Dashboards - Looking for tools for creating 3D dashboards? InetSoft offers Web-based dashboard software that has been deployed at several thousand enterprises worldwide spanning several industries. For a commercial version, visit the Style Scope product page, and see examples, view a demo, and read customer reviews. A free option can be found at and https://www.visualizefree.com/. View information about InetSoft's agile dashboard creation software. Performance Measurement Dashboard - From conversion and turnover rates, customer profitability or financial metrics including revenue per employee and forecast...
What Are the Benefits of Data Mashup? - So why is InetSoft's data mashup so important? To get the full benefits of BI, users no longer need to burden IT with unnecessary change requests, work backlogs, and administrative overhead. InetSoft's unique brand of data mashup offers advantages that are head and shoulders above the competition, including: Better ROI from SOA, legacy data sources and future mashups A higher success rate of deployment due to higher end-user satisfaction, usage rates, and adoption rates A greater number of actionable learning made from enterprise data, generating business returns through greater sales or greater efficiency...


