InetSoft's New Release Democratizes Business Intelligence
New visualization capabilities enable easier deployment of more interactive multi-dimensional analytic dashboards
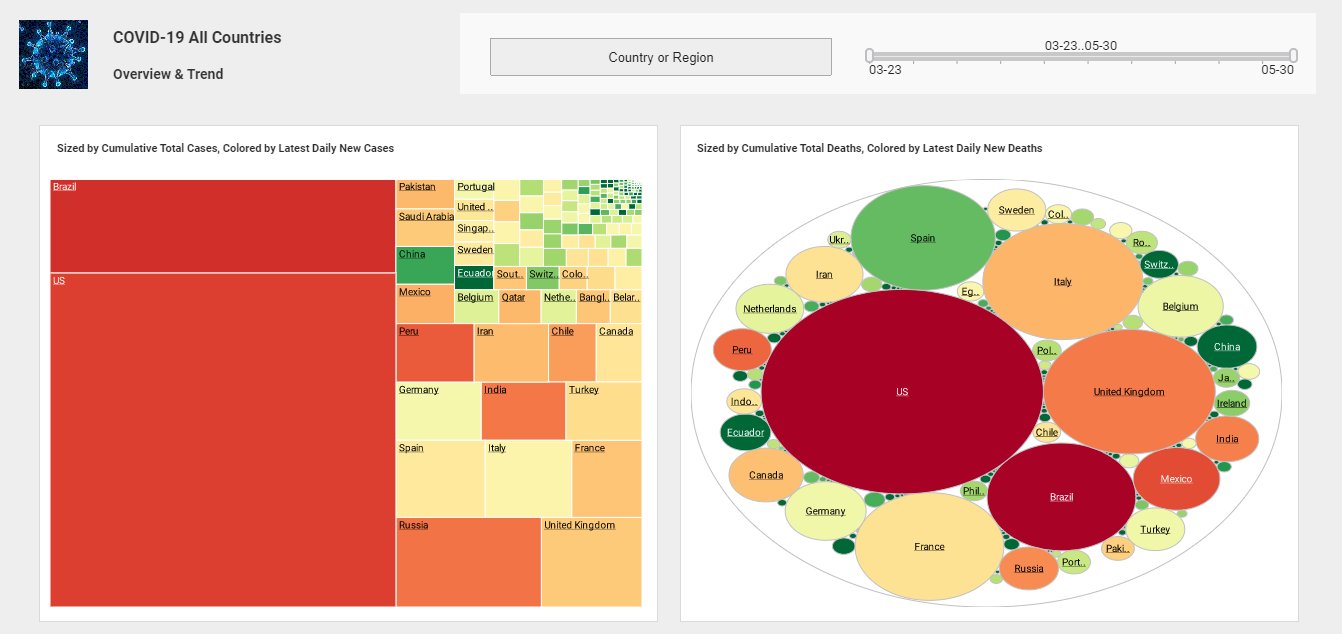
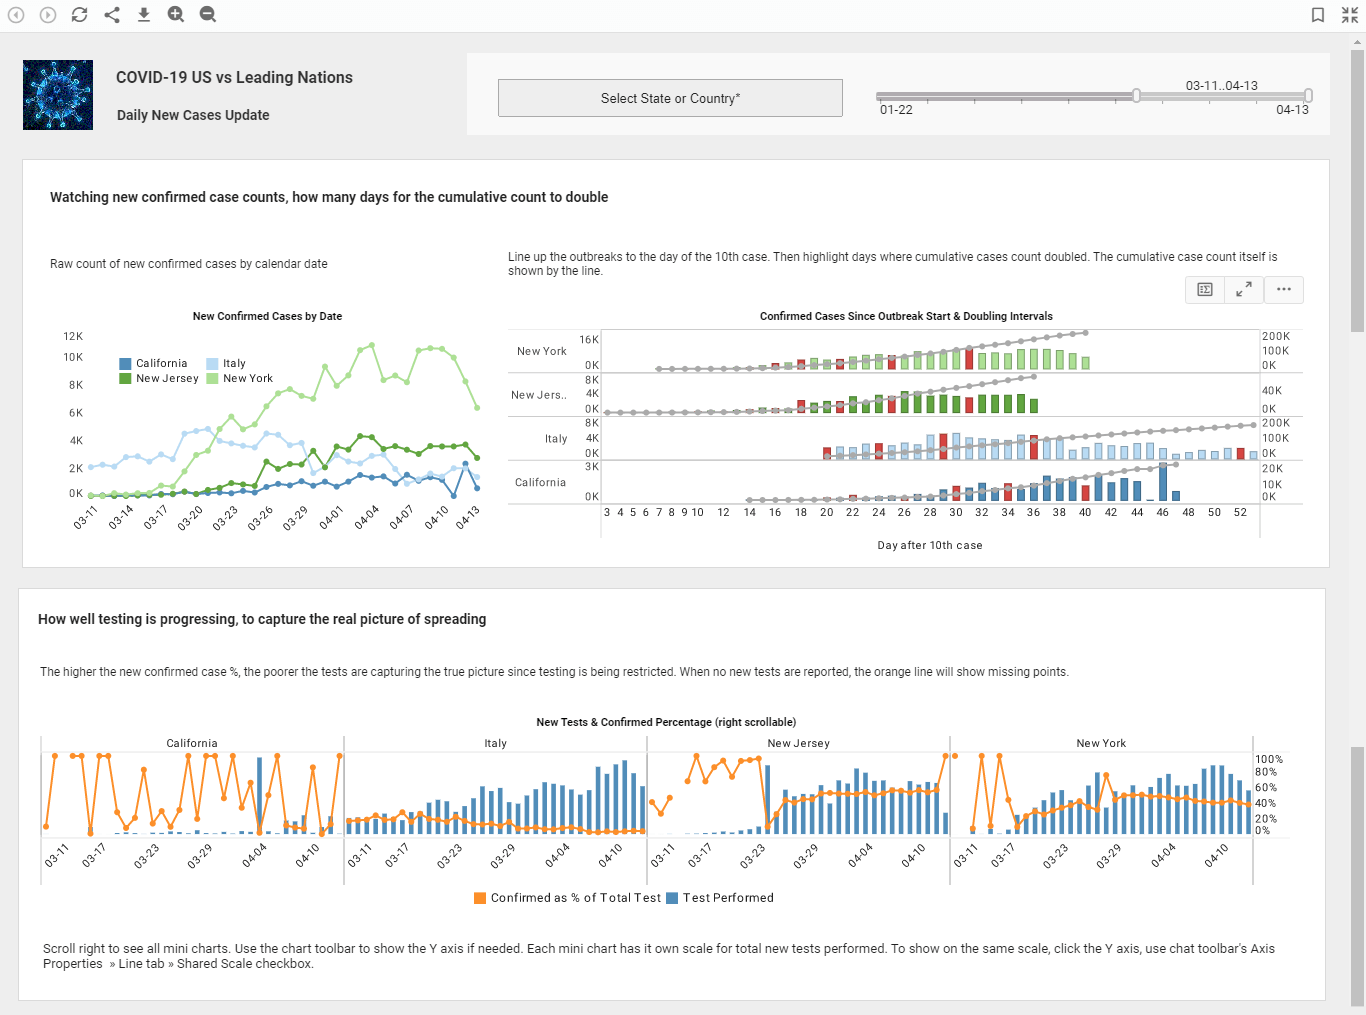
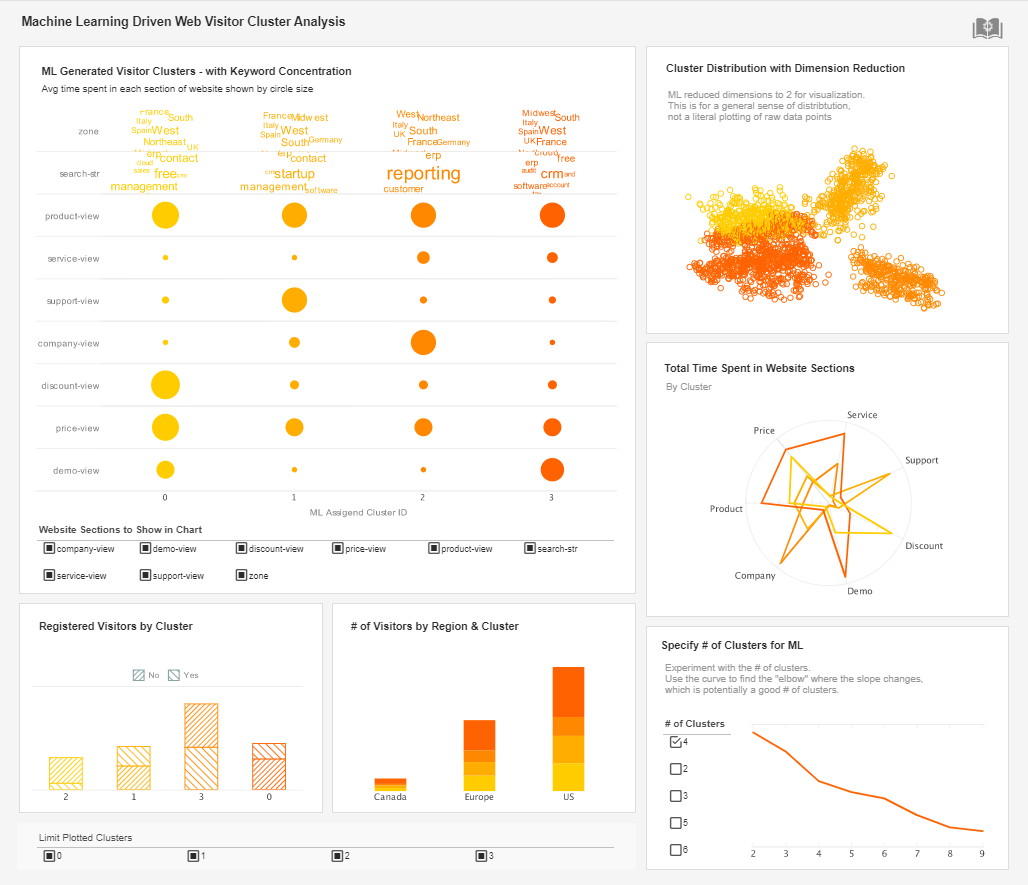
Piscataway, NJ - December 15, 2008 - InetSoft Technology (www.inetsoft.com), an innovator in dashboard, reporting and analysis solutions, today announced the launch of Style Intelligence 10.0. This major release features several advances in visualization capabilities. First, users can now make charts and graphs more information-rich, going from the standard two dimensions to four or more using coloring, sizing and stacked X/Y options. Secondly, users can enjoy brushing techniques where by selecting data points in one chart highlights related data points in accompanying charts.
For average business users, these new visualization features mean they can enjoy even more powerful, visually attractive interactive dashboards that deliver as much intelligence in one screen as traditional dashboards or reports would have delivered in dozens or hundreds of screens. An example of such an interactive dashboard might be for a sales manager looking at her pipeline who wants to identify the key opportunities on which to focus her assistance. In a single chart she can see all open deals plotted by win probability on one axis and projected close date on the other. For third and fourth dimensions, the data points representing each deal can be sized by dollar amount and color coded by account executive. Accompanying this chart can be simple drop-down lists and selection lists that expand the permutations of possible analyses exponentially. Other variables could be simply swapped in such as to color code, instead by product, or the data could be filtered to show opportunities in a certain sales region. While the possible analyses are many, the speed of finding answers is increased because of the simple point-and-click interface and information-rich graphical charting methods.
For business analysts or IT staff who support enterprise reporting and business intelligence functions, the new visualization capabilities come via an easy-to-use drag and drop tool that makes it possible to create such an interactive dashboard in minutes. Installing and deploying the Style Intelligence business intelligence platform is also designed to be easy. The average IT person with knowledge of enterprises databases can install the small-footprint, Java-based server application in any environment and configure it to access almost any open standards based data source directly; no data warehouse or ETL process is necessarily required. Assembling data elements from disparate data sources, including imported ones, in order to make data mashups is supported with a level of self-service unique to Style intelligence. In addition to a high-performance, highly flexible, yet secure data access engine, the application includes very powerful publishing tools for creating pixel-perfect production reports with robust scheduling, bursting, and archiving capabilities.
"While these visualization capabilities are not novel in business intelligence software, InetSoft's approach to delivering them is," states Mark Flaherty, Vice President of Marketing at InetSoft. "Others have pointed to visualization as the necessary catalyst to expand business intelligence to the masses, but we have realized that it's a two-step process. First, you need to empower the business or data analyst with easy-to-use tools and let them think through what kind of interactive dashboard the business users will gain insight from. And these analytic dashboards need to be designed well enough that they can almost be self-explanatory in how to use. Then, once the analyst shares these interactive dashboards with the business users, they can begin using them with little or no training because of their easy point and click interfaces which rely on easy to understand drop-down and selection lists."
InetSoft has been delivering award-winning software for 8 years running, offering easy, agile, and robust BI solutions that make it possible for enterprises of all sizes to deploy a fully-featured business intelligence solution that is very quick to deploy and easy for end-users to adopt. Highlights of the software include visually-compelling and interactive dashboards and pixel-perfect report generation, scheduling, and bursting. InetSoft's patent pending Data Block™ technology enables direct access to any open standards source, which means a data warehouse is not necessarily required, and any data manipulations can be shared and re-used with a simple drag-and-drop design tool.
For an online demo and free evaluation software, please visit www.inetsoft.com.
About InetSoft
InetSoft has earned its reputation of excellence as a leading global operational business intelligence solution provider
by delivering innovative, award-winning software and professional services for twelve years. InetSoft's
business intelligence software has been deployed at over 5,000 enterprises worldwide.
Contact
For more information, media and analysts may contact:
Mark Flaherty
InetSoft Technology Corp.
+1.732.424.0400 x 936
mark.flaherty@inetsoft.com
www.inetsoft.com
Click here to view the Version 10.0 Release Notes
Quotable
"First, you need to empower the business or data analyst with easy-to-use tools and let them think through what kind of interactive dashboard the business users will gain insight from..."
Visualization Examples


