InetSoft Technology's Business Activity Monitoring Software
Organizations today lack reliable end-to-end information regarding their business operations. A business can have a vast amount of data but this data is of little value if intelligent data cannot be extracted. This being said, data must be converted into meaningful information through the use of dashboards, allowing businesses to make strategic decisions, quickly address issues, continue with successful practices and take full advantage of any emerging opportunities.
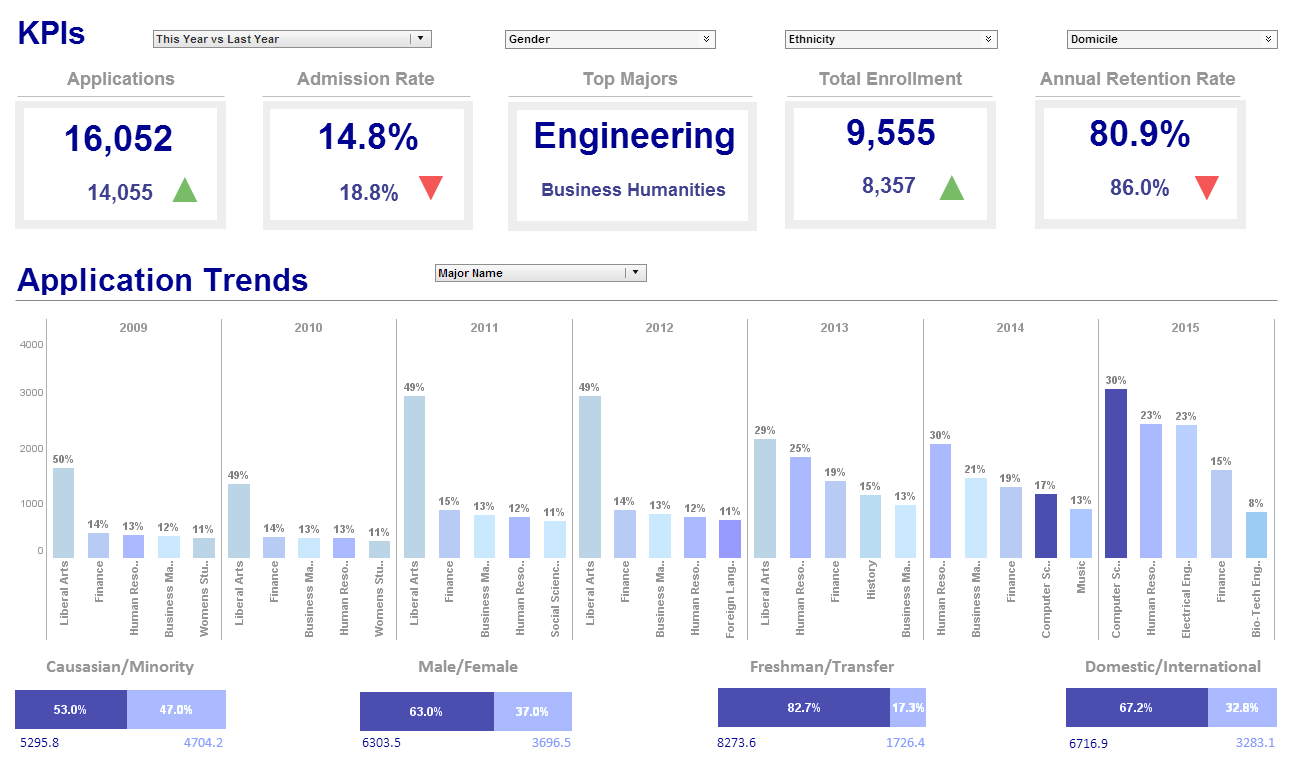
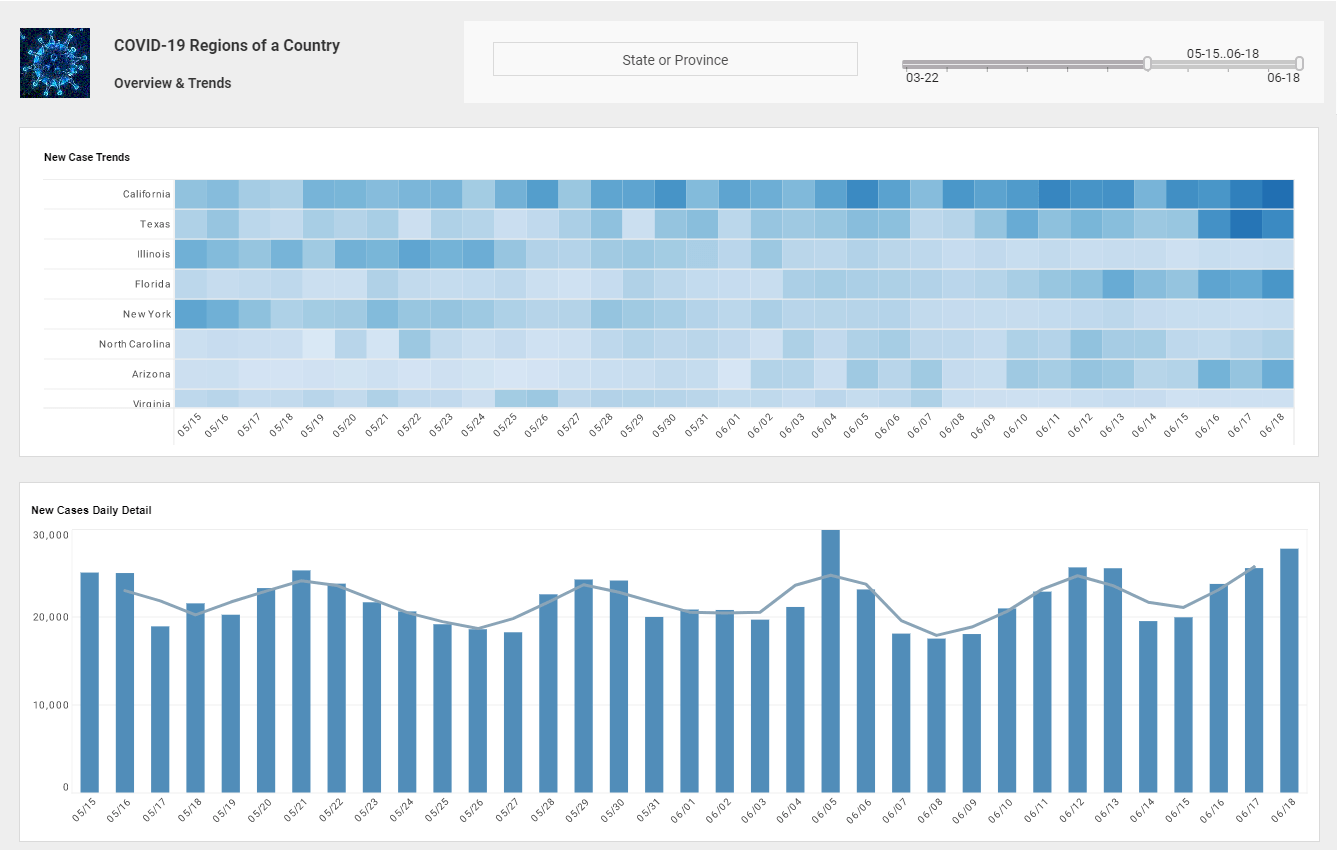
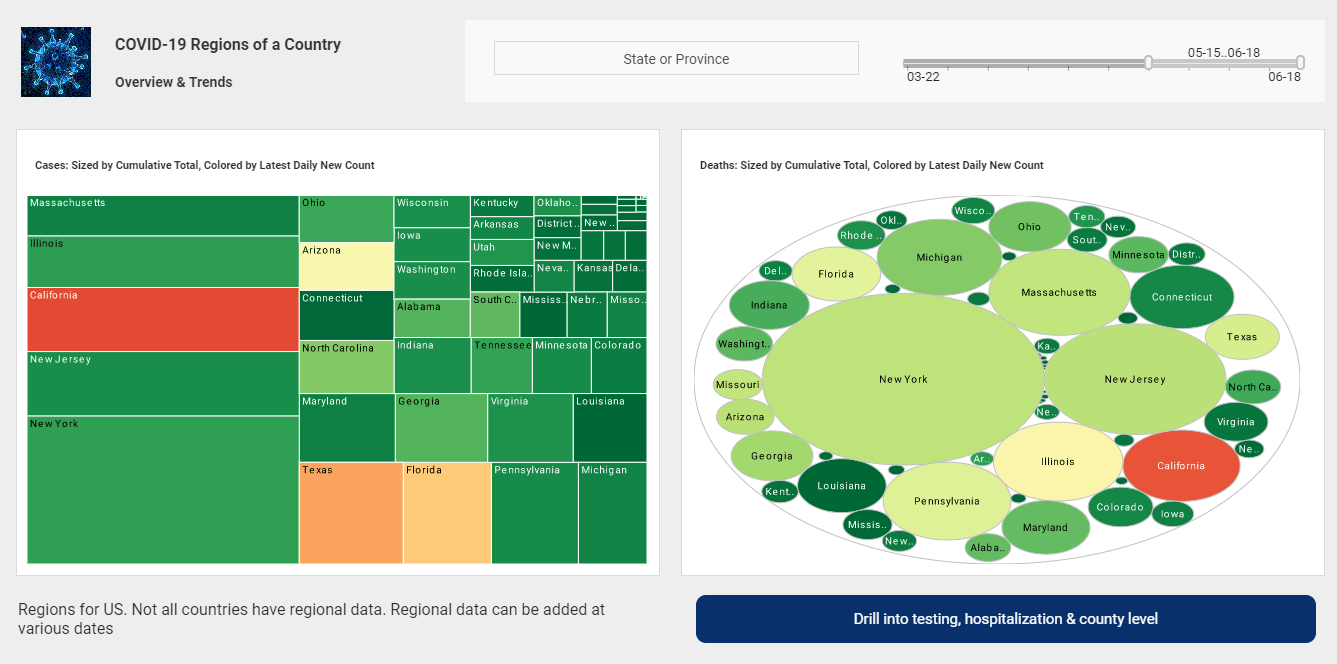
With InetSoft's Business activity monitoring software, monitoring any company's data is easy, safe and reliable. Self-service oriented analytical dashboards aid in defining and analyzing critical opportunities and risks to a business to maximize profitability and optimize efficiency. Executive dashboards provide an enterprise solution to provide upper management a summary of business activities on a real-time basis.
PDF reports mass produced with built-in customization for audience segments makes for efficient information publishing.
| #1 Ranking: Read how InetSoft was rated #1 for user adoption in G2's user survey-based index | Read More |
Simple BAM Software
Designed with ease-of-use in mind, the business activity monitoring software is simple to use for anyone. Learning to use the software requires minimal learning and even those with no IT skills whatsoever can create dashboards in no time. InetSoft's BAM software also allows users to set up custom business rules to be followed. There is the option for a notification engine, where users can be notified about problematic areas, trends and updates through multiple sources including email, social media, text message, voice message, and desktop alerts.
User-friendly BAM Software
BAM software diminishes the havoc of having to manually pull out data and the risk of missing important data in the process. With BAM, rules are predefined and automatically perform; canceling out human error. The software simply gathers relevant data (which can come from multiple sources) that can be meaningfully used, then processed to identify and categorize factors to specific concerns. Lastly, the data is analyzed and the results are displayed in a logical user-friendly interface for end-users to view and take appropriate action.
Complex event processing technology (CEP) processes high volumes of underlying technical events to obtain higher level business events. Overall, BAM boosts productivity and speeds up the process of organizing important from not so important data; therefore, ending the repetitive and tiring routine of constantly logging into a system and manually extracting data.
How Does the Paper Manufacturing Industry Use Business Activity Monitoring Software?
The paper manufacturing industry relies on Business Activity Monitoring (BAM) software to optimize operations, enhance productivity, and ensure profitability. Here's an in-depth look at how this industry leverages BAM software:
-
Production Efficiency Monitoring
- BAM software enables real-time monitoring of production processes. It tracks key performance indicators (KPIs) such as machine uptime, downtime reasons, production rates, and quality metrics. This information helps in identifying bottlenecks and inefficiencies in the production line.
-
Supply Chain Visibility
- BAM provides visibility into the entire supply chain, from raw material procurement to finished product delivery. It tracks inventory levels, lead times, and transportation schedules, allowing for better demand planning and inventory management.
-
Quality Control and Assurance
- BAM systems monitor quality parameters throughout the production process. It can flag deviations from quality standards, enabling immediate corrective action. This helps in reducing waste and ensuring that only high-quality products are shipped.
-
Energy Consumption and Sustainability
- BAM software helps monitor energy consumption across various stages of production. It identifies areas of high energy usage and supports initiatives for energy efficiency and sustainability, aligning with environmental regulations.
-
Maintenance and Asset Management
- BAM tracks the performance of machinery and equipment. It can generate alerts for preventive maintenance based on usage patterns or sensor data, reducing the risk of unplanned downtime and costly repairs.
-
Production Planning and Scheduling
- BAM provides insights into real-time production capacity and resource availability. This information aids in dynamic production scheduling, ensuring optimal utilization of resources and meeting customer demands.
-
Regulatory Compliance
- The paper manufacturing industry is subject to various environmental and safety regulations. BAM software helps in monitoring and documenting compliance with regulatory requirements, reducing the risk of penalties or legal issues.
-
Cost Analysis and Optimization
- BAM systems collect data on production costs, including labor, raw materials, energy, and maintenance. This information is analyzed to identify areas for cost reduction and process optimization.
-
Customer Order Tracking
- BAM enables tracking of customer orders in real time. It provides visibility into order status, estimated delivery times, and any delays. This information is crucial for customer communication and satisfaction.
-
Data Analytics for Decision-Making
- BAM software often includes advanced analytics capabilities. It can perform trend analysis, predictive modeling, and scenario planning, helping management make data-driven decisions for strategic growth and investment.
-
Performance Benchmarking
- BAM allows paper manufacturers to compare their performance against industry benchmarks and best practices. This helps in setting realistic performance targets and identifying areas for improvement.
-
Collaboration and Communication
- BAM systems often facilitate communication and collaboration among different departments and teams within the organization. This fosters a culture of transparency and cross-functional problem-solving.
-
Executive Reporting and Dashboards
- BAM software provides customizable dashboards and reports for different levels of management. These visualizations offer a snapshot of critical KPIs and performance metrics, allowing for quick decision-making.
 |
Read how InetSoft was rated as a top BI vendor in G2 Crowd's user survey-based index. |
More Articles for Researchers of BAM Sofware
Are There Any Pitfalls To Self-Service BI? - Well, yes, it can become overwhelming if not organized properly. We have seen folks overwhelmed by too much data. You may find that you have 2,000 KPIs the company tracks, so you have two thousand different dimensions available in the design tool...
Asset Data and Other Enterprise Data Mashups - InetSoft specializes in providing data mashups not only with financial data but also with a large variety of databases including, but not limited to: relational databases (JDBC), multidimensional databases, XML, SOAP, Java beans (POJO), EJB beans, flat files, Excel spreadsheets, OLAP cubes, and the proprietary data stores from JDE, SAP, PeopleSoft, and Siebel CRM...
Balance of Self-Service Analytics - The key and the question for me was the balance, the balance that you want to have more people with access to the data to do more analysis. Then you want to share that, and it becomes a bit counterintuitive. In a lot of governance perspectives, people are very concerned about providing unfettered access to data or wider access to data because people think that they'll get more bad answers on wrong data...
Contrasts Between Visualizations and Dashboards - Data presentation in an understandable manner is the fundamental goal of a visualization. In order to spot patterns, trends, and correlations in the data that may not be immediately apparent from a spreadsheet or database, visualizations are often utilized. They may be used to streamline complex data sets, enhancing accessibility for a larger audience...
Documentation for Setting Report Permissions - With InetSoft's reporting software, administrators can set report permissions that govern the access or limitations of specified users. View the information below to learn more about the StyleBI solution...
Examples of KPM's - To visualize how some common KPM's can be charted and analyzed in InetSoft's application look at the examples to the left. The Marketing Department of any products or services company needs to track leads as one of its KPMs. This screenshot shows the weekly count of the number of new leads generated. In addition, thanks to...
 |
View live interactive examples in InetSoft's dashboard and visualization gallery. |
How to Create a Chart Using Images - Begin by importing the data set into a Data Worksheet (or by setting up a data source). The sample data we use here is from the Olympics Website and has this form...
How To Create Prototype Reports - A prototype is a skeleton report that can be used as the basis for creating new reports using an Ad Hoc Wizard or using the Ad Hoc editing tools. Once a report is registered as a prototype, it will be available when a user creates a new report using the 'Report' button under the Design tab in the Portal...
How to Make a Web Chart with an API - Do you want to learn how to make a web chart with an API? InetSoft provides easy to use web chart graphing API for developers to render charts programmatically. View a demo and get a personalized demo...
Instructions for Formatting Dashboards - The 'Format' dialog box provides options for changing the visual appearance of elements and their representation of data. To open the 'Format' dialog box, right-click on a component and select 'Format' from the context menu...
Monochromatic Scaling by Value - Rather than randomly varying saturation and brightness, a more structured approach to monochromatic color schemes involves building value scales. To do this, let's first understand the concept of value itself. Value refers to the lightness or darkness of a particular color...
 |
Read how InetSoft saves money and resources with deployment flexibility. |
Self-Service Google Calendar Dashboards - Visualization dashboards are the most intuitive way to understand project information. However, not all dashboards are created equal. InetSoft's web app can easily connect to Google data to create self-service dashboards with rich built-in interactivity and customization...


