What Makes BI State of the Art?
To us, a state of the art BI solution is one that can analyze and explore massive amounts of data, providing actionable insights at a competitive price. In order for your organization to get the full benefit from your data, all departments should be able to access and explore data relationships, enabling better business decisions.
InetSoft's powerful and robust BI platform, StyleBI, pulls all necessary data from multiple data sources for dashboards, visualizations, and automated reporting. InetSoft's data mashup engine can pull data from an almost unlimited number of different data sources, enabling you to create a single source of your organization's information.
(see All Data Sources for the possible data mashups.)


Turn Data into Insights
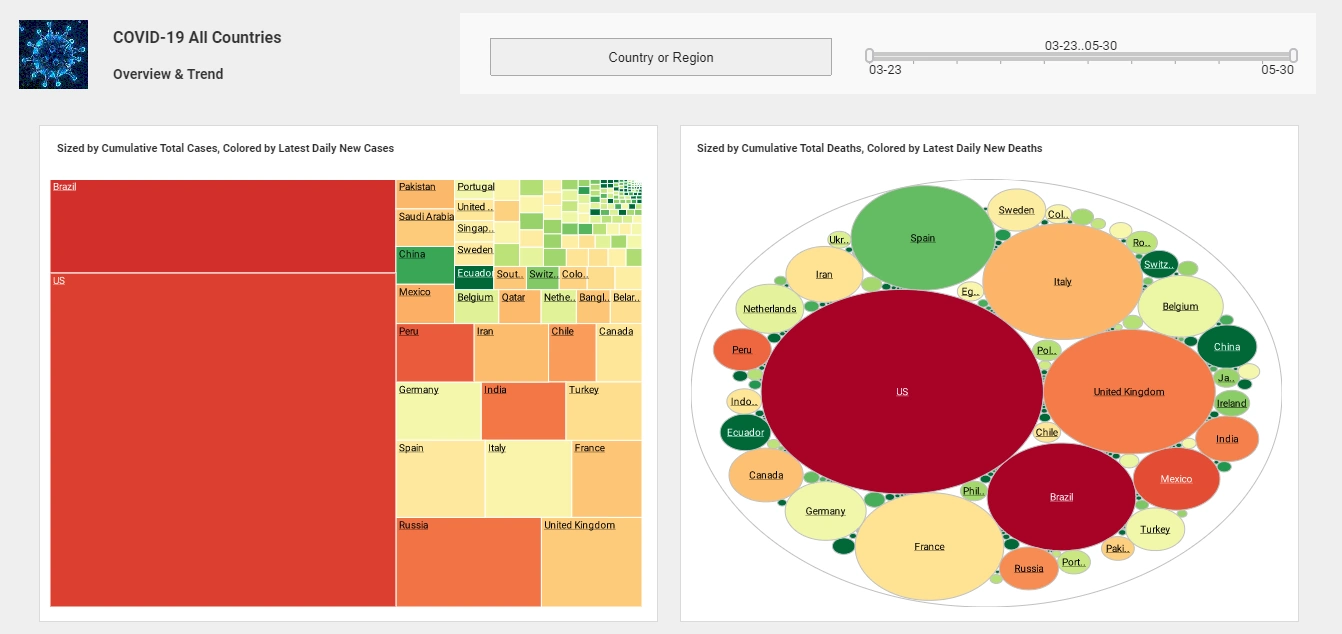
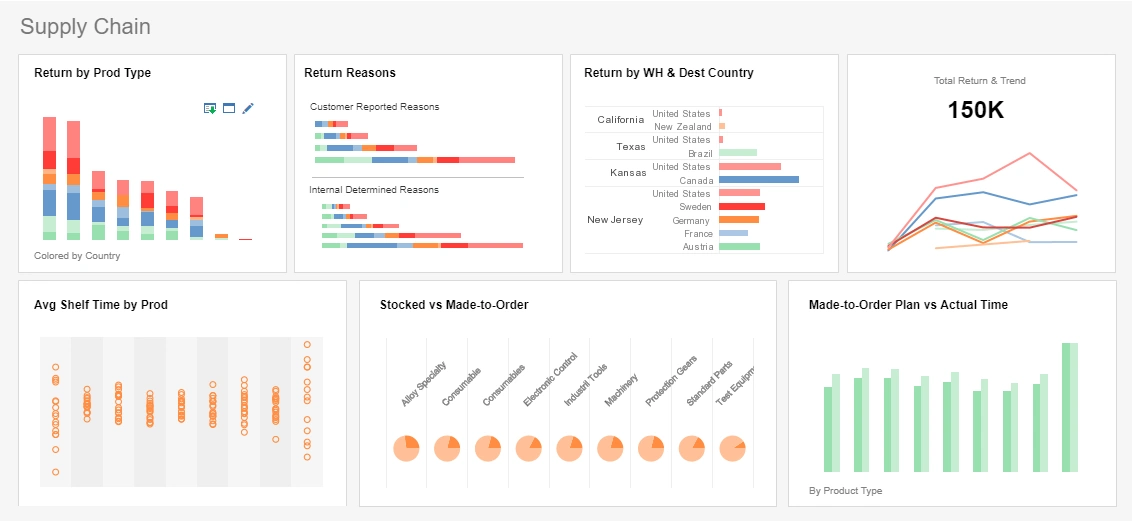
InetSoft's solution enables the creation of eye-popping dashboards that can display a large number of KPIs in a visual, intuitive way. Since the platform is web based, these performance dashboards can be accessed through desktops, laptops, mobile phones, and tablets, giving your employees access to valuable insights wherever they go.
The ease of access and customizability of StyleBI enables the creation of dashboards and reports that are tailored for each department, all accessible on a single server or cluster. Even non-technical users can gain insights from their data; only Excel-level skills are needed for building and customizing dashboards.
InetSoft's ease-of-use will give your employees more time for other projects, increasing the overall efficiency of your organization.
About InetSoft
Since 1996 InetSoft has been delivering easy, agile, and robust business intelligence software that makes it possible for organizations and solution providers of all sizes to deploy or embed full-featured business intelligence solutions. Application highlights include visually-compelling and interactive dashboards that ensure greater end-user adoption plus pixel-perfect report generation, scheduling, and bursting.
InetSoft's patent pending Data Block technology enables productive reuse of queries and a unique capability for end-user defined data mashup. This capability combined with efficient information access enabled by InetSoft's visual analysis technologies allows maximum self-service that benefits the average business user, the IT administrator, and the developer. InetSoft solutions have been deployed at over 5,000 organizations worldwide, including 25% of Fortune 500 companies, spanning all types of industries.

10 InetSoft Articles About BI
-
State Of The Art
This article presents what “state of the art” means for business intelligence and positions InetSoft’s StyleBI as a modern BI platform. It describes how the system can pull data from diverse sources and deliver dashboards accessible across devices. It also emphasizes that ease of use and mashup capabilities are key differentiators.
-
Specify State As Variable
This piece shows how to define a “State” variable in InetSoft’s dashboard design so that all relevant worksheets can filter by it. It walks through naming, scoping, and default value choices when creating a global variable. It highlights reuse of that variable across multiple data worksheets.
-
New Selection List Called State
The article describes how dragging a ‘State’ field in a Data Block into a Viewsheet creates a Selection List named “State.” It then shows how that selection list can be used interactively to filter data and drive linked selections. It illustrates a dynamic end-user filtering mechanism in dashboards.
-
State Is Chosen From Dropdown
This article gives a walkthrough of drill-down reports where you first choose a state in a dropdown, and then subsequent dropdowns populate based on that state. It explains how hyperlink linking and parameter passing supports the drill-down logic. It’s a good reference for building cascading filters in InetSoft reports.
-
Merge State And Zip
This tutorial explains how to merge the ‘state’ and ‘zip’ fields into a single combined column via expression syntax. It also covers how to create filtered queries like `company_name@state:NJ` to filter rows by state. It highlights using expressions and field filtering in query definitions.
-
Column Contains State Abbreviations
This article discusses grouping logic in dashboards, noting that a column may contain state abbreviations like CA, NY, WA. It describes default grouping by distinct values and the ability to customize via named grouping rules. It’s helpful when visualizing by geographic regions in dashboards.
-
Parameter Sheet Has State Menu
This article describes how to parameterize reports with menus for ‘State’ followed by dependent menus such as ‘City’. It covers how to order controls so that the state selection comes first and triggers filtering of subsequent menus. It’s useful for designing interactive parameter-driven reports.
-
State Column To Viewsheet
In this tutorial, dragging the ‘State’ column into a Viewsheet creates a Selection List and the article shows how to refer to the selected state in scripting (e.g. `selectedObject`). It also demonstrates use of conditional scripts enabling or disabling controls based on whether “State” is selected. It gives insight into dashboard scripting involving state inputs.
-
Highlight Entire State Layer
This piece explains how maps in InetSoft dashboards can highlight geographic layers — for example, an entire state or just cities within the state — based on value thresholds. It shows use cases of shading states differently depending on aggregated metrics. It’s useful for choropleth and map visualizations keyed to states.
-
State Field On Viewsheet Grid
This article describes agile dashboards where dragging ‘State’ from a Data Block into a grid creates a state-based filter or selection list. It gives a use case of multi-filter interactions (e.g. State then Company). It demonstrates how agile dashboard design handles state-level filtering dynamically.