Powerful Tools for BI Reporting
Are you searching for better tools for reporting? Do you want to move past static paginated reports?
Deliver highly graphical, visually appealing, and interactive views into your data with InetSoft's Web-based visualization-driven reporting software.
As an innovator in reporting software since 1996, InetSoft has pioneered this evolution towards visualization-driven reporting, and its award-winning software has been deployed at thousands of organizations worldwide and integrated into dozens of other application providers' solutions serving vertical and horizontal markets of their own.
Try a free evaluation copy of StyleBI, InetSoft's all-inclusive business intelligence software platform

Why InetSoft?
InetSoft's performance dashboard application is easy enough to be:- Deployed in just weeks
- Learned by end users with minimal training
- Used by any executive without the aid of IT
- Adaptable to changing data and business needs
- Used for data exploration through visualization
- Capable of maximum self-service
- Attract the attention of executives
- Meet the demands of power users
- Scale up for organizations of any size
Evaluate StyleBI from InetSoft. It's Easy. Agile. & Robust.
Register for more info and free software software
How Do Actuaries Use Tools for BI Reporting?
Actuaries use BI reporting tools to perform various tasks such as:
- Creating and visualizing input tables for financial models and regulatory reports.
- Analyzing data from internal and external sources to learn about market trends, customer demographics, and risk factors.
- Automating and streamlining month-end, quarter-end, and year-end reporting tasks.
Some of the most popular BI reporting tools used by actuaries are InetSoft, Tableau, Power BI, R, and Python. These tools allow actuaries to create interactive dashboards, perform advanced statistical analysis, and integrate data from multiple sources.
What Kind of Analytics Do Actuaries Perform?
Actuaries create risk categories and design models to minimize the damage when undesirable events do occur. Actuaries also help make strategic decisions and communicate solutions for complex financial issues.
Actuaries can work in various types of companies, such as insurance, consulting, government, hospitals, banks, and investment firms. They typically specialize in one field of insurance, such as health, life, property, casualty, or pension. Actuaries also perform actuarial analysis, which is a form of asset-to-liability analysis that ensures they have the funds to pay the required liabilities.
Some of the analytics initiatives that actuaries are involved in are marketing and distribution, pricing and underwriting, claims and fraud, and customer retention and loyalty. Actuaries use data from various sources and apply advanced statistical techniques to provide insights and recommendations for these initiatives.

Cool Actuarial Analytics Examples
An actuary’s job is basically turning uncertainty into math, so an “interesting” analysis is usually one that reveals hidden risk or weird human behavior. Here are some genuinely cool examples actuaries work on:
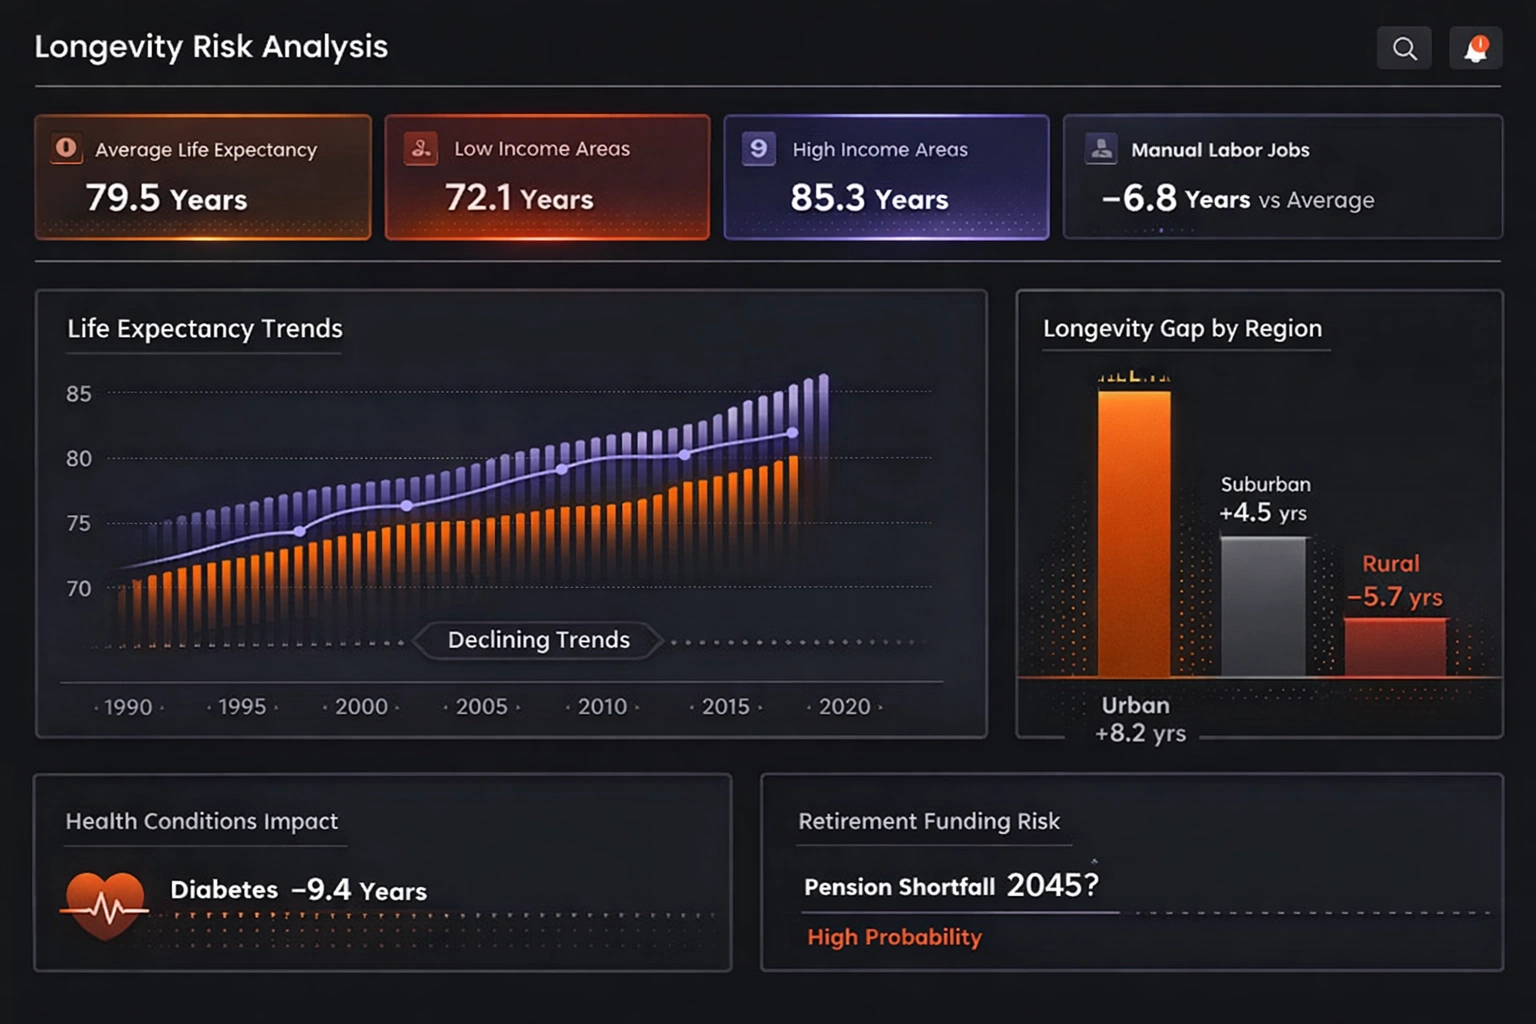
1. Longevity Risk Analysis
“How long are people really going to live?”
They analyze mortality trends to predict:
- How long retirees will collect pensions
- Whether life expectancy is increasing or stalling or reversing
Differences by:
- ZIP code
- Income
- Occupation
- Education
Example insight:
People in wealthier areas may live 10+ years longer than people in poorer areas — which massively affects pension costs.

2. Crash Risk vs. Behavior
“What behaviors statistically make you dangerous?”
They analyze insurance claims vs:
- Speeding
- Night driving
- Phone use
- Vehicle type
- Age & commute length
Example result:
A 22-year-old who drives 40 miles a day at night has a far higher expected loss than a 22-year-old who drives 5 miles in daylight.
This directly feeds into pricing models for auto insurance.
3. Disease Cost Forecasting
“What will diabetes or cancer cost society in 20 years?”
They model:
- How many people will get a disease
- How long they’ll live with it
- How expensive treatments will be
Used for:
- Health insurance premiums
- Government healthcare budgets
- Drug pricing
This is like financial weather forecasting for health.

4. Catastrophe Modeling
“What’s the chance this city gets wiped out financially?”
They model:
- Hurricanes
- Floods
- Earthquakes
- Wildfires
And estimate:
- Expected damage
- Worst-case losses
- Probability of total ruin
Example:
“There is a 1-in-250 chance this region experiences $80 billion in insured losses this year.”
That drives:
- Reinsurance pricing
- Building codes
- Whether insurers will even operate in that area
5. Pension Fund Survival Analysis
“Will this pension run out of money?”
They simulate:
- Investment returns
- Retirement rates
- Salary growth
- Death rates
They ask:
“What’s the probability this pension fund is broke by 2045?”
It’s basically stress-testing the future.

6. Human Weirdness Detection
“Are people gaming the system?”
They analyze:
- Fraud patterns
- Claim timing (why do accidents spike Mondays?)
- How incentives change behavior
Example:
Workers’ comp claims mysteriously rise right after layoffs.
Actuaries love this stuff because it mixes psychology + math + money.
A Truly Fun One
Some actuaries study:
How long people live after winning the lottery
Because sudden wealth changes:
- Health behavior
- Stress
- Social environment
And surprisingly… results aren’t always positive.

More Articles About Using Tools for BI Reporting
4 Tips for Good Report Building - Ask the report user what they are looking for. It's always a mistake to just assume you know what report users want. 2. Iterate the report development with the report user. Even for people who know their business very well, it is difficult for them to fully know they want in a report upon the first request. Let them see the first draft, and that will spark new ideas. 3. Make it look attractive. People enjoy looking at things that are pleasing to the eye and shun outdated looking or sloppy looking formats. 4. Use an interactive reporting platform. Build in self-service tools like date range selectors and drill-down selection lists so users can answer even more unanticipated questions...
Best Reporting and Dashboard Development Tool - Looking for a good reporting and dashboard development tool? The last, and arguably most important, step in the report process is the delivery. If a user does not receive the report when they need it, in a viewable format, the entire development process was for nothing...
Best Tools for the Beginner Data Analyst - Modern solutions are useful to beginner data analysts to learn and carry out analytical work effectively. There are different BI analytical tools that they can use in order to gains skills fast and start working as analysts. When choosing analysts tools, beginner analysts should focus on tools that are open-source and used by a large community. This makes it easy for beginners to get insights into any problem they might encounter while learning how to use the data analyst tool. Another important feature for a data analysis tool is the initial cost of the tool. Beginners need to choose tools that are open-source to ensure they save on expenses...
Evaluate InetSoft's Apache Business Intelligence Tool - Looking for a good business intelligence tool to run on Apache? The adoption of Apache Spark/Hadoop as InetSoft's big data infrastructure updates the method of scaling up for larger data sets, regardless of data source, and larger user populations from a proprietary clustering implementation to the very popular open standards based one developed by Spark...

Firebird Database Reporting Tool - Looking for a good solution for Firebird dashboard reporting? InetSoft's reporting software is a robust platform that allows users to localize their report pdf characters to suit regional needs. View the information below. Now its powerful reporting engine and sophisticated design tools enable enterprise-class real time reporting that meets the demands of sophisticated report consumers...
Free Reporting Tools for Excel Data - There are three free reporting tools for Excel data to suggest. All of them are cloud-based, meaning there is no software to download. 1. The first is Visualize Free. Register any address. Upload your spreadsheet from any Microsoft version and use the drag and drop designer to create interactive and paginated reports. It is best for ad hoc or one-time report projects...
Mashup Your Agile Business Data - InetSoft offers an end-user defined data mashup capability for reports and dashboards. Users can combine fields from different data sources, and can also import external data sources, such as spreadsheets, to create new combination datasets. InetSoft's drag and drop viewsheets and data worksheets enable dashboards to be modified and created easily, and even facilitate the joining of data sources without any SQL needing to be written...
Operations Reporting Tool for Prometheus - Looking for a good solution for Prometheus dashboard reporting? Mashup your EAM and operations data with other enterprise data. Reporting has always been tightly coupled to everyday business activities. As a result, reporting requirements tend to change very often. Traditionally, when such changes occurred, you were forced to rely on developers or IT staff to revise your reports to meet the new requirements...

Pioneering Reporting System Tool - Looking for a good reporting system tool? Professional designers can easily personalize reports with parameters. Data level security models can be specified by user, group, or roles. Once specified, business users accessing the same report will get reports tailored according to permission and business rules...
Reporting Tool for Insightly CRM - Looking for a good solution for Insightly dashboard reporting? InetSoft's pioneering BI application produces great-looking cloud-based dashboards with an easy-to-use drag-and-drop designer. View a demo and try interactive examples. An effective BI solution combines state of the art performance with accessibility. Whether you're a traveling executive or an outsourced employee, you still need access to valuable, real-time information...
Report Designer Configuration - Basic properties of Report Designer can be specified in the 'Designer Configuration' dialog box. These properties include the locations where Report Designer looks for database and resource information, the appearance of the Report Designer interface, and Report Designer's auto-save behavior...
Selecting a Reporting Tool for Startups - Looking for the best startup reporting tool? In order to increase revenue, a company must foster effective marketing strategies based on the CRM reports and ensure end initiatives that are performing poorly. However, in order to do that it is critical to have an application implemented that allows for the easy understanding and interpretation of the CRM data...

Solution For Inventory Reporting - Looking for a good solution for inventory reporting? Visual Analytic Reports & Online/Offline Document Reports. Easy Start and Rapid Deployment with Free Dedicated Assistance. Bring reporting software to your data, in-cloud or on-premise...
Tools for Dashboard Developers - Looking for good dashboard development tools? InetSoft's white label friendly solution gives you the ability to add interactive dashboards to your own branded software. For businesses that offer web services who want to add dashboards and reports, InetSoft's application can be integrated into any cloud-based app. InetSoft offers visualization driven dashboard tools compatible with SQL Server housed data and many other data sources...
Try InetSoft's Web Based Reporting Tool - Are you looking for the best web based reporting tool? If you also want interactive dashboarding and data mashup then look at InetSoft's flagship business intelligence software - StyleBI. This process involves taking large, disparate datasets and presenting them visually through graphs, charts, and various other...

Visualizations That Communicate for BA's - Since InetSoft's StyleBI is web-based, communicating the state of an organization to users in many locations is now easier than ever. The user friendly reporting engine enables the easy generation of pixel perfect reports that help define and monitor the metrics and status of an enterprise. Anyone within the organization, from stakeholders to partners, have the ability to share and view real-time visualizations and business information. The software can also be accessed through any web browser and mobile device. With Style Intelligence implemented, reports and information can be shared with any locations that are given access...