How an Industrial Laundry & Textile Service Company Upgraded From Mixpanel to InetSoft for Its Business Intelligence Balanced Scorecard Solution
In the industrial laundry and textile services sector, operational precision is everything. Companies must manage massive volumes of linens, uniforms, sterile textiles, and specialty fabrics while meeting strict turnaround times and regulatory requirements. When one such company realized its existing analytics stack—centered around Mixpanel—could no longer support its Balanced Scorecard needs, it began searching for a more flexible, enterprise‑grade business intelligence solution. The organization ultimately chose InetSoft, a decision that transformed its ability to monitor performance, optimize operations, and scale analytics across its facilities.
Mixpanel had originally been adopted to track digital interactions within the company’s customer portal and route‑management application. While it excelled at event‑based analytics, it struggled to integrate operational data from washers, dryers, RFID scanners, fleet telematics, and ERP systems. The Balanced Scorecard framework required a unified view of financial, operational, customer, and learning metrics—something Mixpanel’s architecture was not designed to deliver. As the company expanded into new service regions and added more automated equipment, the limitations became increasingly disruptive.

The first major challenge was data integration. Industrial laundry operations rely on dozens of systems: plant automation software, route optimization tools, inventory tracking, compliance logs, and customer billing. Mixpanel could not blend these sources without extensive custom engineering, forcing analysts to manually stitch together spreadsheets each week. InetSoft’s data mashup engine eliminated this bottleneck by allowing real‑time blending of ERP data, machine telemetry, and customer service metrics in a single semantic layer. This shift alone reduced reporting preparation time by more than 70 percent.
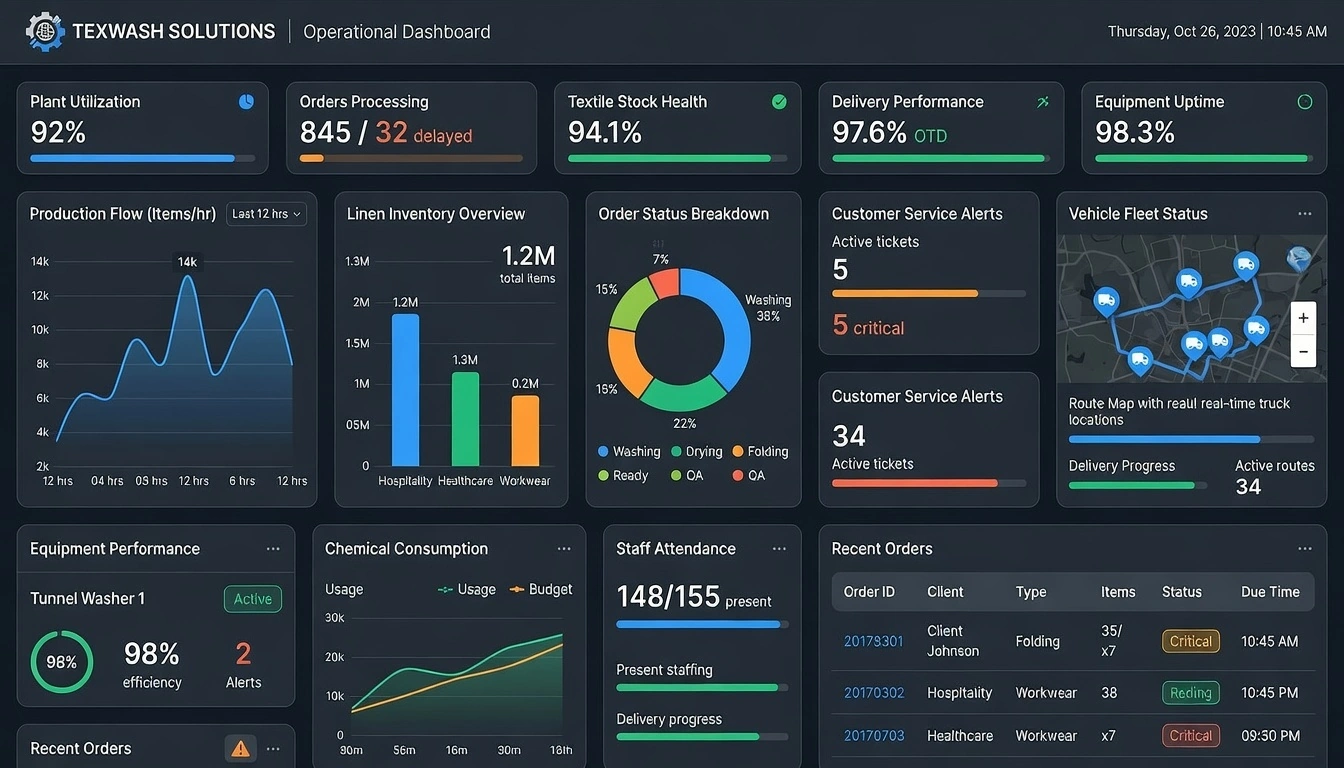
Another pain point was the lack of true operational dashboards. Mixpanel’s visualizations were built for product analytics, not industrial KPIs like load efficiency, machine utilization, contamination events, or textile lifecycle tracking. InetSoft’s interactive dashboards allowed the company to build plant‑level and route‑level scorecards that updated automatically throughout the day. Supervisors could drill from high‑level KPIs into specific machines, shifts, or customer accounts, enabling faster root‑cause analysis and more proactive decision‑making.
The Balanced Scorecard framework also required a structured approach to performance management. Mixpanel’s event‑driven model made it difficult to create consistent, governed metrics across departments. InetSoft’s Data Block technology solved this by centralizing business logic and ensuring that every dashboard and report used the same definitions for turnaround time, cost per pound, delivery accuracy, and textile loss rates. This consistency improved trust in the data and aligned teams around shared performance goals.
One of the most transformative improvements came from InetSoft’s scheduling and automated distribution features. Previously, plant managers received weekly scorecards as static spreadsheets compiled by analysts. With InetSoft, the company set up automated PDF and Excel deliveries for each facility, each tailored with row‑level security so managers only saw their own data. This automation freed analysts to focus on optimization projects rather than repetitive reporting tasks.

Mobile accessibility was another critical factor. Route supervisors and field service managers needed real‑time visibility into delivery accuracy, customer complaints, and fleet performance while on the road. Mixpanel’s mobile experience was limited, but InetSoft’s responsive dashboards allowed these teams to access Balanced Scorecard metrics from tablets and smartphones. This improved communication between plant operations and field teams, reducing delays and improving customer satisfaction.
Security and compliance also played a major role in the upgrade. Industrial laundry companies serving healthcare and food processing clients must adhere to strict regulatory standards. InetSoft’s row‑level security, role‑based access control, and integration with Active Directory ensured that sensitive customer and compliance data remained protected. Mixpanel’s permissions model, designed for product analytics teams, could not provide the same level of granularity or enterprise governance.
As the company continued its digital transformation, it also needed a BI platform that could scale. Mixpanel’s pricing model and data volume constraints became increasingly costly as the company added more IoT‑enabled equipment and expanded its service footprint. InetSoft’s flexible deployment options—on‑premises, private cloud, or hybrid—gave the company control over performance, cost, and data residency. This flexibility ensured that analytics could grow alongside the business without unexpected expenses.
The transition to InetSoft also unlocked new opportunities for predictive analytics. By integrating machine telemetry and textile lifecycle data, the company began experimenting with predictive maintenance models and loss‑rate forecasting. These insights helped reduce equipment downtime, extend textile lifespan, and improve overall operational efficiency. Mixpanel lacked the ability to incorporate these advanced data sources, making InetSoft a far more future‑proof solution.

Perhaps the most significant impact was cultural. With Mixpanel, analytics were siloed within the digital product team. With InetSoft, the entire organization—from plant supervisors to executives—gained access to a unified Balanced Scorecard environment. This democratization of data fostered a performance‑driven culture where decisions were based on real‑time insights rather than intuition or outdated reports. Teams became more aligned, more accountable, and more proactive in addressing operational challenges.
In the end, the upgrade from Mixpanel to InetSoft represented more than a technology change—it was a strategic shift toward enterprise‑wide intelligence. The industrial laundry and textile service company now operates with a level of visibility and control that was previously impossible. Its Balanced Scorecard is no longer a static document but a living, dynamic system that guides daily operations and long‑term strategy. InetSoft’s flexibility, data integration capabilities, and robust governance framework made it the ideal platform for a complex, high‑volume industry where precision and reliability are essential.
As the company continues to expand, InetSoft provides the foundation for scalable analytics, continuous improvement, and competitive differentiation. The move away from Mixpanel has empowered the organization to fully leverage its operational data, transforming it into actionable intelligence that drives performance across every facility and service route. For an industry where timing, compliance, and efficiency define success, InetSoft has become an indispensable partner in achieving operational excellence.

Articles about Business Intelligence and Balanced Scorecard Frameworks
Below you may find useful resources about InetSoft's business intelligence tools that make designing balanced scorecards quick and easy:
Free and Commercial Business Intelligence Products - InetSoft offers an Operational BI platform that features visualization-driven: reporting, dashboards, and analytics. It is backed by Data Block technology that provides user-defined data mashup and transformation, and performance benefits like streaming, caching, and materialized view pre-aggregation...
Free Visual Analysis Tool - Are you looking for an appication that can track and display information through point-and-click, easy to understand visual analyses, without spending big? Are you trying to organize and report your company's information in the form of dashboards and scorecards? Are you looking for ways to easily integrate company information from multiple data sources, for more in depth business analysis? If so, InetSoft's StyleBI Agile Edition may be just the solution you're seeking. InetSoft's StyleBI Agile Edition is a free easy to use version of InetSoft's leading-edge data visualization application. Designed for business user, Scope Agile is perfect for individual analysts or departmental workgroups, allowing users to quickly share business information and insights with team members. StyleBI Agile Edition's simple, intuitive interface ensures that you do not have to be a Tech or IT professional to be able to create impactful and meaningful dashboards for your business...
Future of Applied Business Intelligence - What do I see in the future of applied business intelligence? Well, I think business intelligence is growing exponentially as a business. The software business, the technology business itself and then also the all the numbers of people that are starting to get educated in the use of the tools and actually the management of the data and the reduction of cost has swell to a much larger community of people around the world using -- predicted by AMR research today at lunch here at The Partners Conference in Las Vegas by an analyst who said it's about $57 to $58 billion business this year. That’s a huge number. It is a huge number, and the number I saw just two or three years ago was $19-20 billion. Now if you consider that let's talk about four or five ways that this is going to change over the next four or five years aside from the infrastructure and data management issue, the first thing that's going on very, very clearly is BI is becoming pervasive. Companies are now no longer just doing finance and marketing and sales. They are doing finance, data warehousing and business intelligence against customers service, order satisfaction, and loyalty. This is what we to call the annuity business that's there and will be there if you treat your customers well. The service business, the delivery business, education, online, the tracking systems that are in many companies now, not only at FedEx and those kinds of companies, but even the railroads are doing tracking now of the product and car service...
Gap Between Business Intelligence Requirements and Traditional BI Solutions - From what I have seen in the last 25 to 30 years is that now there is this really interesting opportunity in the BI market. Well it depends on how you look at it. If you are a vendor or consultant you see it as an opportunity. If you practitioner of a business intelligence you see this as a gap that you need to fill. The gap exists because the mission criticality of business intelligence just continues to grow year after year. We will spend a couple of minutes talking about why that is. But on the other hand the overall complexity of business intelligence applications really hasn’t kept up with the criticality of requirements. As a result we have these sets of opposing forces creating this very interesting opportunity or a gap depending how you look at it. Fortunately what we are talking about today is how to close that gap. So it's not all bad news. It's really all about the next generation best practices and the next generation business intelligence technologies that are indeed allowing us today to address this opportunity and to close this gap. I once read somewhere a comment that the information about a financial transaction has become more important than the transaction itself...
Generate Reports Automatically - With InetSoft's Report Scheduler, you can automate an unlimited number of reports, without creating additional work for IT or administrators. The Report Scheduler can be programmed to generate reports at any regular interval, whether its a daily, weekly, or quarterly basis. A report can also be triggered on a certain date or when a certain condition or threshold is met. The function of report delivery is also fully automated and scheduled. Reports can be automatically delivered by email or print, as well as exported into Word, Excel, Powerpoint, PDF, and other formats...
Getting Answers With Good Business Intelligence Tools - The kinds of question manufacturers are asking themselves that can be answered with good business intelligence tools include, are there new suppliers that I should look at? We are already seeing that supply chains were already difficult to manage. In the last several years in a number of industries the entire supply chain got blown up. They were players that went away, players that got consolidated, and there has been more shifting I think in the last several years than you saw probably in the ten years before that in terms of a lot of supply chains. This has created a number of opportunities if you are a supplier selling into an OEM. It’s also created a lot of confusion. And one of the things that has happened is that when you take a look at the growth that we are seeing now on top of sort of the lingering, I don’t know if you want to call it confusion, the lingering sort of after effects of rapidly cutting and maybe not doing it strategically, is that there has been so much change that the actual volume of transactional information has mushroomed. Whether it’s scheduling requests or purchase orders, the amount of information it is just overwhelming...

Getting Started With Key Performance Indicators - During the slow economic climate of the past couple of years and with all the focus on operational information, people are trying to squeeze out the best possible performance. With less people having to do more work, there’s a pressure to find time to try to keep up with the business performance. Add to that the decade’s long shift in business management philosophy towards fact based decision support. Now more than ever, managers want to be able to say this is what is going on, and this is what we have got to do. The more that you can quantify your business, and run your operation with KPI’s, the better off you will be. Most people are familiar with the financial performance metrics like revenue and profit, but almost every facet of a business can be measured and key performance indicators can be selected. Selecting the proper metrics is key, naturally. You have to get people from multiple parts of the organization involved. First, you have to understand what data do you have? What data is clean and can be used safely to drive these KPI’s? You don’t want garbage in, garbage out...
Good BI Applications - Looking for a good BI application? InetSoft has been a leading BI software provider since 1996 and has over 3,000 customers around the world. Recently Gartner ranked InetSoft number 1 in collaboration and OLAP capabilities. Our BI solution is there for you where and when you need it. With constant smart phone capability improvements, mobile BI applications continue to grow. In the past, applications had to be developed specifically for the mobile device. Today, we at InetSoft support mobile BI natively. As a server based solution that only requires browser to access interactive dashboards and drill-down reports, InetSoft’s StyleBI is extremely tablet and phone friendly...
Good Business Intelligence Solution - Are you looking a good business intelligence solution? Since 1996 InetSoft has been making BI software that is easy to deploy and easy to use. Build self-service oriented dashboards and visual analyses quickly. InetSoft's data mashup engine solves the data access and transformation challenges that other tools cannot. View a demo and read customer reviews...
Government BI - Features and benefits of choosing InetSoft's BI solution for government BI deployments...
Growing Imperative Behind Business Intelligence - In this webcast, we are diving in to help organizations explore their business data at the speed of thought and address the growing imperative behind business intelligence. Because the business intelligence marketplace evolves so rapidly, we’ll talk about what are some key trends and drivers that we are seeing out there. And we’ll talk about how can you intuitively navigate your critical business data, democratize it, analyze it and do it quickly to create competitive advantage. First, let’s talk about the BI trends. There are several drivers for an increased attention to BI: continued data growth in the world, continued increase in regulatory reporting, complex operations of large businesses, businesses who expand globally, who expand at the multiple products. But last and not least, business Intelligence has already moved inside the enterprise. It was moving. Now, it has moved into the front office. It is now the key corporate asset that we use to differentiate ourselves from the competition, and that is absolutely the main reason why the BI is just so hot these days...
Growing Trend of Geographic Business Intelligence - We are now at a place where geographic intelligence and business intelligence can combine to make a positive impact on processes and business results. We have reached a tipping point where location. based information is recognized to provide a competitive advantage for organizations who use it well. The new visualization technologies improve the way we perceive geography and its potential. Geographic business intelligence software such as InetSoft's allows enterprises to build complete intelligent geographic information systems and deploy GIS functionality across the enterprise. The ability to link location to other critical information in the business decision-making processes is attracting customers from a wide variety of industries. These kind of BI applications provide quick access to digital maps that can contain multiple layers of information...
Guidelines For Organizing BI Programs - What are some guidelines for organizing BI programs or projects for success? How should organizations structure the teams working on BI applications? The most important thing is because the partnership between business and IT is so important, anything that can be done organizationally to almost force that partnership is good. So if you are deploying business intelligence on an enterprise level approach, then staffing the BI Competency Center jointly by technical professionals as well as business users and business subject matter experts is really important. I think other things you can do is making sure that that team, that BI Competency Center team, is really staffed by some top talent. That is important. As I’ve mentioned, for a BI program to be successful, there must be a clear understanding between business and IT of what each department needs. But getting this dialogue going isn’t the easiest of tasks. What are some insights into how to get the business-IT communication started? I think a simple thing everyone can do is just periodically have lunch together. Simply talking together even on an informal basis is a very important starting point. As a next step, looking at opportunities where IT can attend regularly scheduled business meetings. Most business units will have these, whether it's a monthly or quarterly staff meeting...

HANA Business Intelligence Solution - Looking for a good business intelligence solution for your SAP HANA in-memory database? InetSoft's pioneering dashboard reporting application produces great-looking web-based dashboards with an easy-to-use drag-and-drop designer. Data scientists can execute and visually analyze the results of their ML models. Business users get maximum self-service to explore their data. View a demo and try interactive examples...
Healthcare Business Intelligence Solution - Are you looking for a good healthcare business intelligence solution? InetSoft's pioneering dashboard analytics application produces great-looking web-based dashboards with an easy-to-use drag-and-drop designer. Get cloud-flexibility for your deployment. Minimize costs with a small-footprint solution. Maximize self-service for all types of users. No dedicated BI developer required. View a demo and try interactive examples...
Help for Implementing Business Intelligence at the Core Level - The incorporation of business intelligence tools into software used for business processes is known as embedded business intelligence. Software with features like data visualization, analytics, dashboards, and reporting are provided by embedded BI. With embedded BI, business intelligence may be integrated right into an organization's applications as opposed to utilizing a separate application. In order to provide consumers relevant information as they work in surroundings they are used to; embedded BI also makes advantage of the data context from business applications. Instead of utilizing many programs at once, integrating BI features into a single application boosts productivity and increases the rate of user adoption. The conventional BI method relies on BI and IT teams to gather, analyze, and visualize business data as well as to offer the necessary KPIs, charts, and other visualizations to support business decisions. It takes longer to develop an output that the business users can utilize for strategic and tactical choices since this process includes several teams...
Historical Challenges in Business Intelligence - There have historically been three big challenges in business intelligence. The first is BI adoption and appeal. There is limited adoption, and BI tools are known for being not that appealing. They look a little boring or intimidating. They are meant for power users or for when you are desperate to get to the data. The next one is time to insight. Volumes of data are exploding. We have more and more granular data, click stream data, shopping cart data, and of course internal corporate data. People don’t want just quarterly summaries. They want intra-day updates. Trying to make sense of all this data and discover new opportunities, gain new insights at a faster pace is an ongoing challenge. The third one is the concept of relevance, making BI relevant for more people. Over the past few years, there have been a lot of innovations that speak to these challenges. The ones that are most interesting are ones that make BI more engaging, more insightful, and ultimately more actionable. Also important are any features that extend the reach of BI beyond the power users. Phrases like “BI for the masses” and “BI for mainstream” have been talked about for more than a decade now, and we’re still trying to get there...