Evaluate InetSoft's Healthcare Business Intelligence Solution
Are you looking for a good healthcare business intelligence solution? InetSoft's pioneering dashboard analytics application produces great-looking web-based dashboards with an easy-to-use drag-and-drop designer.
Get cloud-flexibility for your deployment. Minimize costs with a small-footprint solution. Maximize self-service for all types of users. No dedicated BI developer required. View a demo and try interactive examples.

Register for more information and a personalized demo
About InetSoft
Since 1996 InetSoft has been delivering easy, agile, and robust business intelligence software that makes it possible for organizations and solution providers of all sizes to deploy or embed full-featured business intelligence solutions. Application highlights include visually-compelling and interactive dashboards that ensure greater end-user adoption plus pixel-perfect report generation, scheduling, and bursting. InetSoft's patent pending Data Block™ technology enables productive reuse of queries and a unique capability for end-user defined data mashup.
This capability combined with efficient information access enabled by InetSoft's visual analysis technologies allows maximum self-service that benefits the average business user, the IT administrator, and the developer. InetSoft was rated #1 in Butler Analytics Business Analytics Yearbook, and InetSoft's BI solutions have been deployed at over 5,000 organizations worldwide, including 25% of Fortune 500 companies, spanning all types of industries.

More Resources and Articles about InetSoft's Healthcare Business Intelligence Solution
Analysis Functions Information - This is a table of contents of useful product information about, and benefits of, InetSoft's analysis capabilities built into its business intelligence software for dashboards, reporting, and analytics: 4 Ways How Credit Unions Use Dashboards and Analytics - Like many other businesses now, many credit unions are struggling with continuous technology adoption and innovation. Some may find themselves behind on many important technological trends and face increasing concerns such as cyber security issues, fintech solutions, and marketing challenges...
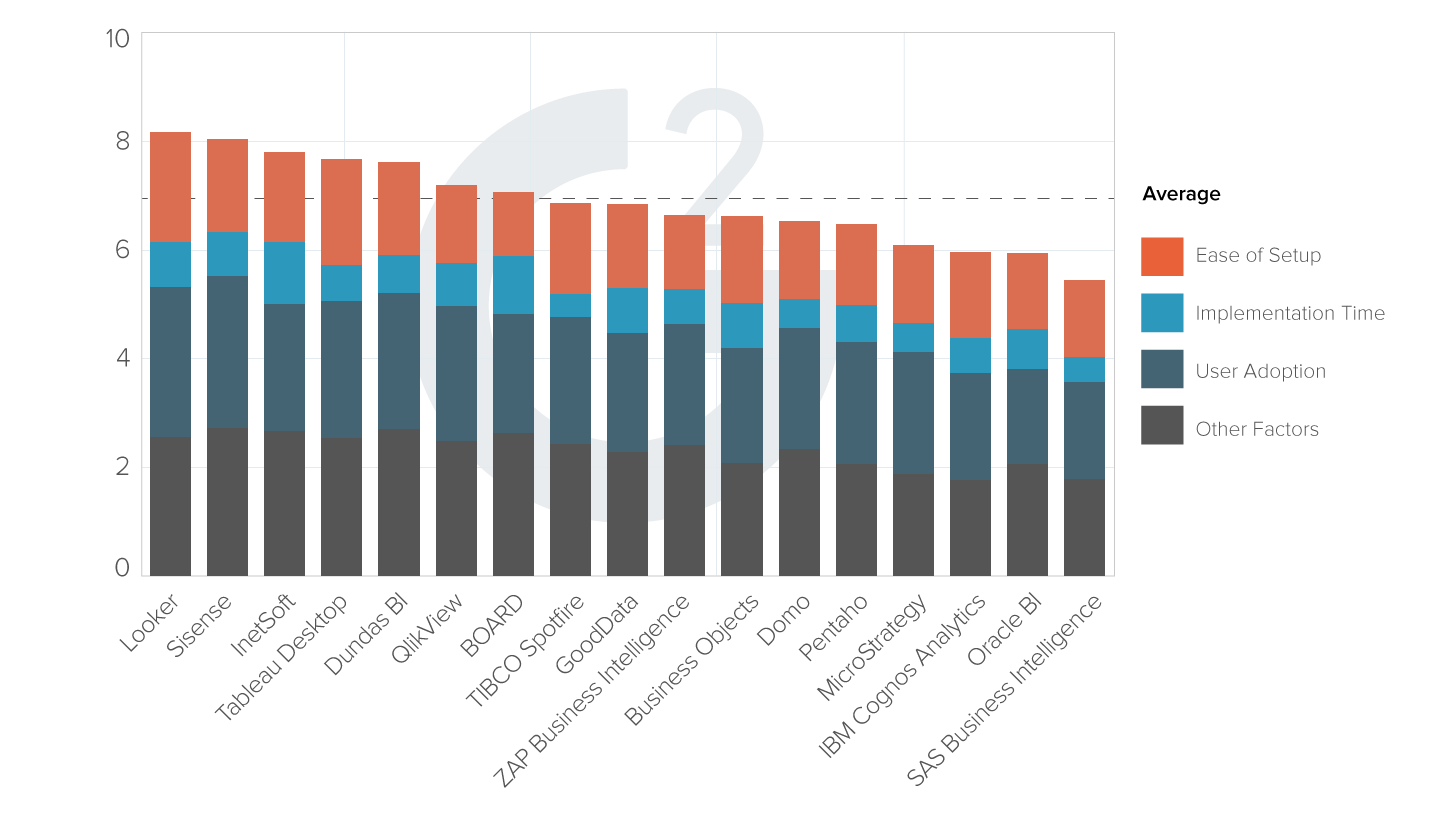
| #1 Ranking: Read how InetSoft was rated #1 for user adoption in G2's user survey-based index | Read More |
Applying Business Intelligence to Healthcare - this is an example of applied business intelligence in healthcare and insurance. This insurance provider in the western part of New York, just like any healthcare or health insurance company, they have system after system that have different processes and different internal applications, and they needed a way to speed up the member enrollment process and the eligibility process, and so they used decision management, business intelligence, business rules and business process management to work across all these systems and to really speed things up, and they are able now to roll out new programs twice as fast as they used to because of this BI system...
Background on Artificial Neural Networks - In this article, continuing our introduction to machine learning, I am going to write a little bit about real neurons and the real brain which provide the inspiration for the artificial neural networks that we are striving to learn about in this series of articles. In most of the discussion, we won't talk much about real neurons, but I wanted to give you a quick overview at the beginning...
Best Operations Dashboard This Year - Operations dashboards are useful in managing and displaying the daily activities that go on within a company. Information provided by these applications allows companies to examine the key performance indicators which are vital towards achieving business goals or objectives. The end goal is to gather and utilize the data from these dashboards to enhance daily business activities. Key trends and changing metrics are observed to come to important conclusions which will enhance a company...
Better Than GoodData's Analytic Solution - Are you looking for a good alternative to GoodData's analytic solution? InetSoft's pioneering BI application produces great-looking web-based visual analyses and dashboards with an easy-to-use drag-and-drop designer. Get cloud-flexibility for your deployment. Minimize costs with a small-footprint solution. Maximize self-service for all types of users. No dedicated BI developer required. View a demo and try interactive examples. They are powerful tools for organizations in any industry that present visual graphics and representations of statistical data. Visual representations are more effective for understanding the data therefore, personnel can communicate important messages more effectively...
 |
View live interactive examples in InetSoft's dashboard and visualization gallery. |
Build Out ETL and the Mappings - Then we can allow the technical team to work in parallel to continue to do the source systems analysis and then begin to build out ETL and the mappings. We view the ETL and data warehouse architecture layers as an independent subset because we can build a prototype without having to have actually source data. We can create dummy data sets and do prototyping for validation without spending the time and effort to do all the ETL work...
BICC Established within Corporate - Or the last model is a distributed model with the BICC established within corporate, and then they have distribution throughout each of the divisions. And again, each of these models have their pluses and minuses or positives and negatives. One thing I will say is if you are fairly mature and have a need across the enterprise to establish your BI visibility and sharing of information, the virtual BICCs are sometimes a challenge because you have someone, a resource that is devoting some percentage of their time to this, and it's difficult to get the focus that you need to really get that push across the enterprise...
Brands of Business Intelligence Solutions - Are you researching business intelligence solution brands? InetSoft is a pioneer in dashboard reporting technology. InetSoft's solution is true Software-as-a-Service, not a combination of client developer tools and a web-based delivery platform. Get cloud-flexibility for your deployment. Minimize costs with a small-footprint solution. Maximize self-service for all types of users. No dedicated BI developer required. View a demo and try interactive examples. With its foundation, you have got a strong data access engine and Data Block is one of the technologies that powers it...
Dashboards for Customer Service Centers - As the businesses compete harder, companies are coming up with multiple effective ways to reach customers. In the present day, hardly any businessperson dreams of being in a local business forever. Rather, their primary aim is to reach up to the global customers with their services and commodities. In such a scenario, most companies need to maintain excellent communication with the customers and hire efficient customer care executives. These customer executives make sure that every customer can present their queries and problems before the company...
 |
Read the top 10 reasons for selecting InetSoft as your BI partner. |
Data Intelligence Solution for Insurance - The data management needs of insurance companies are among the largest, most diverse, and most complex of any major industry. InetSoft's data intelligence platform can serve as the unification solution to disparate and seemingly unwieldy data sources while providing a vantage point from which decision makers can survey the chaotic landscape below...
Definition of Self-Service BI - Self Service Business Intelligence (SSBI) allows employees to access and work with data analytics without the help of the information technology department. This approach allows users to generate custom reports and analytical queries without the help of the IT department, which will allow them to focus on other tasks at hand...
Designed to Scale to Big Data - InetSoft's data mashup engine is designed to scale to big data with open source Apache Spark. Combining highly efficient data blocks with Spark's well-known scalability, data processing capability is just a function of the cluster size. InetSoft's data mashup engine can even be dropped into existing Spark clusters to share computing power with other applications...
Detailed Information Reporting - InetSoft's unique data mashup engine is the foundation for all of its reporting and analytics. Its visualizations and dashboards all allow for the drilling down into the most detailed level of information. InetSoft's document reporting is perfect for delivering a large volume of details to people on a schedule...
Read what InetSoft customers and partners have said about their selection of Style Report as their production reporting tool. |
Evaluate InetSoft's Corporate Business Intelligence Application - Looking for a good corporate business intelligence application? InetSoft is a pioneer in dashboard reporting, and our platform includes a powerful, flexible data mashup engine for generating complete views of corporate performance. View a demo and try interactive examples. Built-in, in-depth interactivity and customization allows business users to dynamically reshape pre-designed reports for changing business needs with zero training...
Example of Business Intelligence for Capital Markets - InetSoft's BI software allows organizations to leverage the information derived from FIX engines by providing a robust platform that is able to access multiple data sources simultaneously, and provide users with analytic tools that encourage the exploration of data in a fast, simple, and intuitive environment. StyleBI can even be integrated into existing in-house solutions...
Explore Data with Self Service - The visualization driven approach of InetSoft allows users to perform their own reporting and analysis with very little IT support. By using familiar graphical objects and an intuitive Web 2.0 interface end users are empowered to easily explore, manipulate, and display data to gain new insights...
Focus on Operational BI - InetSoft focuses on operational BI through an intuitive self-service user interface that facilitates the dissemination of information, and institutes accurate and timely decision making. Requirements as diverse as reporting, OLAP, scorecards, dashboards, visualization, and ad hoc analysis are all met in a unified application that uses live key performance indicators to continually guide and gauge all business processes...
Read what InetSoft customers and partners have said about their selection of Style Scope for their solution for dashboard reporting. |
Free Business Intelligence Applications - The Start Free button gives you two options for using InetSoft's free dashboard visualization software. Individual Account Register with any email address, including free email services such as Google and Yahoo. There is no credit card required. Use the 100% web app with no desktop install. Collaborate online in real time. Use data sources such as uploaded Excel or CSV files or connect to live Google sheets. Publicly share dashboards, if you wish, via URL link. All advanced data visualization types and interactive controls are available...
Good Visualization Principles - There are undoubtedly many more improvements that can be made on the graph. But the few changes applied to the graph is sufficient to show that with careful design and application of good visualization principles, simple changes can vastly improve the communication...
Healthcare Insurer Business Intelligence - Our first topic is about how analytics drive innovation for commercial health care companies. We have worked with a large healthcare insurer. Those companies that are responsible for some of the financial side of the whole healthcare equation often called the payers. What we are finding now is a shift in orientation where what were traditionally considered healthcare payers, the companies handling the financial transactions, are now really broadening their value add to our healthcare system...
Healthcare Solutions Company OEMs BI Solution - Ventura Software, a provider of systems software for the healthcare industry, has partnered with InetSoft Technology, an innovator in mashup-driven dashboard and reporting solutions, to bring enhanced business intelligence functionality to Ventura Software users. Heading Ventura's large library of systems software is ALIS, the most commonly used Laboratory Information System in Turkey. ALIS is in operation in state hospitals, university hospitals, private hospitals, private laboratories, blood banks, and various health establishments all throughout the country...
 |
Read how InetSoft saves money and resources with deployment flexibility. |
Implementing Operational Business Intelligence - InetSoft's business intelligence software takes a unique approach to improving operational and business performance by incorporating three fundamentals beyond the typical reporting and analytical tools available today. These fundamentals - collaboration, exploration, and integration - allow companies to employ operational best practices for the BI environment...
Important Key Performance Goals - Key performance goals are the important, strategic final and intermediate outcomes that management sets for either overall corporate performance, or for departmental performance. Examples could be higher sales or higher customer satisfaction. After the goals are set, then organizations track the progress of their efforts towards these goals by monitoring the key performance indicators or KPI, the numbers that measure the current level of the metric associated with the goal...
InetSoft's Cloud-Hosted Solutions - Cloud BI - InetSoft offers a full spectrum of options from turnkey operations which include application administration to self-service environments at Amazon Web Services. InetSoft's Easy Big Data Path Easy Big Data - InetSoft's data intelligence application is designed as a "big data in a box" solution requiring no specialized big data skills to set up and use...
Interactive Visual Analysis in Healthcare - This interactive visual analysis example portrays the rich and interactive nature of InetSoft's dashboard software. A web-based analytical dashboard, the chart uses InetSoft's patented Data Block technology for data mashup purposes, serving as an effective way to analyze multi-dimensional data. A powerful and effective capability of InetSoft's dashboard solution demonstrated here is the simple sorting mechanism that users have control over. Filtering and sorting is easily done with the radio buttons and color coordinated bar chart that includes an array of categories...
 |
Learn about the top 10 features of embedded business intelligence. |
Information About Tools of Business Intelligence - Below you may find useful resources about InetSoft's tools of business intelligence designed to be easy to use and easy to deploy BI tools by enterprises, ISV's, and SaaS providers: Drivers of Self-service BI - What are some more drivers of self-service BI? When it comes to business reporting requirements, most of the time business users spend a lot of time explaining what they need to do to the IT teams. After they get the report they spend more time realizing they needed to filter it a certain way, and have to go back and modify the request. The reason for this inefficient cycle is the wrong choice in information management technologies. It must have limitations in terms of the data structure in the data warehouse and in terms of the front end, limitations in formatting capabilities...
Information Spread Across Multiple Systems - So it is important first of all to make sure that you're actually pulling that information that might spread across multiple systems and data sources into a centralized system and then be able to process that in real-time, or near real-time in some type of event based system - event based in the sense that you are able to essentially be notified when some piece of information has changed and then be able to notify the respective people giving them that information in their KPI dashboards or management reports...
Merging Data Visualization - think operational intelligence starts and stops with visualization. When we look at operational intelligence there are about three capabilities. The first is the visibility of the data itself. This is actually because we're looking for operational data from systems that can be your transactional systems. It's not always apparent or recorded. You first have to be able to extract that information just to make the raw data physical...
Mission Critical Ready BI Platforms - Another very eye opening observation that we will spend a few minutes talking about is that now even though a large enterprise scalable mission critical ready BI platforms have been out there for many years, a majority of you are still using a home grown BI applications mostly based on spreadsheets. This chart in particular says that for 63% of you, more than 50% all BI apps or BI content reside in home-grown spreadsheet based applications. So that's really what's behind in adoption. We have some tangible proof of how enterprise IT is not really fulfilling all of its promise. A lot of users cite various data limitations...
 |
Learn about InetSoft's key differentiator: cloud flexibility. |
Operational Intelligence with InetSoft - InetSoft focuses on operational intelligence with an intuitive user interface that provides real-time information and accelerates user adoption. Requirements as diverse as reporting, OLAP, scorecards, dashboards, visualization, and ad hoc analysis are all met in a unified application. InetSoft is top-rated by users on G2 Crowd. Interact with examples and register for a personalized demo...
Operational KPI's for a Law Firm - the operational excellence KPI's, that's stage one. The market growth is stage two, and leadership is stage three at some level, okay. These are what a law firm needs to track in order to maximize performance. Ron: That's right. So we can see here cluster one. We can see there a stage one cluster, and we ask, well why is that? If we just look at their overall score for the moment, they are doing 5.9. They are in the middle. 5.8 is the average. So we calculated the average at about 5.8. These guys are doing 5.9. They are a little bit above average. The 5.4 mark, there would be the 25th percentile, the 6.2 mark would be the 75th percentile, and the 6.6 would be the 90th percentile...
Reporting Tool for Operational BI - Operational business intelligence, also referred to occasionally as real-time business intelligence, is a style of data analysis that facilitates decisions based on the real-time data companies generate on a routine basis. Operational business intelligence data is most useful to front-line workers who require up-to-date information to perform well...
See BI Examples for Various Target Users - For example, you can increase revenue by using BI to create a more effective product mix, optimize distribution techniques or find better marketing partners. Business intelligence(BI) can enable you to manage target marketing programs better by being able to measure the responsiveness of various segments and recalibrating more quickly and precisely as you react to changes in demand. You can control costs by using BI to reduce waste and scrap and to increase the productivity of materials and labor. You can find and evaluate less costly manufacturing partners or parts suppliers and determine how to utilize plant capacities more fully...
 |
Read why choosing InetSoft's cloud-flexible BI provides advantages over other BI options. |
Sophistication in the Business Intelligence - And obviously, everybody wants to get to this level of sophistication in the business intelligence, and frankly, it takes a cultural understanding. Once we have decided what we are measuring and why and what the benefits are, we can begin to direct our organization and our culture to look at those issues and to share the information. And so, perhaps I build a BI Center of Competency (BICC) that says, "I need these skills, I need these measures in order to be able to support that goal as measured by the key metrics we have defined." We share those skills; we share those best practices and ultimately, the whole organization moves together in order to reach that objective...
Super User Analyst - Super User, he is a business guy in sales, or marketing, or finance who has gravitated toward the technology, finds that he likes using Excel or the BI tools, likes building reports and rolling up his sleeves and wading into the data. And over time he has become the go-to guy for everyone in the department to build ad hoc reports or ad hoc views of information. He may not have report creation and design as part of his job description, but this is something that he had carved out a reputation doing...
Superior Dashboards as Deciding Factors - Business Intelligence Manager at NCN, named the ease of use, drag-and-drop interface, automated reporting, and superior dashboards as deciding factors in NCN's selection of StyleBI. "What I liked the most was the drag-and-drop feature for putting together a data query. With other solutions you have no choice but to sit and write code, but with StyleBI, it doesn't take two to three hours to design reports - you only need ten to fifteen minutes...
Track Industry Specific KPIs - SUNRx selected InetSoft's StyleBI for internal use by various departments and the executive management team. The pharmacy technology and services provider uses InetSoft's interactive dashboard software to track industry specific KPIs such as prescription rejection rates as well as traditional financial metrics such as account receivables. The enterprise-wide deployment of StyleBI has accommodated comprehensive information 'dashboarding' and reporting, spanning multiple data sources and applications including: Microsoft SharePoint, SQL Server, and Sage SalesLogix. The ability to create integrated performance metrics dashboards...
 |
Learn the advantages of InetSoft's small footprint BI platform. |
Use Data Mashup Technology - Others use data mashup technology to combine disparate data sources to provide comprehensive dashboard reporting. All of them leverage InetSoft's business intelligence technology to derive intelligence from their data. Nebraska Educational Service Unit #1 selected InetSoft's business intelligence software. The state organized support agency uses InetSoft's StyleBI business intelligence application to gain advanced analytics and reporting on student performance and programs run by the special education department. StyleBI is an edition of the InetSoft business intelligence software application...
Using Dashboards In Healthcare - What we need to understand is the definition of business dashboards is different as it plays distinct roles in different industries. Because data dashboards are used for diverse purposes, therefore, the definition of each one differs. Let's talk about dashboards in a particular industry, the health sector, for example. There have been evident signs of digital revolutions taking place over the past few years in the health sector's usage of dashboards. Dashboards used in the health industry are known as 'healthcare dashboards' or 'clinical dashboards...
Value of Operational Intelligence - Historically, a Buy-side bank would phone a Sell-side bank and place an order or ask for a quote for a particular instrument. The Sell-side bank would then respond, receive and "work the order" during the course of the trading day (or sometimes days). At their discretion, banks would update the trade status to the Buy-side client. This process gave the Sell-side bank a tremendous advantage to easily establish prices, premiums and margins for the instrument while the order was worked. Conversely, the Buy-side bank had limited visibility, not knowing how much of the trade was executed until they received either an order confirmation or updated status...
Which dashboard is for right me? - Well, the answer to that question depends completely upon certain parameters: First and foremost, why do you need any dashboard in the first place? If you need deeper insight into your business or are searching for trends, use an analytical dashboard. If you are interested in KPI awareness or time sensitive matters, an operations dashboard if for you...
Why BI + Reporting Does Not Equal Reporting + BI - Operational business intelligence is a rapidly developing area of business intelligence (BI). From the surface, it looks like a simple expansion of business intelligence capabilities to operational areas. In practice, a successful operational BI implementation requires completely new thinking in data modeling, report design and program implementation based on its real-time collaborative nature...
Why StyleBI Over Tableau - StyleBI allows you to combine fields from disparate data sources, providing an efficient way to create a single source of information. The Data BlockT technology enables a high performance data mashup across domains and multiple data sources. The intuitive and visually interactive dashboards created using InetSoft's drag-and-drop viewsheet enhance the the number of actionable insights that can be discovered. A wide range of sophisticated chart types, including custom geographic mapping, allow unlimited flexibility in dashboard creation...


