How InetSoft's Solution Can Be the Alternative to a Data Warehouse
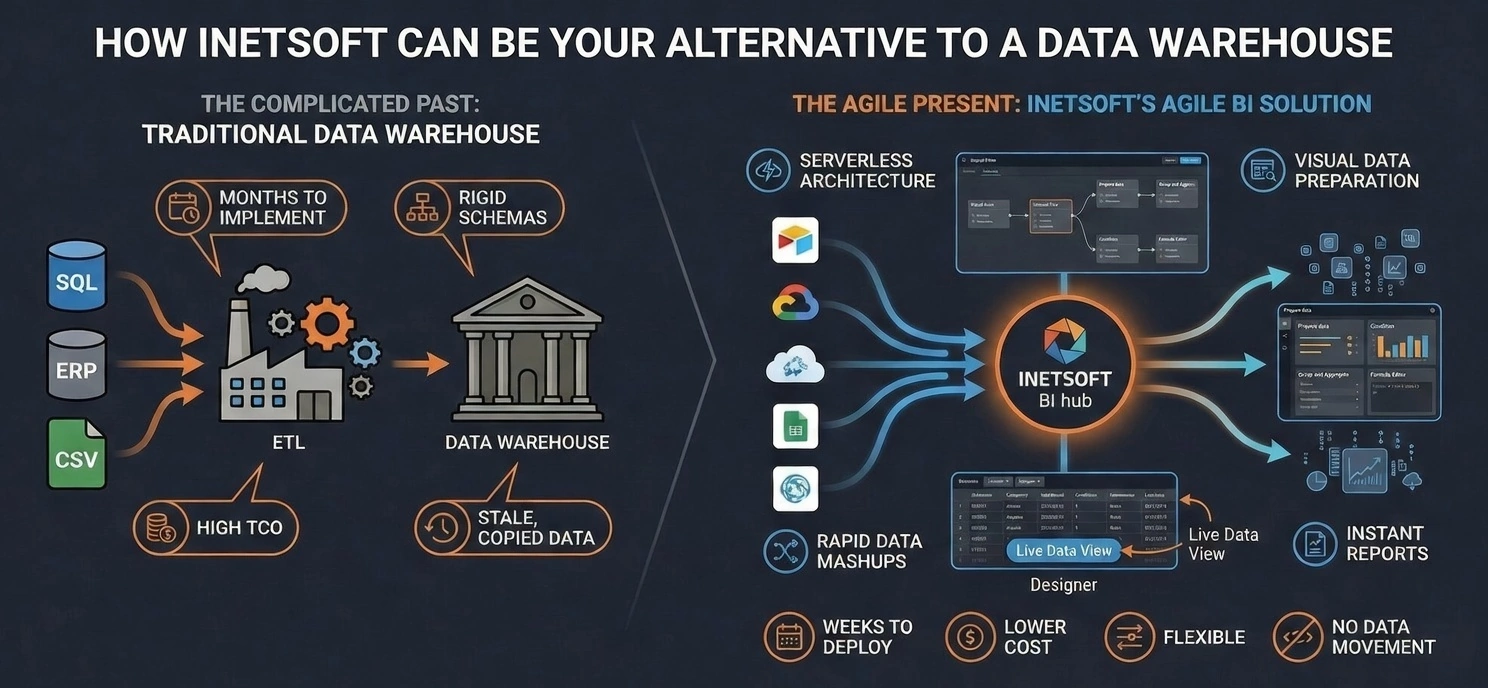
Many organizations assume that building a full data warehouse is the only way to achieve centralized reporting, governed analytics, and consistent business metrics. While data warehouses offer strong benefits, they also require significant investment in architecture, ETL pipelines, storage, and ongoing maintenance. For companies that need agility, faster deployment, or a more flexible approach to integrating diverse data sources, InetSoft provides an alternative that delivers many of the same advantages without the complexity of a traditional warehouse. Through its semantic layer, data mashup engine, and modeling capabilities, InetSoft enables organizations to unify data virtually and create a governed analytical environment that functions like a warehouse—without physically consolidating all data.
One of the core reasons InetSoft can serve as a warehouse alternative is its ability to integrate heterogeneous data sources in real time. Instead of requiring data to be extracted, transformed, and loaded into a central repository, InetSoft connects directly to databases, cloud applications, spreadsheets, APIs, and streaming sources. Its data virtualization capabilities allow users to query data where it already resides, reducing duplication and eliminating the need for large-scale data movement. This approach is especially valuable for organizations with distributed systems or rapidly changing data environments, where traditional ETL pipelines may be too slow or costly to maintain.
InetSoft’s semantic layer plays a major role in replacing the conceptual functions of a data warehouse. In a warehouse, business rules, definitions, and hierarchies are standardized so that all reports use consistent logic. InetSoft achieves the same outcome by allowing administrators to define business-friendly names, KPIs, and relationships that remain consistent across dashboards and reports. This ensures that metrics such as revenue, churn, or utilization are calculated uniformly, even when the underlying data comes from multiple systems. The semantic layer becomes the “single source of truth,” even though the data itself remains distributed.

Another key capability is InetSoft’s Data Worksheet environment, which allows users to blend and transform data from multiple sources without physically consolidating it. Users can create logical tables that represent business concepts—such as customer profiles, product performance, or operational KPIs—by joining and enriching data from different systems. These logical models can be reused across dashboards, providing the same consistency and governance that a warehouse would offer. Because transformations occur virtually, organizations can adapt quickly to new data sources or changing business requirements.
Performance is often a concern when considering alternatives to a data warehouse, but InetSoft addresses this through query optimization and caching. The platform generates efficient queries based on the logical model, reducing the load on source systems and improving dashboard responsiveness. Cached results can be refreshed on a schedule, providing near-real-time performance without requiring full data replication. This hybrid approach gives organizations the speed of a warehouse with the flexibility of virtualization.
Cost and deployment speed are additional reasons why InetSoft can serve as a warehouse alternative. Building a traditional warehouse requires specialized expertise, long implementation cycles, and ongoing maintenance. InetSoft, by contrast, can be deployed quickly and scaled incrementally. Organizations can start with a few key data sources and expand over time, without redesigning their entire architecture. This makes InetSoft particularly appealing for mid-sized companies, fast-growing businesses, or teams that need immediate analytical capabilities without waiting for a multi-year warehouse project.
Ultimately, InetSoft provides many of the benefits of a data warehouse—centralized logic, consistent metrics, governed access, and unified analytics—through a more flexible and cost-effective architecture. While some organizations may still require a full warehouse for large-scale historical storage or complex ETL needs, many can achieve their analytical goals using InetSoft’s semantic modeling, data blending, and virtualization capabilities. By offering a lighter, more agile alternative, InetSoft empowers organizations to build a unified analytical environment that supports decision-making without the overhead of traditional warehousing.

Related Resources
JavaScript Object-Oriented Concepts - JavaScript is an object-oriented programming (OOP) language, and provides various objects and methods, as well as the ability to create user-defined methods. To use JavaScript effectively, it is important to understand the following concepts. Properties are predefined data-storage locations associated with an object. You can 'get' or 'set' these properties to observe or alter the corresponding attributes of the object. For example, every report element has a visibility property: Table1.visible = false; Methods are predefined functions associated with an object. (In general, these functions operate on the object itself.) For example, the CALC object provides a method for obtaining today's date: Text1.text = CALC.today()...
Joining Multiple Data Sources - To embed static data manually into an element (Table, Section or Chart), follow these steps. 1. Right-click the element and select ‘Bind Data’. This opens the ‘Data Binding’ dialog box. 2. Under the Data tab in the ‘Data Binding’ dialog box, expand the ‘Report’ node, and select ‘Embedded Data’. 3. Click the ‘Edit’ button on the right. This opens the ‘Embedded Data Editing’ dialog box. 4. In the ‘Embedded Data Editing’ dialog box, enter values in the ‘Rows’ and ‘Columns’ fields to specify the table size. You can also specify Header and Trailer rows and columns. 5. Click on the table cells to enter values. Specify the data type for each cell from the pop-up menu within the cell...
List Comparison for Queries Using Hierarchical Meta Data - If you want to get a list of all employees with C++ programming skill, you can add a condition to the employee node to select only people with C++ on their skill list. However, since each employee may have multiple skills linked in the employee record, a simple string comparison does not give the correct result. This condition would work if all employees only had one skill listed. If the C++ programming were listed as the second skill of an employee, the comparison would return false because a list of skills is converted to a scalar value by using the value of the first child. You need an expression to compare the skill list with a value, and the comparison should be true if any value on the list matches the skill. The following list comparison expression returns the correct result...

Machine Learning Analytics Company - As a machine learning analytics company, we tend to focus on automation, time savings, and something that we are going to talk about in more detail later, graphical interfaces that can bring people who know more about the business closer to the data. Proprietary solutions also tend to focus on the deployment of models. We were talking about one sort of workflow which when the data scientist develops the model and then hands it off to a programmer to deploy the model. Well, we see InetSoft and other proprietary solutions working towards a one click sort of deploy button, and what a time savings that can be for an organization. What we want to look for and things that we've done is how do we feed the creativity of data scientists, and we think that allowing for bi-directional integration with open source products is one way. I can be in InetSoft, and make calls out to Open Source. Then we're talking about things like using the open standard of a PMML. I think it's really silly, and I do see less and less of this, thank God, people debating is R better than Python better than InetSoft? These are not productive discussions, I don't think. I mean I think it's good to know which tool to use for what. I certainly think that's good. I teach a data mining class and where I expose this to my students. Know which tool saves you the most time at what point of the process. I think that's more important...
Machine Learning Examples in Higher Education - We are currently witnessing how technology changes the world and education in particular. Big Data and Machine Learning have always on everyone's radar due to its unexpected still paramount influence on our daily lives. We certainly remember all the retail, social media, those Tinder ground-breaking cases and other ways to use Big Data, but how has it changed things as fundamental as, say, education? According to Knewton, there are five types of data in the education sector: personal data e-learning (digital workbooks, online courses) student engagement data learning material effectiveness data administrative data forecasting data Let's find out how each sort of data contributes to shaping and improving contemporary education. Personalized Education Globally, the objective of Machine Learning is to enhance the processes and education industry is not an exception for that matter. Educational Data Mining is seen as the most powerful instrument to increase the effectiveness of education as it is today. The following is being achieved through designing those data analysis methods which will enable us to rethink the approach, fill in the gaps and adapt the accumulated experience in order to transform the system...
Machine Learning Solves Business Problems - Where is machine learning being leveraged to help solve real business problems nowadays? We see a few main areas where enterprises are looking for business value and business benefits and applying machine learning to their daily operations. The first category is a top line growth. This is about serving better recommendations to customers, finding the right customers, finding the right opportunities, approaching them in the right way and upselling and cross-selling in order to drive the top line. Recommended systems is primarily a domain of natural language processing, of sales cycle, sales insight systems, as well as marketing optimizations. The second big area is to help re-imagine business processes with digital intelligence. So this is not just about redoing what we do today with ML insight but about truly rethinking the end-to-end process in a way that this leverages ML capability to deal with the routine and the optimal current cases, and this can have tremendous bottom line benefits. The third category is about employee engagement and having healthier and more satisfied employees with a more varied set of challenges during their working hours because again they can focus on the top and to the underserved cases that require new thinking and that require unstructured problem solving. This also includes automating away some of the mindless or repetitive tasks that nobody particularly enjoys about their daily activities today...
Make Data a Critical Organizational Asset - Few could dispute that data is a crucial asset in the modern business enterprise. This has certainly always been the case for the data that represents an organization's internal health and growth, such as expenditures, revenues, payroll, etc. But data that businesses collect about customers and the broader public and market now represents an even more critical asset. In certain cases this collected data may even constitute the "crown jewels" of the organization, and be considered more valuable and marketable than any other asset possessed by the enterprise. What has made customer data so crucial to modern businesses is a combination of two technologies. The first technology is content customization, the ability to adapt content and advertising to the individual customer. This is easiest to appreciate in the context of digital delivery of videos and other media, where content and ads are tailored to the individual viewer. But the development of content customization has penetrated less conspicuous areas also, such as the coupons delivered to customers at supermarket check-out, political fundraising emails, music playlists, financial service offers, cell phone plans, and so on...
Making Data Usable For Broad Analytics - Yeah, there is a question that one of the attendees asked, is Alteryx a data shaper, and the answer is absolutely. In addition to you mentioned Trifacta and Paxata. Those are two technologies that that were kind of born with Hadoop, and that's where you were seeing the largest variety of data. In that variety, you have to find a way of making the data really usable for broad analytics use cases. It depends on the shape of the data, whether it's a nested files or something else. And so you saw technology as Trifacta and Paxata that are really born around leveraging the Hadoop platform to do that data shaping and processing right on there. Now it has expanded to other technologies so it's not just dependent on Hadoop, but Alteryx has just gone the other way where they started with being able to shape data and prepare data off of a number of different sources whether they are now actually leveraging the processing of Spark or Hadoop to be able to do some of the transformations in memory...

Making Information the Most Valuable Commodity - There is some thinking out that at this point the most valuable commodity and manufacturing is not energy. It’s not the goods. It’s the information that you use, that information about customers, about your products, about what customers are actually looking at. How do you build an entire solution for them? Information is the most valuable commodity. Information about your supply chain, your processes, everything is valuable. The issue that you see with this right now, a lot of times is that, that information is not treated in any way, shape or form as if it is the most valuable commodity. A lot of data in a lot of firms is still scattered in lots and lots of places. It resides in a variety of different databases. It’s not uncommon to see even a small or midsized company with 20, 30, 40 different databases or more. You see a lot of data that is sitting in spreadsheets, especially for firms or plants that are using improvement methodology where they are going outside an established enterprise resource planning system. You actually see a lot of company’s data that still resides in hard copies, pieces of paper. Even when it is digitally located in databases, the issue is it’s not in a centralized database. It’s in spreadsheets. It’s in product drawings. It’s sitting on in some computers somewhere, somebody’s laptop, and that’s a problem...
Manipulate and Mashup Data - In order for a BI software to deliver maximum performance and answer business questions, it needs to have flexibility in the data sources that it can access. InetSoft's StyleBI software lets users mashup disparate sources of data and create virtual private models, making it invaluable for BI uses such as corporate benchmarking, cost control, and risk management....
Manipulate Apache Spark Data - Nowadays all companies struggle with ever growing stores of data. Due to the increase in data storage technology, data sources have become larger and old fashioned data tools won't cut it. Big Data is hard to manage, move, report, and analyze. This is where InetSoft comes in. With some traditional tools the user may be able to look at the data, but not in real-time. Basic data tools won't deliver with the same speed and efficiency that InetSoft's Apache Spark dashboard software will. Information can also be extracted that normal data tools are unable to replicate. This creates knowledge that otherwise wouldn't exist without InetSoft...
Manipulating Data Blocks - Worksheets provide a full complement of sophisticated data manipulation tools, including joins, filters, and concatenations. You will now use some grouping and aggregation tools to manipulate the Data Block that you created earlier in Constructing Data Blocks. 1. Right-click on the table’s top row and select ‘Group and Aggregate’ from the drop-down menu. This will open the ‘Aggregate’ dialog box. 2. In the ‘Aggregate’ dialog box, make the following selections: a. For the ‘Order.Date’ field, select the ‘Group’ checkbox and select ‘Month’ from the drop-down list. b. For the ‘Product.Total’ field, select the ‘Aggregate’ checkbox and choose ‘Sum’ from the drop-down list. 3. Click ‘OK’ to exit the ‘Aggregate’ dialog box...
Many Dimensions to Big Data Analytics - There are many dimensions to big data analytics: a scalable architecture, allowed storage, and advanced analytic capabilities. Another one that I read in the report was across industries the business case was really strongly focused on customer centric objectives. What they saw across all of the industry groups, and they have 12 macro industry groups from 26 major industries, is that for all of them the business case is really being driven for those organizations. They looked at organizations across the spectrum of Big Data activity. For those organizations that are already piloting or implementing Big Data initiatives, almost half of them, 49% are driven by customer centric outcomes. They want to get to know the customers better. They want to improve the customer experience. They want to understand how to serve those customers better, and I think that that connects very much to this digitalization of things, and customers today have very different expectations when they interact with organizations, and they have much greater ability to express themselves positively or negatively about their experiences with those companies...
MapReduce and Hadoop - Key Technologies for Big Data - So we’re approaching big data in a couple of ways. MapReduce and Hadoop are key technologies associated with big data. There are a lot of questions out there surrounding these technologies. For instance, is it better to use Map Reduce or a data warehouse for big data? That’s a good question. A lot of people are struggling with that, and there’s a lot of religious fervor on both sides of that camp. Should we use commodity hardware with a parallel Map Reduce for our analytics, or should we use a traditional data warehouse with relational tools and relational capabilities. And the answer is simple. If you had a screwdriver you could pound in a nail with your screwdriver, but you might choose a different tool which would be more effective. So MapReduce and Hadoop which are two sides of the same coin. They provide process oriented parallelism, and they use a lot of process languages. In contrast, relational databases have parallelism built into the data, and they handle the SQL language. So you use the correct tool for the job. And ultimately these are very complementary...

Marketers Measure Content Effectiveness - It is accepted that the effectiveness of content cannot be calculated in a moment - content works gradually and has a cumulative effect. The material in the media will be indexed in a search for several years, and a mailing list can fuel an audience for several months before purchase. The effectiveness of content is also difficult to monitor for the reason that, as a rule, a company uses several channels of communication. But not all of them have end-to-end analytics implemented. For a business that doesn't have a large marketing department, it's difficult to create dozens or hundreds of segments, evaluate every touch with the audience, and test hypotheses. It is difficult to convert content into money, but it is possible. The main thing is to figure out what to count...
Mashing up Your Amazon Redshift Data - StyleBI's reporting and dashboarding tools can work with virtually any data source or operational database, so producing an analysis report or generating an interactive dashboard will present reliable and accurate information that reflects all accumulated knowledge..
Mashups Empowering End Users - There should be a general movement in this whole industry of business intelligence or decision support or whatever you want to call it, analysis, of empowering the end-user, and so one of the values that I see in the mashup concept is that ideally what you need to be doing is enabling your end users to mix and match data sets very quickly and very easily. that’s where the collaboration perspective comes in. And again for the mashups to achieve their goal, any type of business agility, it’s the collaboration angle that I am always looking for...
Mashup Stripe Data -With InetSoft's StyleBI, sales tracking metrics, customer return ratio, and website page views can all be mashed up with data from Stripe and other payment processors. With InetSoft's user-friendly drag and drop tool, it's easy to learn how to create mashups with data from your website and online store combined. Let's say you're using StyleBI to take the information that you have from your own eCommerce store to track your executed sales transactions. While doing so, you could also pull data you have from Google Analytics which displays who has visited the website and who has stayed on the website or made a purchase..

Materialized OLAP Overlays - Materializing an OLAP overlay involves the implementation of a physical data store such as a star schema in place of the OLAP overlay’s logical structure. An OLAP overlay is a low overhead OLAP option, but other data warehouse options may be more suitable under certain conditions. such as the following: * Data Mismatch: when data is not in a 1-n relationship from dimension to fact, the remedy is to create data that does satisfy these conditions. * Increase performance: large databases could produce long running queries. A dedicated Data Mart or Data Warehouse can produce the best performance, by physically implementing the OLAP functions...
Merging Data Visualization with Operational Intelligence - Eric Kavanagh: Right. Okay, folks. Moving right along, our next guest some of you who have been around for while may recognize the name as a co-founder of that company called TIBCO. It is a prominent player in the world of enterprise technology these days. Dale Skeen now the head of Vitria -- welcome to the DM Radio...
MDM as an Enterprise Initiative - While MDM is an enterprise initiative, I think in the end it should be a horizontal kind of platform solution for the organization. I think it’s best, and most of the success will come by looking at the problem a little bit more vertically and trying to solve actual business problems. When should vendor technology evaluations and selections come into the process? Are there any tips for evaluating and sorting out MDM technology options? Well, there are multiple definitions of MDM out there. I think that’s one issue that I know everybody is dealing with because we often still get questions what is MDM? What exactly do you mean by that? So I think that there are a lot of rival definitions. I think there is also a general distinguishing feature between analytical and operational MDM, and that is one that we see as well where analytical is more about supporting BI and reporting and analysis activities, including things like reporting hierarchies, whereas operational MDM is more about establishing a gold copy or reference data that can be used by multiple transaction-oriented applications. So that’s one distinction that people should look at when they are looking at tools and looking at technology to combat the problem...
Mobile Access to the Core Data - So that’s where the first notion is, this transformative impact of consolidation. From a business information perspective, it’s also very relevant. So when you look at the notion that the primary driver that we have seen for driving mobile BI, for example, as investment, so this is mobile access to the core data that resides at the center of the heartbeat of the organization. The primary driver is to drive decision making to the edges of the organization, well-informed decision making, decision making that has the necessary information required to be effective. For example, if you are in field service, you have customer records. If you are in field sales, you have the access to customer relationship management and the order history. If you are in healthcare, you have medical records. You could just go on and on with this, just think about how it empowers your organization to be more effective to drive the decision making power out to the edges of the organization that doesn’t in any way diminish the role of the CFO or the CXO generally. In fact, it empowers a greater level of operational efficiency...
More JavaScript Syntax Basics - JavaScript does not have an integer type and a float type. All numbers are treated as float by default. var total = 2 + 3; text = total; // this will convert the number to 5.0 To force a number to be treated as an integer, use the toFixed() method of the number object and give a decimal point of zero. A number constant is in decimal format by default, hexadecimal format if it starts with '0x', and octal format if it starts with '0'. Numerical computations are performed with the usual operators, +, *, /, -. The increment and decrement operators (++, --–) are also available...
Modernizing Excel-Based ETL Pipelines with StyleBI - A small property insurance adjusting company operates a lean data department responsible for delivering mission-critical reporting and analytics to both internal staff and external clients. The current data architecture is centered on an on-premise SQL Server database hosted on a 24/7 Azure virtual machine, with a monthly infrastructure and tooling budget of approximately $500. The existing ETL and reporting process is composed of multiple scheduled and manual steps: Nightly execution of approximately 50 SQL scripts via Python and Windows Task Scheduler to drop and reinsert tables and views in the SQL Server database. Automated refresh of around 10 shared Excel reports that query the SQL database, used by staff for operational flags and reconciliation. Scheduled refresh of roughly 40 Power BI reports through a gateway on the same VM, serving both staff and clients for monitoring, reimbursement, and analysis...
Most Transformative Machine Learning Applications - Where are we witnessing the most transformative level of innovation in machine learning applications? The deep learning revolution that started in 2013 or so, this started out in the image processing space. It has since branched into video. It has branched into speech recognition and audio processing because the improvements on all new processing and quality on your mobile phones are largely driven by deep learning techniques that came into widespread use two years ago or so. They are now increasingly being applied to natural language processing with very good results. I think the next frontier for the deep learning and machine learning revolution is to also upset this status quo on reasoning and logical conclusions. This is an area where the rule based systems -- best solutions for things like natural language processing or image processing before â€" still reign supreme. We're at the next wave of deep learning based technology. It is very likely to also bring in and drive substantial improvements and assumption that help us address completing more use cases. I would definitely be reasoning as the next big frontier of what deep learning research can help deliver. Which industries will be most impacted by these developments? Looking at multiple consulting studies on this, what they all have in common is that they are from 2014, 2015 or 2016. They show a landscape of impacts all over the map. What seems to be different in how ML impacts these industries? For some it's the change in the core product or service that they are offering, like automotive manufacturers going to become self-driving car manufacturers...
Municipal Government Big Data Analytics - More than a buzzword for cities, Big Data is the term that describes the endless amounts of data created every day by a city's citizens, agencies, organizations, businesses, sensors, and machines. Understandably a city can struggle to reap the value of all this data. Without specially-trained staff or the latest analytic tools, it can be hard to easily understand the trends, patterns or relationships inside the data. The value of Big Data is realized when information is extracted from the myriad sources, combined, and interpreted to uncover insights that lead to actions that make a difference in addressing the challenges facing our cities. Cities are complex, dynamic structures. With so many moving parts, they are challenging to predict. Yet, administrations are charged with managing the infrastructure and services with a goal of building a prosperous, resilient city. One challenge is coping with contrasting areas of expansion and decline along with a diverse and changing populations. In terms of services affecting their economy, health, transportation and education are the essential services that affect anyone who lives, works, or travels in the city. All of these things are interconnected - which makes the analysis and the choice of actions more complex...