Transition from Dash Solutions to InetSoft for Executive Summary Dashboards
The decision to upgrade this news website’s Executive Summary Dashboards from Dash Solutions to InetSoft marks a pivotal step in enhancing its data visualization and reporting capabilities. This transition is driven by the organization’s commitment to deliver more insightful, real-time analytics to stakeholders, ensuring informed decision-making in a rapidly evolving media landscape.
Current State Analysis
Dash Solutions has served the organization well in providing basic dashboard functionalities. However, as its data needs have grown, the team has encountered limitations in customization, integration, and data interactivity. The need for an intuitive user interface and advanced analytics tools became paramount, as the team sought to derive actionable insights from complex datasets.
Why InetSoft?
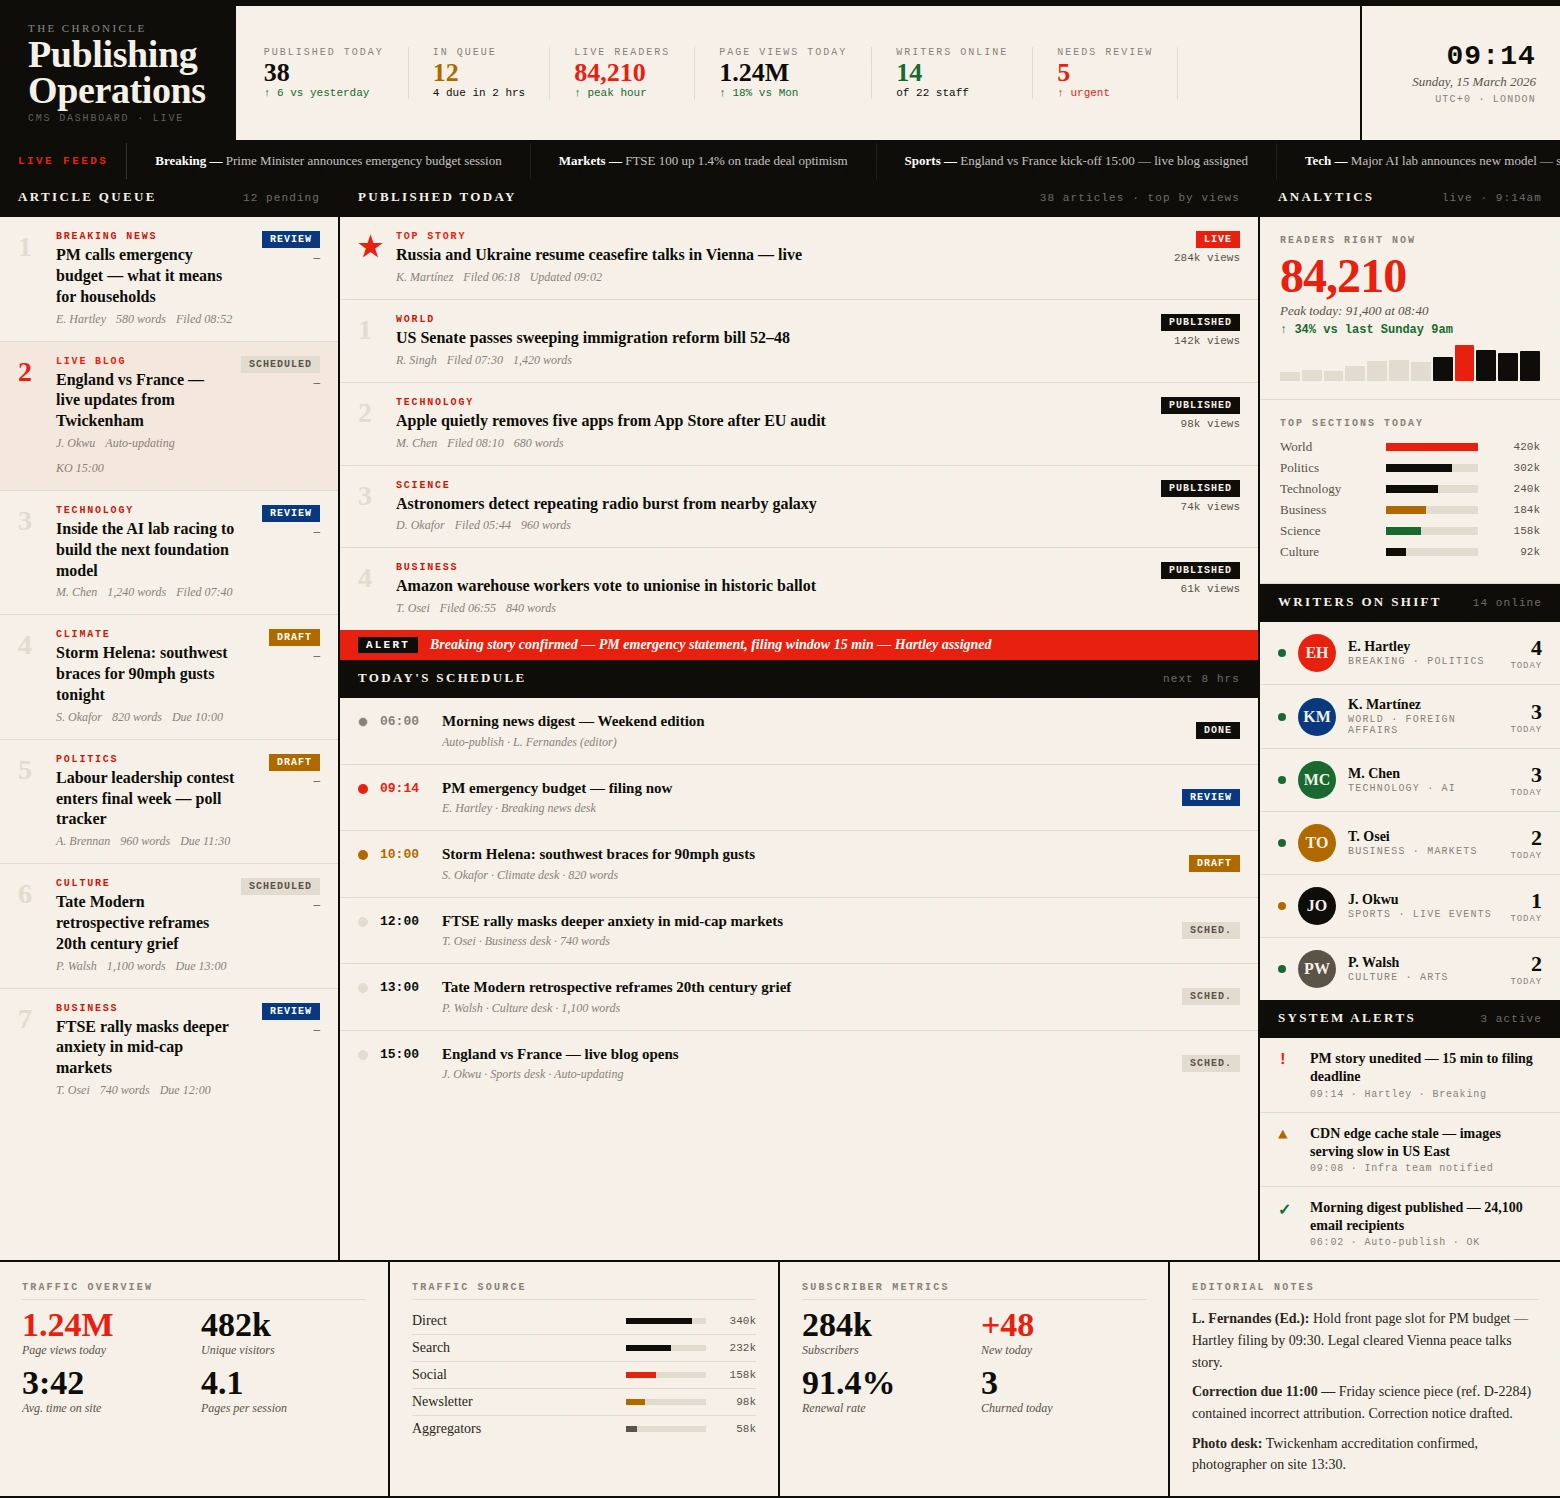
InetSoft stands out as a robust alternative, offering advanced features that align with the organization’s strategic goals. Its powerful data integration capabilities allow for seamless aggregation from various sources, including real-time social media feeds, website traffic metrics, and subscriber engagement stats. This holistic view will empower the editorial team to track performance metrics more effectively.
Key Features of InetSoft
- Advanced Data Analytics: InetSoft enables in-depth analysis through predictive analytics and data mining techniques, fostering a data-driven culture.
- User-Friendly Interface: The platform’s intuitive dashboard design ensures that team members can easily navigate and interpret data, regardless of technical expertise.
- Customizable Dashboards: InetSoft allows for greater customization, enabling teams to tailor dashboards to specific needs, thereby enhancing productivity.
- Real-Time Data Processing: Access to real-time data ensures that the team can respond swiftly to emerging trends and reader interests.
Benefits of InetSoft Implementation
The transition to InetSoft will unlock numerous advantages for the organization:
- Cost Efficiency: Reduced manual reporting time and streamlined workflows lower operational costs while improving ROI on analytics investments.
- Scalability: As data volumes grow, InetSoft scales seamlessly to handle increased complexity without performance degradation.
- Integration Flexibility: Easy integration with existing systems and data sources ensures a smooth transition with minimal disruption.

Implementation Plan
The implementation of InetSoft will be executed in a phased approach to minimize disruption. Initially, training sessions will be conducted to familiarize staff with the new system. Following this, the team will begin a pilot program, allowing a small group of users to test and provide feedback on the platform’s functionalities before a full rollout.
Expected Outcomes
By transitioning to InetSoft, the organization anticipates several positive outcomes that will contribute to overall operational efficiency:
- Improved Decision-Making: With enhanced analytics, editorial decisions will be more data-driven, improving content strategy and audience engagement.
- Increased Efficiency: The user-friendly design will reduce the time spent on data interpretation and reporting, freeing up resources for creative content generation.
- Enhanced Collaboration: Custom dashboards will facilitate collaborative efforts across departments, aligning goals and strategies.
A Leap Forward in Data Analytics
Upgrading to InetSoft represents a significant leap forward in the organization’s data analytics capabilities. As the transition proceeds, the team remains committed to fostering a culture of innovation and responsiveness, ensuring that the news website continues to meet the dynamic needs of its audience. With InetSoft, the organization is poised to transform raw data into actionable insights, driving its mission of journalistic excellence and audience engagement.

More Articles About Executive Summary Dashboards
Below are articles, documentation, and resources related to InetSoft's dashboard software:
J2EE Dashboard - In the HTML head tag, you need to include the report header tag. The only attribute passed to this tag is the reportId. The header tag is responsible for writing java script functions which are used by the report toolbar buttons (mail, export etc). It also writes some external CSS data for the presentation of the report. The Body Tag must be present to ensure correct generation of the report. The HTML body tag must have the onLoad attribute defined with the scriptlet <%=pageContext.getAttribute("sreeOnLoad")%> appended to any onLoad java script you have defined. This is used for invoking java script written by the header tag when the page loads. The toolbar and body can be placed anywhere within the HTML body. Both tags require the reportId attribute. The content enclosed in the body tag is written if the report is not yet available and the processPage attribute of the page is not available...
Java Dashboard - InetSoft's dashboard software is 100% Java code at the server level and HTML, JavaScript, and Flash at the client level, which combined with its SOA architecture and open standards-based technology, makes for an ideal embedding and integration-ready tool for dashboards, scorecards, and reporting in jsp pages...
Job Market Monitoring Dashboard - The Job Market Monitoring Dashboard below is a mock up example of interactive web-based applications for government agencies that InetSoft offers. With InetSoft's easy-to-use, drag-and-drop design, government officials can quickly build productive analytical tools like this one that aid in day-to-day operations, as well as keep business running smoothly...
Joining Dashboard Data - Users of InetSoft's award-winning dashboard software can customize their reports fully by joining dashboard data in an interactive real-time data mashup. When you join two tables, the default join type created is an equi-join. This join type preserves only the rows of the two tables that have matching values on the join columns. Sometimes, in addition to preserving the matching rows, you may also want to preserve all the rows of one or both base tables. A join which preserves all rows of one or both base tables is called an outer join. Tables that do not share the same data model or query can be joined together with a cross join. A cross-joined table contains the cross-product (Cartesian product) of the data in the base tables. This means that every row in the first table is paired together with every row in the second table. The length of the new joined table is the product of the two base table lengths. To cross-join two tables in a Data Worksheet, follow these steps: 1. Drag the first table alongside the second table. 2. Position the dragged table so that its border touches the border of the second table. The join icon should appear. 3. When the cross-join icon appears, release the dragged table...

Joining Dashboard Tables - InetSoft's award-winning dashboard software allows users to join dashboard tables and create custom data mashups from disparate data sources all in real time. A joined table is a composition of two tables that preserves a specified relationship between the participating tables (base tables). The joined table contains all the columns from both base tables, but retains only the rows satisfying a specified join condition. The join condition is a relation between two columns, one from each base table. These two columns are called the join columns. The joined table can be thought of as the intersection of the two tables based on the join columns. There are no restrictions on the nature of the base tables for joins, and joined tables can themselves be used in subsequent join operations. There is no limit to the number of tables that can be successively joined together in this way. Additionally, two tables can be joined together using multiple join conditions, that is, multiple pairs of join columns. This allows you to construct a joined table that embodies a very complex relation between the base tables...
Justice Department Dashboard Example - The Department of Justice (DOJ) is responsible for securing the safety of American citizens by prosecuting crime and protecting civil rights. The DOJ is comprised of many agencies that rely heavily on data analysis, such as Bureau of Alcohol, Tobacco, Firearms and Explosives (ATF), Federal Bureau of Investigation (FBI), and Drug Enforcement Administration (DEA). Business Intelligence is key to understanding patterns of crime as well as social trends such as recreational drug use or gun ownership that, while not illegal, may have widespread impacts on citizens' safety, and which have historically been attractive areas for organized crime. For example, DEA tracks a number of aspects related to the illicit use of fentanyl, including methods of synthesis and common additives (https://www.dea.gov/documents/2022/2022-08/2022-08-22/cy-2021-fentanyl-profiling-program-fpp). Business Intelligence analysis such as this allows the agency to stay abreast of changing pattern of drug usage, inform the public of present dangers, and strategically target enforcement actions.
Keen Event Streaming Dashboard Solution - Looking for a good dashboard solution for Keen event streaming? InetSoft's pioneering dashboard platform can mashup your streaming data with other enterprise sources. Make great-looking cloud-based dashboards with an easy-to-use drag-and-drop designer. View a demo and try interactive examples...

Keep Your Marketing Dashboard Simple - Another bit of advice is really to keep your marketing dashboard simple. Keep it clean. Everything should be made as simple as possible but not simpler. That's a famous quote by Albert Einstein which I really love. The truth is that simple is actually pretty hard to do. Producing something simple people might not realize the work that goes into that because it actually is harder than producing something with a whole bunch of bling. Avoid the eye candy, avoid the flash, and the 3D elements. Avoid the gadgets. All of this kind of stuff makes it harder to understand your data. It's harder to read your data when you have a lot of decorative elements that don't contribute to the meaning of your data or the purpose of what you're trying to discover. Simple is not just anti-clutter though. Here's a dashboard that just has a bunch of tables. Now that could be useful at some point, but really for an executive you just don't expect an executive to be able to look at this and pull information out of it. There might be a use for this but not necessarily for your executive. Simple is something that's pretty darn straightforward...
Key Ecommerce Dashboard Features - Our custom e-commerce dashboard is the epitome of innovation, with features like the Start Session Slider, enabling you to dissect performance metrics throughout the day.
The dashboard is enhanced with filters for visitor and conversion types, dates, and regions, offering a tailored analytical view....
Kissmetrics Dashboard Solution - Looking for a good solution for Kissmetrics dashboard reporting? InetSoft's pioneering BI application produces great-looking cloud-based dashboards with an easy-to-use drag-and-drop designer. Mash up your marketing campaign data with other enterprise sources for a unified view of marketing performance. View a demo and try interactive examples...
Key Performance Indicator Report - Looking for a tool to create a Key Performance Indicator Report to track your company's performance? The InetSoft report tool lets you create a list of key performance indicators (KPIs) that compare current performance data against goals, quotas, and target trends...
KPI Dashboard Software Information - Benefits of InetSoft's KPI dashboard software, StyleBI and StyleBI...
KPI Dashboard - Same information as "KPI Dashboard Software" plus detailed examples of two executive monitoring dashboards, one for sales and one for customer service operations...
KPI Report - Do you want to make KPI reports that compare current performance data against goals, quotas, and target trends? As an innovator in BI products since 1996, InetSoft's award-winning software has been deployed at thousands of organizations worldwide and integrated into dozens of other application providers' solutions serving vertical and horizontal markets of their own...