Information about InetSoft's Quick Dashboard Software
InetSoft's dashboard software stands out for its rapid installation and development process, which is quicker than solutions from larger BI companies, allowing users to get started with data analysis almost immediately. The intuitive drag-and-drop interface simplifies the creation of complex queries, dashboards, and reports, reducing the need for extensive coding or SQL expertise and enabling IT staff and business users to build visualizations swiftly.
This ease of use is complemented by its flexibility in data access and customization options, requiring only minimal specialized IT knowledge for setup and scaling, with zero client deployment and no per-user licensing to streamline implementation.
Furthermore, InetSoft's software supports interactive dashboards that facilitate quick data-driven decisions through features like conditional formatting for anomaly detection and drill-down capabilities that provide detailed insights without overwhelming the main view. Its accessibility on web and mobile platforms ensures that key insights are available anytime, enhancing responsiveness in fast-paced environments. Overall, the combination of powerful features, user-friendly design, and efficient performance makes InetSoft's dashboards a go-to choice for businesses seeking speed without sacrificing functionality.
Below are articles, documentation, and resources related to InetSoft's dashboard software:
KPI Scorecards - KPI Scorecards are a business planning tool that allow users to track performance, available in InetSoft's comprehensive real-time analytical reporting and dashboard software. The StyleBI Scorecard is a collection of objects known as 'Targets'. Each target helps monitor the performance of a metric. It specifies the metric, how and when a metric's performance is evaluated, what the goal or target is, and what action to take if the goal is not met. The scorecard provides an easy way to monitor multiple key performance indicators (KPIs), on a single page. In addition to checking status, you can drill down on a metric to see more detail, and set up alert notification for a failing metric...
KPIs for Customs Border Control Dashboards - Customs and border agencies sit at a difficult intersection: they must protect society, collect revenue, and still keep trade flowing. A well-designed customs border control dashboard turns this complexity into a clear, operational picture. By tracking the right key performance indicators (KPIs), agencies can see where risk is rising, where delays are forming, and where compliance is slipping. The real value comes when those KPIs are not just monitored, but actively managed and improved. A modern dashboard gives customs leadership and frontline managers a shared view of performance across ports, airports, and land borders. It consolidates data from declarations, inspections, risk engines, and revenue systems into a single, visual interface. When designed well, it highlights high-risk shipments, bottlenecks, and compliance gaps in near real time...
Kubernetes Dashboard Application - Are you looking for a good dashboard application that supports Kubernetes? InetSoft's pioneering dashboard reporting platform includes a built-in implementation of Kubernetes. This greatly facilitates the installation and management of the platform. Produce great-looking web-based dashboards with an easy-to-use drag-and-drop designer. Maximize self-service for all types of users. View a demo and try interactive examples...
Labor Department Dashboard Example - The US Department of Labor (DOL) governs many aspects of employment law, pay, benefits, and rights of workers. To fulfill its mission, the DOL must acquire and manage vast amounts of data related to employment, productivity, salaries, and so on. The Department incorporates the Bureau of Labor Statistics to help assemble and manage this data. Some business-intelligence data exploration tools are provided to the public at https://www.bls.gov/data/apps.htm, and provide a glimpse of the kind of analysis and interpretation that needs to be performed on these large data sets to present meaningful insight. Among the information that the Department provides are facts about wages and salaries, workplace injuries, demographic breakdowns, and response of employment to natural disasters and catastrophic national events such as the COVID epidemic. To produce meaningful and informative narratives in all these areas requires powerful business intelligence tools that can analyze and process data in a variety of different ways and that can present the results in a manner that is accessible both to the public and to policy professionals...
Lawyer Dashboard Application - Looking for a tool for a good lawyer dashboard application? InetSoft is a pioneer in self-service dashboarding and offers a solution perfect for lawyers. View a demo and try interactive examples...
Lead Cleanup Tool for Marketing - Are you looking for a good marketing lead cleanup tool? InetSoft's pioneering BI application has very flexible data manipulation capabilities so you can import a new lead file and perform automated tasks such as: flag malformed names or email addresses expand state/province abbreviations into full format map formal company names to shortened, colloquial names assign personas based on job titles Request a Demo. InetSoft Enterprise products are based on the report engine from Style Report Pro and share the same Object Oriented design approach. To address the requirements of a distributed computing environment the InetSoft advanced server report API allows a single report to be viewed from...
Lessons Learned About Dashboards - Some lessons we have learned over time about our dashboards include that the more you can automate the data collection and reporting, the less time is spent on detection and the more time you can spend on resolution. So you need to get your data there where you can see it, and conserve your staff time for other activities. We know that data properly combined together can really lead you to a gold mine of information. Also, it is invaluable to me to be in a senior management meeting when you are competing for funds, and I can say “I know yesterday x happened.” It’s hard to argue with that, it’s hard to argue with facts. So it is really good for you to have facts that you get from a good dashboard. We know also linking the wrong pieces of data can yield misinformation. So make sure you are checking on that and drawing the right conclusions. Ask the right questions, perform the proper analysis and draw your conclusions carefully...

Linux Dashboard Software - Are you looking for Linux dashboard software that is easy to deploy? InetSoft's pioneering dashboard reporting application produces great-looking web-based dashboards with an easy-to-use drag-and-drop designer. Get cloud-flexibility for your deployment. Minimize costs with a Java-based small-footprint solution. Maximize self-service for all types of users. No dedicated BI developer required. View a demo and try interactive examples...
Linux Dashboard Solution - Are you looking for the best Linux dashboard solution? InetSoft's pioneering dashboard reporting application can be hosted on any Linux server and produces great-looking web-based dashboards with an easy-to-use drag-and-drop designer. Get cloud-flexibility for your deployment. Minimize costs with a small-footprint solution. Maximize self-service for all types of users. No dedicated BI developer required. View a demo and try interactive examples...
Live BI Dashboard Deployments - In the past we had live BI dashboard deployments where you could exactly copy things that you have built out into a remote environment. Now we support multiple environments right here within Style Studio so I can easily switch over to my production server or to the development server. And so using a development server directly, the left hand side now updates to show me additional sources that are defined in that environment, and I can also connect directly to that remote report repository. So here I can open up a report from the development server’s repository, right here within Style Studio, any changes that I make and save will be saved directly back to the server. And so that this is a really good way to do a live development, or make some quick changes based on an issue or some requests that’s come out for a change without having to go through a full development and deployment cycle. Additionally, when I have a report, I can basically save the report either as a file and this is the whole behavior as an SRT and then manually deploy that report out, or I can also save it back into the repository automatically creating a new entry, and so it can be run from the Web interface. And lastly, when I deploy this report, my deployment dialog now has two options, either deploying out to a repository, for example, deploying from the development server to the production server...
Live Dashboard Software - Looking for live dashboard software? InetSoft is a pioneer in self-service dashboarding and makes it easy to create real-time dashboards with a drag and drop designer. View a demo and try interactive examples...

Live Data Dashboard - InetSoft's award-winning dashboard software allows users to access live data and analyze current patterns and trends in order to predict rapid changes and stay ahead of business cycles. To preview a table, right-click the table title bar, and select 'Preview' from the context menu. This opens the Preview tab, which displays all visible columns of the table. You can only preview one table at a time. In the table preview tab, click the table to see table information, including the record numbers being displayed. Click outside the table to see information about the Worksheet. A new table by default displays only metadata. However, the table can also display “live data” drawn from the database. This often provides a useful alternative to Preview...
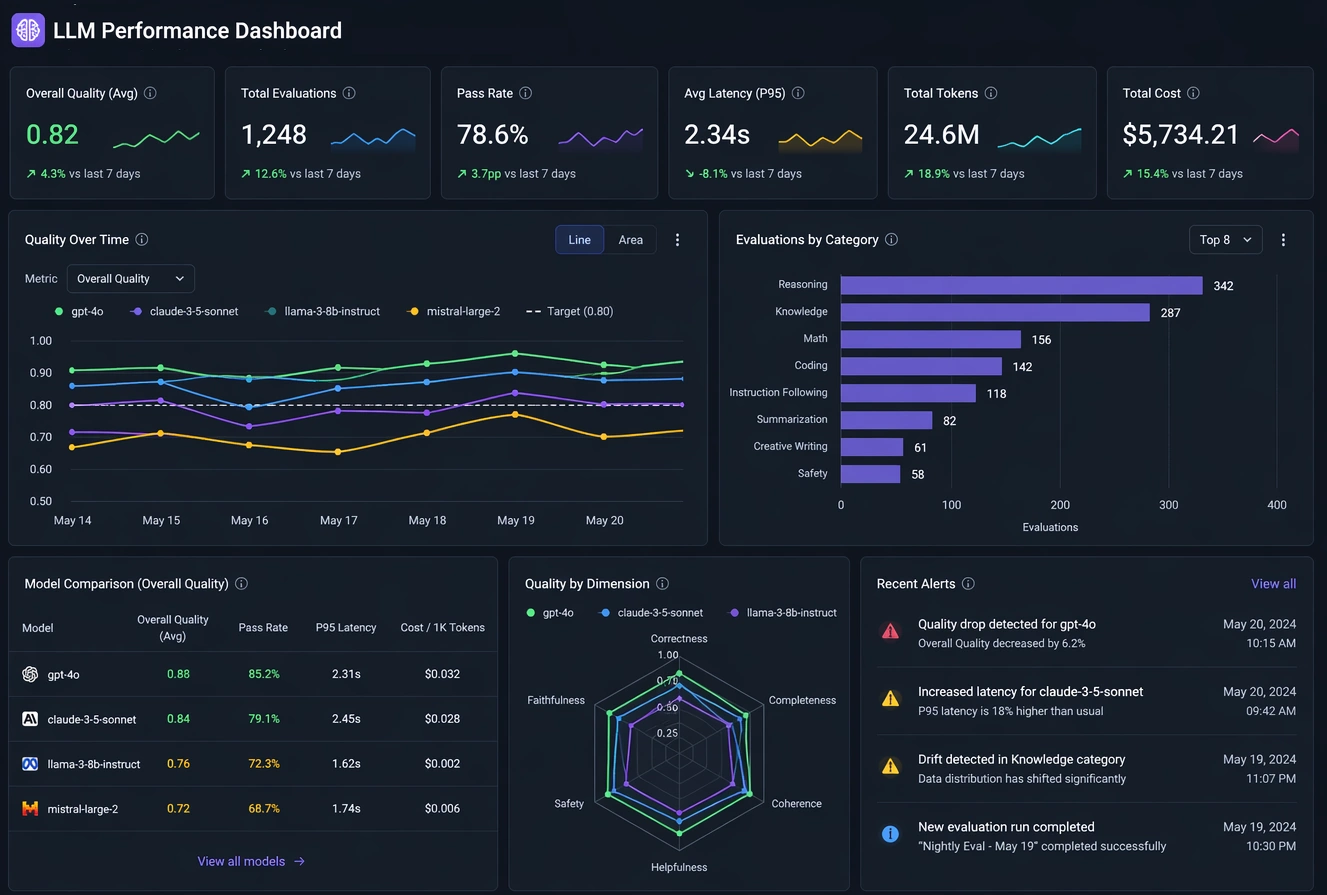
LLM Performance Dashboards - Large Language Model (LLM) performance dashboards exist to answer a few core questions: How fast is the model? How good are its answers? How much does it cost? and Is it behaving safely and reliably? To do that, they track a set of recurring metrics that fall into four broad categories: latency and throughput, token and cost metrics, quality and safety metrics, and system reliability and user experience metrics. Below is a breakdown of the most common metrics you will see on an LLM performance dashboard, what they mean, and the levers you can pull to affect them in practice. Time to First Token (TTFT) What it is: TTFT is the time from when a request is sent to the model until the first token of the response is received. It captures the “initial wait” before the model starts streaming anything back...
Loan Dashboard - Visualize Relationships: Our Loan Dashboard empowers lenders to effortlessly visualize the intricate relationships between various factors and loan statuses. By providing an intuitive interface, lenders can grasp essential insights at a glance. Interactive Data Exploration: Through the power of interactive charts and sliders, lenders can proactively monitor loan trends, fine-tune strategies, and adapt to dynamic market conditions....
Loan Management Dashboard - Consumer lending is a growing industry as more people borrow money to buy homes, finance their studies and meet other financial obligations. Lenders and financial institutions offer a wide range of loans, but these companies must have a good understanding of their performance to remain competitive. As a lender, tracking your company's performance may be challenging. So many numbers are floating around, so a dashboard is an easy way to track your performance and measure your KPIs. Using a dashboard also helps you to arrange and organize your data in a way that is easy to read and works for your business. You can pull automatically generated reports and view your vital information in easy-to-read tables and graphs. Using a dashboard saves time by eliminating the need to manually arrange data and put together information in a meaningful way. Your dashboard is typically a visual representation of your KPIs so that you can pick up on trends, track progress and decide more effectively. If you're a loan company, consider including the following KPIs and analytics on your dashboard...

Locking the Contents of a Public Dashboard - We are completely Web-based application, and we have clients embedding us in .NET applications as well. If you are using Sharepoint, you are just basically passing on the right InetSoft URL to display a chart or a report. Everything is controlled with a URL and the right parameters. If I want to extract model, I can do as it easily by passing on a parameter. This is the visualization module. Now let's take a look at the more traditional reporting module. The dashboards in the visualization module were all about hands-on interactivity, exploration analysis, and creating dashboards. Reporting modules are for the more traditional paginated pixel perfect report, with more emphasis on the presentation layout, printer-ready documents like display data. You can have your basic interactivities. Let’s start with a summary report. Here I am summarizing my top 10 selling products. I can always hyperlink from one report to another and implement a drill down. If I click on this product, I can hyperlink to another report and look at all the orders placed for that product. Of course, this interactivity is all out of the box functionality. You just add a chart or cross tab or pivot table, and automatically interactivity buttons will be there for you, where you can click on them and view the details...
Logistics Dashboard Reporting Software - In an increasingly competitive logistics environment, controlling and understanding logistics data can make a big difference in business activities, and using InetSoft's StyleBI logistics analytics tools will enable logistics managers to understand and take full control of their departments or organizations. To help logistics managers accomplish this type of success, InetSoft has created a dashboard of professional logistics metrics that will not only ensure that logistics operational processes are running smoothly, but will help optimize costs while still maintaining quality service...
Loss Run Dashboards and KPIs - A loss run dashboard is a visual representation of an organization's insurance claims data, providing insights into trends, patterns, and the overall performance of insurance policies. It typically includes key metrics such as total number of claims, incurred losses, claim frequency, severity, and loss ratios. Through graphs, charts, and tables, it enables stakeholders to quickly grasp the status of insurance claims, identify areas of concern, and make informed decisions regarding risk management strategies. This tool aids in assessing the effectiveness of insurance coverage, optimizing claims management processes, and ultimately mitigating financial losses for the organization. A loss run dashboard is a powerful tool for monitoring and managing insurance claims data effectively. It provides stakeholders with valuable insights into the performance of insurance policies, helping them make informed decisions to mitigate risks and reduce financial losses. Key Performance Indicators (KPIs) play a crucial role in assessing the health of insurance claims portfolios and identifying areas for improvement. Below are some essential KPIs commonly included in a loss run dashboard along with explanations of their significance...
Mailchimp Dashboard Solution - Looking for a good solution for Mailchimp dashboard reporting? InetSoft's pioneering BI application produces great-looking cloud-based dashboards with an easy-to-use drag-and-drop designer. Mash up your marketing campaign data with other enterprise sources for a unified view of marketing performance. View a demo and try interactive examples...

Making a Dashboard Solution Plug into Predictive Analytics - Now let’s talk in terms of making a dashboard solution plug into predictive analytics. There is something called PMML. That’s industry standard language, it’s called Predictive Modeling Markup. And PMML is a way that you can exchange predictive models to run against standard databases. So a BI solution should support PMML. Analytic solutions like SAS and SPSS can output PMML structures, and you just need to have a way to import them. There are a couple of issues there but delivery formats that are appropriate for organizations, so dashboards, alerts, mobile capabilities, time limits, we talked about. There are lots of problems with spreadsheets. One of the things we see that distinguishes the innovative firms is they are delivering information in a much more timely fashion. You can see a huge difference between the innovative firms and the tactical ones. Does timely mean day prior information...
Making Dashboards with the Best Tool - Are you searching for the best tool to create dashboards? InetSoft's pioneering dashboard reporting application produces great-looking web-based dashboards with an easy-to-use drag-and-drop designer. Maximize self-service for all types of people. Top rated by customers on G2.com. View a demo and try interactive examples...
Making Good Sales Information Dashboards - A sales dashboard is an effective tool for tracking the performance of a company's sales team, providing insights into how the business is doing and helping to identify areas for improvement. A good sales dashboard should be easy to understand, informative, and relevant to the needs of the user. When designing a sales dashboard, it is essential to start by understanding the needs of the users. What information do they need to see and how do they want to see it? This will help determine the type of dashboard that is best suited to the user's needs and the data that should be displayed. Once the information needs have been identified, the next step is to determine the most effective way to present the data. A dashboard should be visually appealing, with clear and easy-to-read charts, graphs, and other types of data visualization. To ensure that the dashboard is user-friendly, it is important to keep the number of visualizations to a minimum and to focus on the most important information. Another important aspect of designing a good sales dashboard is to ensure that the data is up-to-date and accurate. This requires a reliable and efficient data source, as well as a robust system for updating the dashboard in real-time. It is also important to ensure that the data is secure, with appropriate measures in place to protect against unauthorized access and data breaches...

Mail Handling Dashboard - This Mail Handling Dashboard is designed as a full-screen operational command center for a modern mail or parcel sorting facility. Its primary purpose is to translate high-volume, high-velocity operational data into clear, actionable signals that supervisors, floor managers, and executives can understand at a glance. The dashboard emphasizes real-time visibility, trend awareness, and performance accountability across people, processes, and throughput. By combining high-level KPIs with supporting trend charts and breakdowns, it avoids the common trap of showing “interesting numbers” without operational meaning. The Volume Processed KPI represents the total number of mail pieces handled within the selected time frame. This includes letters, flats, packages, and other defined mail classes...
Management Dashboard for Energy - Are you looking for good energy management dashboard software? InetSoft's pioneering BI reporting application produces great-looking web-based dashboards with an easy-to-use drag-and-drop designer. Get cloud-flexibility for your deployment. Minimize costs with a small-footprint solution. Maximize self-service for all types of users. No dedicated BI developer required. View a demo and try interactive examples...
Management of Dashboards - The business dashboard is the most powerful analytic weapon in the modern business' arsenal. With that in mind, we've created this tutorial to help you get the most out of you dashboards. Learn to manage your dashboards and get the edge on the competition. To create and edit Viewsheets: 1. Click the ‘New Viewsheet’ button on the main toolbar. This opens the ‘New Viewsheet’ dialog box. 2. In the ‘New Viewsheet’ dialog box, select the Worksheet (from ‘Global’ or ‘User’ scope) that will provide data to the Viewsheet. This Viewsheet will have access to all of the data tables defined in the underlying Worksheet. Note that you are not required to select a Worksheet. If you wish to associate the Viewsheet with a Worksheet at a later time, select the ‘No Worksheet’ option...