Evaluate InetSoft's Mailchimp Dashboard Solution
Are you looking for a good solution for Mailchimp dashboard reporting? InetSoft's pioneering BI application produces great-looking cloud-based dashboards with an easy-to-use drag-and-drop designer. Mash up your marketing campaign data with other enterprise sources for a unified view of marketing performance. View a demo and try interactive examples.
Mailchimp Email Marketing Dashboards
A Mailchimp Email Marketing Dashboard gives marketing teams a centralized view of campaign performance, subscriber engagement, email deliverability, and revenue generation. Instead of reviewing multiple campaign reports individually, marketers can access key performance indicators, trends, and audience insights from a single dashboard. This type of dashboard helps organizations understand the effectiveness of their email marketing programs and make data-driven decisions that improve engagement and return on investment.
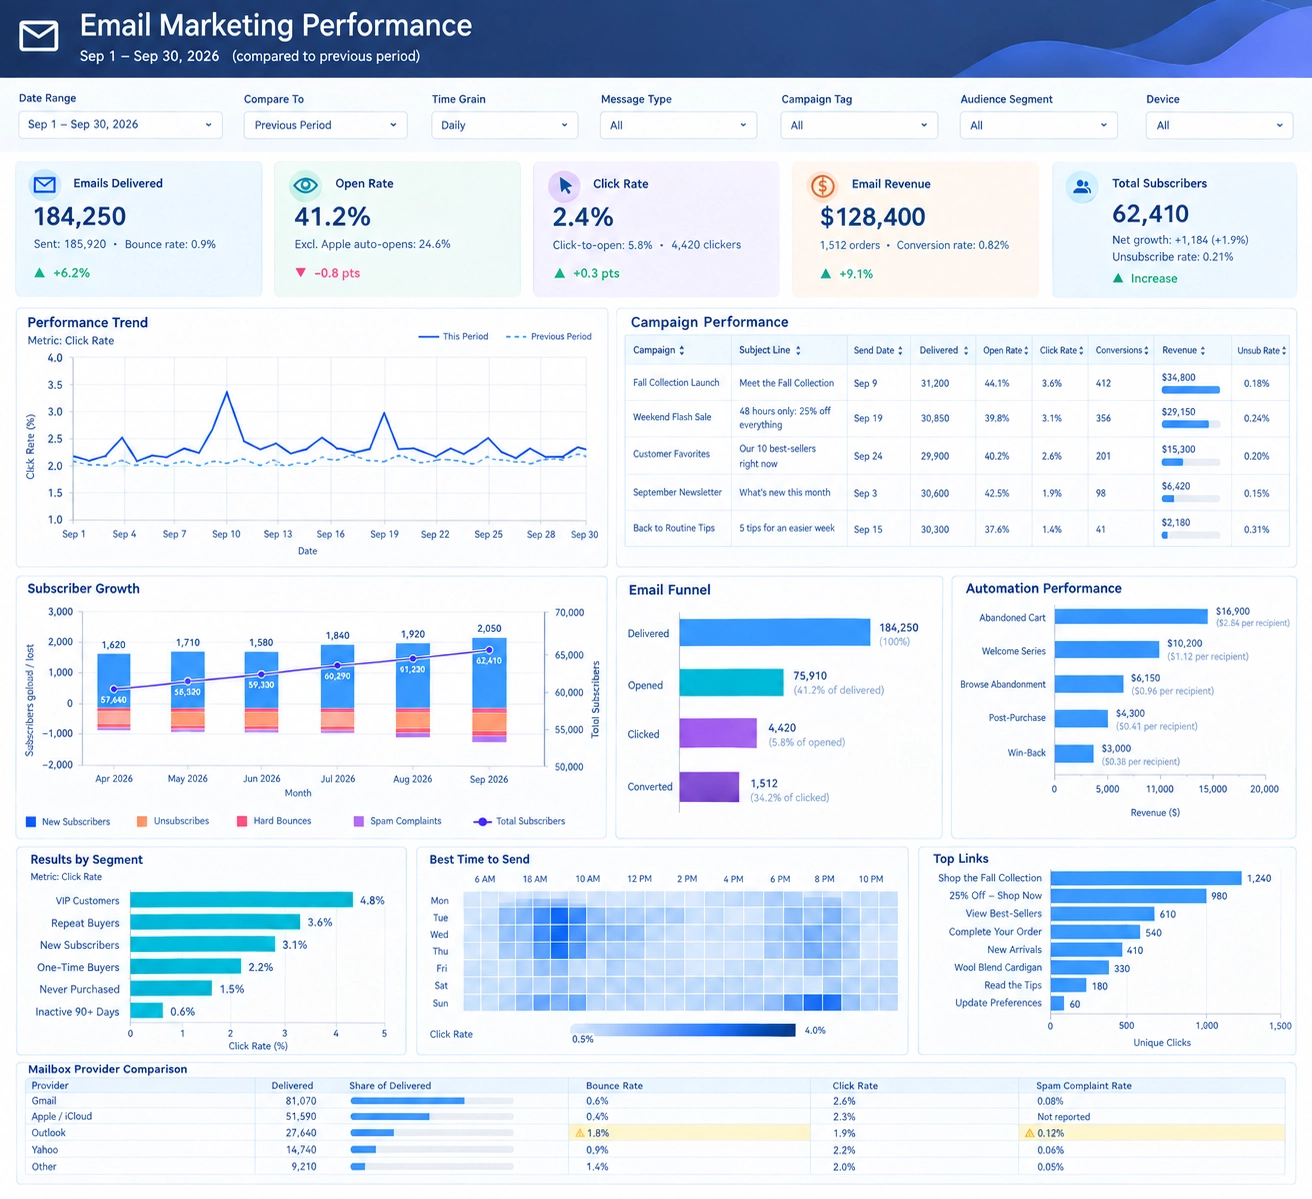
The dashboard shown here provides a comprehensive overview of email marketing activity over a selected reporting period. Users can filter information by date range, comparison period, message type, campaign tag, audience segment, and device category. These flexible controls allow marketers to analyze performance at both a high level and in greater detail, making the dashboard valuable for executives, campaign managers, and marketing analysts alike.

Key Performance Indicators
At the top of the dashboard are several KPI scorecards that summarize overall email performance. These metrics include Emails Delivered, Open Rate, Click Rate, Email Revenue, and Total Subscribers. Together, these measurements provide an immediate understanding of campaign effectiveness and audience engagement.
Emails Delivered measures the total number of emails successfully delivered to recipients' inboxes. This metric reflects the scale of campaign activity and serves as the foundation for evaluating subsequent engagement metrics. Open Rate represents the percentage of delivered emails that recipients opened, helping marketers assess subject line effectiveness and sender reputation.
Click Rate tracks the percentage of recipients who clicked on links within an email. Since clicks represent active engagement, this metric is often used to evaluate content quality and call-to-action performance. Email Revenue connects campaign activity directly to business outcomes by measuring the total revenue generated from email-driven conversions. Total Subscribers displays audience size and overall list growth, helping marketers monitor the health of their subscriber database.
Performance Trend Analysis
The Performance Trend chart tracks engagement metrics over time and compares current performance against a previous reporting period. Trend analysis allows marketing teams to identify spikes, declines, and ongoing patterns that may affect campaign success.
For example, sudden increases in click rates may be associated with special promotions, product launches, or highly targeted campaigns. Likewise, periods of lower engagement may reveal audience fatigue, weaker messaging, or seasonal changes in customer behavior. By comparing current and previous periods, marketers can determine whether optimization efforts are producing measurable improvements.
Trend reporting is particularly valuable because it moves beyond static performance measurements and reveals how marketing effectiveness evolves over time. Understanding long-term trends helps organizations make more informed strategic decisions.

Campaign Performance Reporting
The Campaign Performance section provides detailed results for individual Mailchimp campaigns. Information such as campaign name, subject line, delivery volume, open rate, click rate, conversions, revenue, and unsubscribe rate can be reviewed side by side.
This level of detail helps marketers identify which campaigns produce the strongest results. Successful campaigns can serve as models for future promotions, while underperforming campaigns can be analyzed for potential improvements. Comparing campaign metrics also helps marketing teams test different subject lines, content formats, promotional offers, and audience targeting strategies.
Revenue reporting is particularly important because it shows which campaigns contribute most directly to organizational goals. Marketing managers can use this information to allocate resources toward initiatives that generate the highest return.
Subscriber Growth Monitoring
Subscriber growth is a critical indicator of long-term marketing success. The Subscriber Growth chart tracks new subscribers, unsubscribes, hard bounces, spam complaints, and total audience size over time.
A growing email list expands future marketing opportunities, while increasing unsubscribe rates may indicate dissatisfaction with message frequency or content relevance. Monitoring hard bounces and spam complaints helps maintain list quality and protect sender reputation.
The dashboard combines acquisition and retention metrics into a single visualization, allowing teams to quickly determine whether audience growth is healthy and sustainable. Organizations can also evaluate the effectiveness of lead generation initiatives by correlating subscriber increases with specific campaigns and promotions.

Email Funnel Analysis
The Email Funnel visualization illustrates the journey from delivery to conversion. The funnel begins with delivered emails and follows recipient activity through opens, clicks, and completed conversions.
Funnel analysis helps marketers understand where audience engagement declines during the customer journey. A large gap between delivered emails and opens may indicate a need for improved subject lines. Strong open rates paired with weak click rates may suggest that content or offers are not compelling enough to encourage action.
By analyzing drop-off points, marketers can focus optimization efforts where they will have the greatest impact. Funnel reporting transforms engagement data into actionable insight that supports continuous improvement.
Marketing Automation Performance
Mailchimp's automation capabilities are designed to deliver personalized messages based on customer behavior. The Automation Performance section evaluates automated campaigns such as abandoned cart reminders, welcome email series, browse abandonment campaigns, post-purchase communications, and customer re-engagement programs.
Automated campaigns often generate higher engagement because they are triggered by real customer actions. The dashboard measures revenue generated by each workflow and calculates performance indicators that help marketers compare automation effectiveness.
Organizations can use these insights to prioritize the workflows that produce the strongest results and refine automation sequences that are underperforming. This improves efficiency while increasing revenue opportunities.
Audience Segmentation Insights
The Results by Segment section compares engagement rates among different audience groups. Segments may include VIP customers, repeat buyers, new subscribers, inactive users, and customers with varying purchase histories.
Segmentation is one of the most powerful approaches in email marketing because different audiences respond differently to content and promotions. Understanding segment-specific behavior allows marketers to create personalized experiences that improve engagement and conversion rates.
Rather than treating all subscribers the same, organizations can tailor campaigns to match the needs and preferences of each audience group.
Best Time to Send
The Best Time to Send heat map identifies the periods when recipients are most likely to engage with emails. By reporting engagement levels across days of the week and hours of the day, the dashboard helps marketers schedule campaigns more effectively.
Optimal send-time analysis often results in higher open rates and click rates without increasing marketing costs. Data-driven scheduling ensures that marketing messages arrive when subscribers are most likely to notice and interact with them.

Top Links and Content Performance
The Top Links section ranks the most frequently clicked links within email campaigns. This analysis reveals which products, promotions, articles, or resources attract the highest levels of subscriber interest.
Understanding content preferences helps marketing teams improve future campaigns and focus attention on topics that generate the strongest engagement. Link performance can also support merchandising decisions, content planning, and website optimization efforts.
Mailbox Provider Comparison
Deliverability is a critical component of any email marketing strategy. The Mailbox Provider Comparison section evaluates performance across major email providers such as Gmail, Outlook, Yahoo, and Apple Mail.
Metrics including delivered volume, bounce rate, click rate, and spam complaint rate help marketers identify potential deliverability issues before they impact campaign success. Monitoring provider-specific performance helps ensure that emails consistently reach subscriber inboxes and maintain strong engagement levels.

Business Value of a Mailchimp Dashboard
A Mailchimp Email Marketing Dashboard transforms campaign data into meaningful business intelligence. By combining subscriber growth, engagement metrics, automation performance, conversion tracking, and revenue measurement in a single interface, the dashboard provides a complete view of email marketing effectiveness.
Marketing leaders can use these insights to improve targeting, optimize campaign timing, increase customer engagement, and maximize return on marketing investment. With access to real-time performance indicators and detailed campaign analytics, organizations can make faster, more informed decisions that drive measurable business results.
Frequently Asked Questions
What metrics does a Mailchimp email marketing dashboard track?
It can bring together delivered emails, open and click rates, revenue, subscriber totals, campaign results, conversions, unsubscribe rates, automation performance, and email deliverability metrics.
How can subscriber growth monitoring help marketing teams?
Tracking new subscribers, unsubscribes, hard bounces, spam complaints, and total audience size helps teams assess whether list growth is healthy and sustainable and identify changes that may affect audience quality.
How does email funnel analysis help improve campaigns?
Following recipients from delivery through opens, clicks, and conversions helps teams find where engagement drops off and focus improvements on subject lines, content, or offers.
How can mailbox provider comparisons support deliverability?
Comparing delivered volume, bounce rate, click rate, and spam complaint rate across providers can reveal provider-specific issues that may affect inbox placement and engagement.
More Resources and Articles about InetSoft's Mailchimp Dashboard Solution
Alternative to Infor Dashboard Reports - InetSoft has an easily customized BI solution for the Baan (Infor) ERP platform. Dashboards and reports can be created very quickly that will increase visibility into process performance metrics and a reduce manual labor associated with information gathering and presentation...
Analyzing Government Spending with a Dashboard - The Government Spending Analysis Dashboard below provides the perfect solution for the American Recovery and Reinvestment Act of 2009 that forces governments to be more transparent with information regarding the public. InetSoft's technology thrives off of efficiency along with power to provide users with a top of the line and easy-to-manage business intelligence solution...
Application Providers Seeking Embeddable Reporting - For application providers seeking embeddable reporting or for enterprises looking for a reporting solution to embed in an enterprise portal, InetSoft's StyleBI offers a reporting solution that is highly integratable into other applications and offers maximum user interface customization...
Best Dashboard Design Examples - Why is it important to find out what makes the best dashboard design? A well-designed dashboard is easy on the eyes and allows users to quickly observe trends and correlations in their data. While designers can often fall for the temptation to overload their dashboards with too many elements, a crisp and efficient organization of KPI's will save the end users time and reduce mental strain in performing data analysis...
Better PostgreSQL Business Intelligence - The information access needs of each business vary greatly. From the data sources used, to the dashboard or report design requirements, to the security needed; every company has their own unique set of requirements that must be fulfilled. One important topic that is often forgotten is that of data source integration. If data cannot be retrieved, it cannot be used to produce reports. StyleBI provides interfaces for multiple data source types and a flexible Java API that can interface with any custom data source...

Building a Global Network Performance Dashboard - A dashboard for monitoring an enterprise's global network performance must access many data sources. And InetSoft, a premium BI software vendor, offers an application that handles big data with ease. Some of the features of the InetSoft flagship product, StyleBI, were made to deal with problems specific to wrangling overly-large, often diverse and disparate, data sources...
Check Out Our 2-Minute Intro Demo - View a short 2-minute presentation to get an overview of how InetSoft's data mashup enables visual analytics, pixel-perfect reporting and machine-generated intelligence...
Complete Quick Dashboard Software - StyleBI is a complete BI solution, with a heavy focus on ease-of-use. Everything from deployment, to monitoring, to reporting is made quicker and easier with StyleBI...
Dashboard Application for Lawyers - Looking for a good lawyer dashboard application? InetSoft is a pioneer in self-service dashboarding and offers a solution perfect for lawyers. View a demo and try interactive examples...

Dashboard Design Inspiration Examples - Looking for inspiration for well-designed dashboard design ideas? Peruse these examples created with InetSoft's easy-to-use web dashboard software...
Dashboard Report Server Option - The dashboard report server offers a unique approach to creating reports that allows for faster streamlined data retrieval. InetSoft's dashboard software is a flexible and powerful performance monitoring solution. View the example below to learn more about the StyleBI solution...
Digital Business Dashboards - Are you searching for a digital dashboard for your business? InetSoft's StyleBI offers a 100% web-based, server-based solution that delivers exactly what you're looking for...
Example of a Fund Raising Dashboard - I am opening up a fund raising dashboard example, and this is the disguised data. It's not their actual data, but the story is very similar. The dashboard comes up with a set of charts. Here we're looking at a chart of data on the prospects. It's got a list of all the prospects. There are 93,743 of them. There is some information like their name, how much they've given, some descriptive characteristics about how they are affiliated with the school...
How-To Create a Portlet Dashboard - Users can easily create a portlet dashboard using StyleBI - InetSoft's comprehensive real-time analytical reporting and dashboard software solution. View the example below to learn more about the StyleBI solution...
HTML5 BI Dashboard Software - HTML5 is the replacement for Flash for interactive web-based applications. InetSoft offers an HTML5-based BI solution that is ideal for both desktop and mobile usage powered by a server-based application that can be hosted anywhere: on premises, in a private or public cloud, or by InetSoft at AWS...
InetSoft's Dashboards Running on the iPad - Let's look at an example in order to visualize what we mean by taking that raw data and actually putting it into a format the end users could see What I have open here is my iPad, and this is an InetSoft StyleBI dashboard running on the iPad. You might have seen example dashboard already, and it's a really great way to take your data, visualize that and manipulate that data, but I'm going to show you something that you might not know. What I'm going to do is click on this dashboard...
Intelligent CRM Dashboards - For this example of intelligent CRM interactions, we will use Amtrak. Because of the fact that most of the time when people are traveling on trains, and they can't use the Internet, they didn't have all these Web capabilities so they stayed really call center focused. They have all the station agents where you can buy tickets. Now they have a great website that 85,000 people visit on a monthly basis...

Live Interactive Visual Analysis Example - The Interactive Visual Analysis Example below portrays the rich and interactive nature of InetSoft's dashboard software. A web-based analytical dashboard, the chart below uses InetSoft's own Data Block patent technology for data mashup purposes, serving as an effective way to analyze multi-dimensional data...
Mobile BI Solution from InetSoft - Are you looking for the best mobile BI solutions? Since 1996 InetSoft has been making BI software that is easy to deploy and easy to use. Get interactive dashboards on phones and tablets quickly. With HTML5 delivery via a browser no app download is required. View a demo and read customer reviews from some of the 5,000+ happy customers...
Provide IT-enabled Self-Service - Data virtualization is one of the design principles underlying our Data Block technology and data mashup engine. User do not need to know where data blocks are sourced or reside. They just assemble them into a way that is needed. Because of this flexibility in the data layer, end users can drill in any path they define...
Published Dashboard Design Examples - InetSoft has published a constantly expanding number of articles and analyses at www.dashboardfree.com/. These are based on various tips, tricks, and fundamentals of dashboard designs from industry experts and bloggers. Below are several dashboards created with these tips in mind...

Try InetSoft's Visualization Dashboard Software - Are you looking for the best visualization dashboard software? Since 1996 InetSoft has been making dashboard software that is easy to deploy and easy to use. Build self-service oriented interactive visualizations quickly. View a demo and read customer reviews...
Visually Compose SQL Queries - Designers and analysts have the freedom to choose how to write SQL queries in the web app. SQL-fluent users might prefer to hand write SQL aided with meta-data to have maximum flexibility. Other power users would simply compose queries visually. This approach removes the need for exact knowledge of particular database's SQL syntax...
Vital Weekly Dashboard Example - Weekly dashboards are vital for the regular monitoring and control of business conditions. But in many cases, the production of weekly dashboards puts additional demands on administrators and employees. And with so much business travel and work done out in the field, dashboard accessibly and deliverability can also be an issue. InetSoft's solution, StyleBI, makes the setting up and delivery of weekly dashboards easy and efficient...
Which is the Best Operations Dashboard Solution? Operations dashboards are useful in managing and displaying the daily activities that go on within a company. Information provided by these applications allows companies to examine the key performance indicators which are vital towards achieving business goals or objectives...